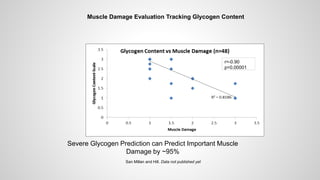
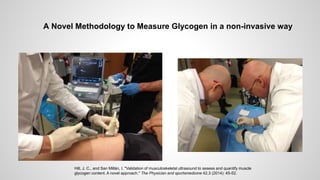
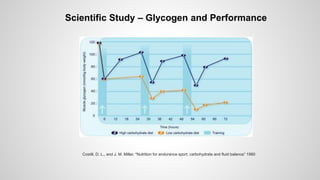
This study evaluated a novel method for indirectly assessing muscle glycogen levels in athletes through non-invasive measurements of maximal blood lactate levels ([La-]b max) and maximal carbohydrate oxidation rates (CHOox max). The results showed that 30% of men and 24% of women had suboptimal [La-]b max, indicating lower glycogen levels. [La-]b max, CHOox max, and respiratory exchange ratio were significantly higher in athletes with optimal vs. suboptimal [La-]b max, while fat oxidation was lower. This suggests [La-]b max and CHOox max may be a practical way to identify athletes with insufficient glycogen storage and risk for impaired performance.


![INDIRECT ASSESSMENT OF GLYCOGEN STATUS IN COMPETITIVE ATHLETES
I. San Millán1, C. González-Haro2, J. Hill, FACSM1,
1School of Medicine, University of Colorado Denver, Denver, CO.; 2Department of Pharmacology and Physiology, School of
Medicine, University of Zaragoza, Spain
CONCLUSION: The measurement of [La-]b max and CHOox max in competitive athletes could be a good and practical approach to indirectly evaluate glycogen status as well as to identify
suboptimal glycogen storages that can ultimately affect athletic performance.
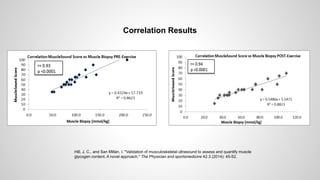
RESULTS: The results of the present study sowed that 30% for men and 24% for women showed suboptimal [La-]b max (GS). The correlation
between [La-]b max and CHOox max was high in men (r=0.771, p<0.05) and low in women (r=0.373). In men, [La-]b max, CHOox max, and
RER max were significantly higher in GO vs. GS, whereas FATox max was significantly lower in GO vs. GS. In women, there were not found
significant differences neither in CHOox max nor in FATox max. Nevertheless [La-]b max, and RER max were significantly higher in GO vs. GS.
METHODS: 82 competitive men (28 professionals and 54 non-professionals) and 17 competitive carried out a bycicle ergometer test, starting at 2 W·kg-1 with
increments of 0.5 W·kg-1 until exhaustion, the duration of three first steps was 5 min, and then 10 min. Oxygen uptake (VO2) and carbon dioxide (VCO2) were
measured (ParvoMedics TrueOne 2400, Sandy, UT) throughout the test and blood lactate concentration ([La-]b) (YSI 1500, Yellow Springs Instruments, Ohio) at the
end of each step. [La-]b max was considered the value at the end of last step of exercise. Fat and carbohydrate oxidation rates (FATox and CHOox) were estimated
by means of Frayn’s equations. A cutoff of 1 SD respect to the ([La-]b max) was suggested in order to classify the subjects in two groups: GO (Optimal [La-]b max)
and GS (Suboptimal maximal [La-]b max) with [La-]b max of <5.27 mM in men and <4.00 mM in women respectively as the cutoff. A Student t-test for independent
data was used to compare groups, the determination of the Pearson correlation coefficient was used to verify the existence of relationships between variables, level
of statistical significance was set at p<0.05.
ACKNOWLEDGEMENTS: The authors would like to express their gratitude to all subjects for their cooperation in this study.
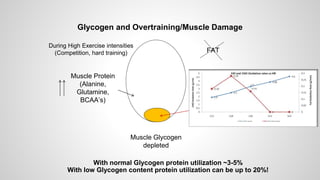
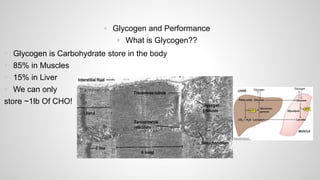
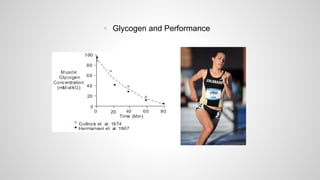
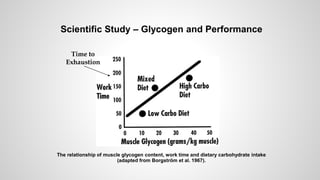
INTRODUCTION: Proper glycogen storage is of great importance for athletic performance. Multiple studies show the positive correlation between glycogen storage and performance. Nevertheless, glycogen
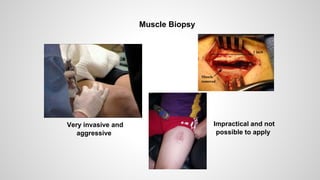
assessment is difficult to determine due to the invasive and impractical nature of muscle biopsies. Therefore, it is difficult to identify suboptimal glycogen levels in athletes. Throughout the measurements of maximal
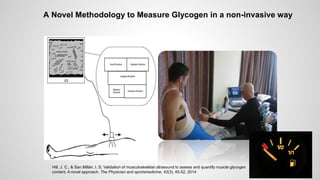
blood lactate levels ([La-]b max) and maximal carbohydrate oxidation rates (CHOox max) it could be possible to indirectly estimate muscle glycogen status in competitive athletes and identify suboptimal glycogen
levels. The purpose of this study was to assess indirectly muscle glycogen status through measurement of [La-]b max and CHOox max.
Figure 1. [La-]b max, CHOox max, FATox max and RER max comparisons between both groups of men. *p<0.05,
***p<0.001.
Figure 2. [La-]b max, CHOox max, FATox max and RER max comparisons between both groups of women. *p<0.05, **p<0.01.
0
1
2
3
4
5
6
7
8
9
10
[La-]b max CHOox max
[La-]bmax(mM)&CHOoxmax(g·min-1)
Women GO
GS
**
0.0
0.5
1.0
1.5
2.0
2.5
3.0
FATox max RER max
FAToxmax(g·min-1)&RERmax
Women GO
GS
*
0
1
2
3
4
5
6
7
8
9
10
[La-]b max CHOox max
[La-]bmax(mM)&CHOoxmax(g·min-1)
Men GO
GS
***
***
0.0
0.5
1.0
1.5
2.0
2.5
3.0
FATox max RER max
FAToxmax(g·min-1)&RERmax
Men GO
GS
*
***](https://image.slidesharecdn.com/vailsymposium-inigo-150811210248-lva1-app6891/85/Dr-Inigo-San-Millan-Presentation-35-320.jpg)
![INDIRECT ASSESSMENT OF GLYCOGEN STATUS IN COMPETITIVE ATHLETES
I. San Millán1, C. González-Haro2, J. Hill, FACSM1,
1School of Medicine, University of Colorado Denver, Denver, CO.; 2Department of Pharmacology and Physiology, School of
Medicine, University of Zaragoza, Spain
CONCLUSION: The measurement of [La-]b max and CHOox max in competitive athletes could be a good and practical approach to indirectly evaluate glycogen status as well as to identify
suboptimal glycogen storages that can ultimately affect athletic performance.
RESULTS: The results of the present study sowed that 30% for men and 24% for women showed suboptimal [La-]b max (GS). The correlation
between [La-]b max and CHOox max was high in men (r=0.771, p<0.05) and low in women (r=0.373). In men, [La-]b max, CHOox max, and
RER max were significantly higher in GO vs. GS, whereas FATox max was significantly lower in GO vs. GS. In women, there were not found
significant differences neither in CHOox max nor in FATox max. Nevertheless [La-]b max, and RER max were significantly higher in GO vs. GS.
METHODS: 82 competitive men (28 professionals and 54 non-professionals) and 17 competitive carried out a bycicle ergometer test, starting at 2 W·kg-1 with
increments of 0.5 W·kg-1 until exhaustion, the duration of three first steps was 5 min, and then 10 min. Oxygen uptake (VO2) and carbon dioxide (VCO2) were
measured (ParvoMedics TrueOne 2400, Sandy, UT) throughout the test and blood lactate concentration ([La-]b) (YSI 1500, Yellow Springs Instruments, Ohio) at the
end of each step. [La-]b max was considered the value at the end of last step of exercise. Fat and carbohydrate oxidation rates (FATox and CHOox) were estimated
by means of Frayn’s equations. A cutoff of 1 SD respect to the ([La-]b max) was suggested in order to classify the subjects in two groups: GO (Optimal [La-]b max)
and GS (Suboptimal maximal [La-]b max) with [La-]b max of <5.27 mM in men and <4.00 mM in women respectively as the cutoff. A Student t-test for independent
data was used to compare groups, the determination of the Pearson correlation coefficient was used to verify the existence of relationships between variables, level
of statistical significance was set at p<0.05.
ACKNOWLEDGEMENTS: The authors would like to express their gratitude to all subjects for their cooperation in this study.
INTRODUCTION: Proper glycogen storage is of great importance for athletic performance. Multiple studies show the positive correlation between glycogen storage and performance. Nevertheless, glycogen
assessment is difficult to determine due to the invasive and impractical nature of muscle biopsies. Therefore, it is difficult to identify suboptimal glycogen levels in athletes. Throughout the measurements of maximal
blood lactate levels ([La-]b max) and maximal carbohydrate oxidation rates (CHOox max) it could be possible to indirectly estimate muscle glycogen status in competitive athletes and identify suboptimal glycogen
levels. The purpose of this study was to assess indirectly muscle glycogen status through measurement of [La-]b max and CHOox max.
Figure 1. [La-]b max, CHOox max, FATox max and RER max comparisons between both groups of men. *p<0.05,
***p<0.001.
Figure 2. [La-]b max, CHOox max, FATox max and RER max comparisons between both groups of women. *p<0.05, **p<0.01.
0
1
2
3
4
5
6
7
8
9
10
[La-]b max CHOox max
[La-]bmax(mM)&CHOoxmax(g·min-1)
Women GO
GS
**
0.0
0.5
1.0
1.5
2.0
2.5
3.0
FATox max RER max
FAToxmax(g·min-1)&RERmax
Women GO
GS
*
0
1
2
3
4
5
6
7
8
9
10
[La-]b max CHOox max
[La-]bmax(mM)&CHOoxmax(g·min-1)
Men GO
GS
***
***
0.0
0.5
1.0
1.5
2.0
2.5
3.0
FATox max RER max
FAToxmax(g·min-1)&RERmax
Men GO
GS
*
***](https://image.slidesharecdn.com/vailsymposium-inigo-150811210248-lva1-app6891/85/Dr-Inigo-San-Millan-Presentation-36-320.jpg)