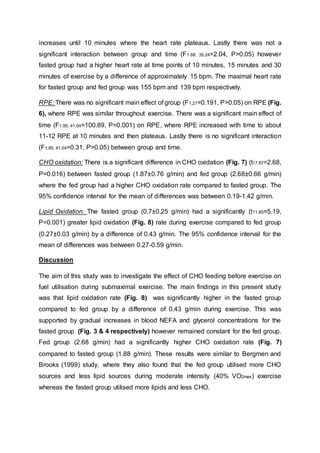
- The document discusses a study that investigated the effects of carbohydrate (CHO) feeding before and during sub-maximal exercise on metabolism. Twenty-three participants were randomly assigned to a fed group that consumed CHO or a fasted group that only drank water.
- Both groups cycled for 30 minutes at 130W. The fed group consumed CHO before and during exercise while the fasted group only drank water. Blood samples and gas measurements were taken to analyze fuel utilization.
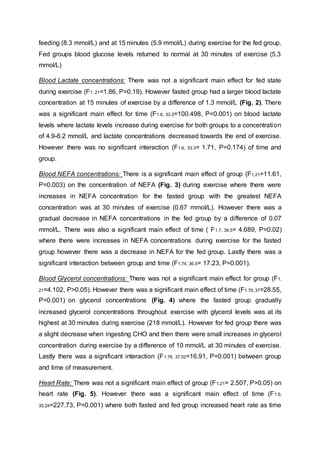
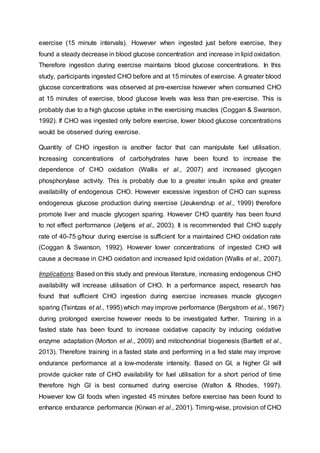
- Results showed blood glucose levels were higher in the fed group after CHO ingestion and during exercise compared to the fasted group. However, glucose levels were similar between groups by 30 minutes of exercise.