Doppler Waveform “Bootcamp”
EstherS.H. Kim, MD, MPH, RPVI
Professor of Medicine, Division of Cardiovascular Medicine
Director, Vascular Laboratory, Vanderbilt Heart and Vascular Institute
Vanderbilt University Medical Center
21 March 2022
2.
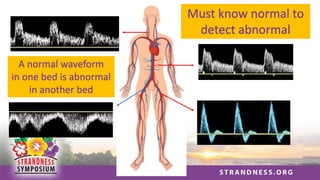
Must know normalto
detect abnormal
A normal waveform
in one bed is abnormal
in another bed
3.
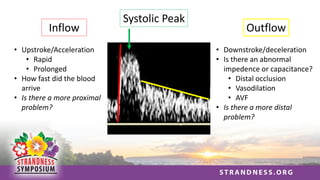
Inflow
• Upstroke/Acceleration
• Rapid
•Prolonged
• How fast did the blood
arrive
• Is there a more proximal
problem?
Outflow
• Downstroke/deceleration
• Is there an abnormal
impedence or capacitance?
• Distal occlusion
• Vasodilation
• AVF
• Is there a more distal
problem?
Systolic Peak
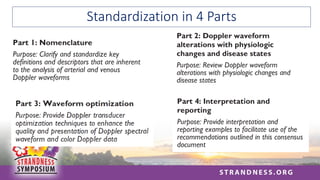
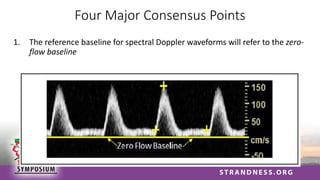
Four Major ConsensusPoints
1. The reference baseline for spectral Doppler waveforms will refer to the zero-
flow baseline
7.
Four Major ConsensusPoints
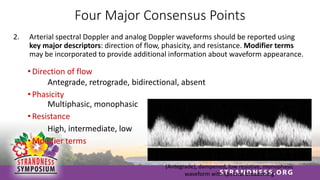
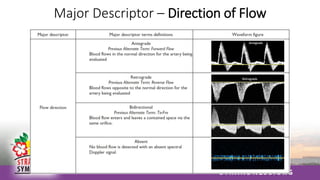
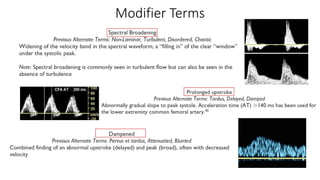
2. Arterial spectral Doppler and analog Doppler waveforms should be reported using
key major descriptors: direction of flow, phasicity, and resistance. Modifier terms
may be incorporated to provide additional information about waveform appearance.
• Direction of flow
Antegrade, retrograde, bidirectional, absent
• Phasicity
Multiphasic, monophasic
• Resistance
High, intermediate, low
• Modifier terms
(Antegrade), dampened, low resistive, monophasic
waveform with spectral broadening
Four Major ConsensusPoints
3. Optimization techniques should be used to provide quality Doppler waveforms for
accurate interpretation
14.
Four Major ConsensusPoints
4. Waveform descriptors and modifiers, velocity measurements, and image descriptors are test
findings, not interpretations. To be clinically useful to the ordering provider, test data, including
waveform findings, should be used by the interpreting physician along with exam-specific,
validated criteria to determine the final interpretation or conclusion of the vascular study
(Antegrade), low resistive, monophasic waveform
Normal or Abnormal?
❑ A – Normal
❑ B – Abnormal
❑ C – Need more information
15.
Four Major ConsensusPoints
4. Waveform descriptors and modifiers, velocity measurements, and image descriptors are test
findings, not interpretations. To be clinically useful to the ordering provider, test data, including
waveform findings, should be used by the interpreting physician along with exam-specific,
validated criteria to determine the final interpretation or conclusion of the vascular study
(Antegrade), low resistive, monophasic waveform
Normal or Abnormal?
❑ A – Normal
❑ B – Abnormal
C – Need more information
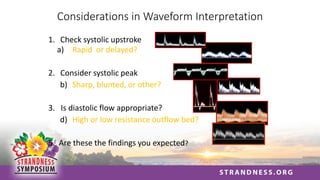
Considerations in WaveformInterpretation
1. Check systolic upstroke
a) Rapid or delayed?
2. Consider systolic peak
b) Sharp, blunted, or other?
3. Is diastolic flow appropriate?
d) High or low resistance outflow bed?
5. Are these the findings you expected?
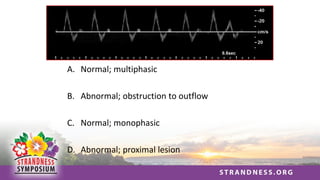
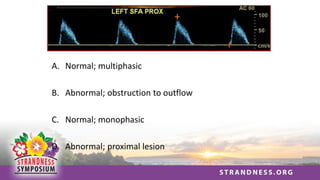
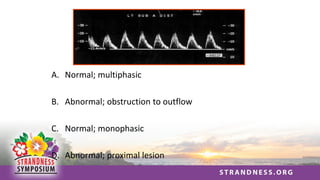
A. Normal; multiphasic
B.Abnormal; obstruction to outflow
C. Normal; monophasic
D. Abnormal; proximal lesion
20.
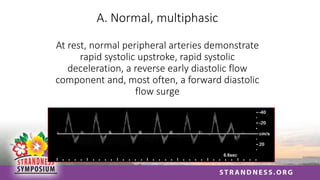
A. Normal, multiphasic
Atrest, normal peripheral arteries demonstrate
rapid systolic upstroke, rapid systolic
deceleration, a reverse early diastolic flow
component and, most often, a forward diastolic
flow surge
21.
Pattern # 2:
Restinglower limb waveforms from
an 82 y.o. with complaints of limb
pain and swelling
22.
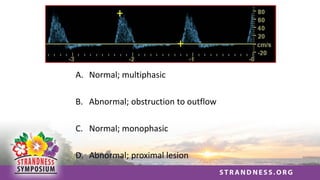
A. Normal; multiphasic
B.Abnormal; obstruction to outflow
C. Normal; monophasic
D. Abnormal; proximal lesion
23.
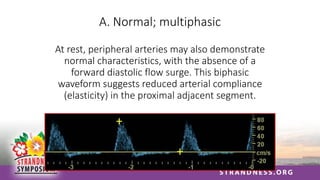
A. Normal; multiphasic
Atrest, peripheral arteries may also demonstrate
normal characteristics, with the absence of a
forward diastolic flow surge. This biphasic
waveform suggests reduced arterial compliance
(elasticity) in the proximal adjacent segment.
24.
Pattern # 3:
Restingsuperficial femoral artery
waveforms from a 78 y.o. diabetic
patient
25.
A. Normal; multiphasic
B.Abnormal; obstruction to outflow
C. Normal; monophasic
D. Abnormal; proximal lesion
26.
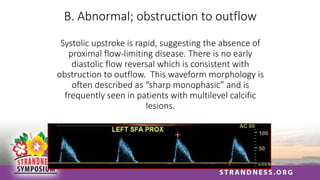
B. Abnormal; obstructionto outflow
Systolic upstroke is rapid, suggesting the absence of
proximal flow-limiting disease. There is no early
diastolic flow reversal which is consistent with
obstruction to outflow. This waveform morphology is
often described as “sharp monophasic” and is
frequently seen in patients with multilevel calcific
lesions.
27.
Pattern # 4:
Restingright common femoral artery
waveform from a patient presenting
with buttock and thigh claudication
28.
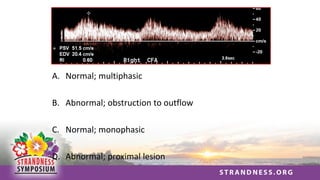
A. Normal; multiphasic
B.Abnormal; obstruction to outflow
C. Normal; monophasic
D. Abnormal; proximal lesion
29.
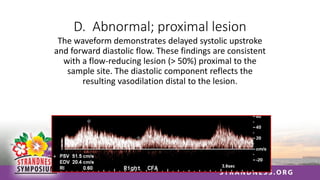
D. Abnormal; proximallesion
The waveform demonstrates delayed systolic upstroke
and forward diastolic flow. These findings are consistent
with a flow-reducing lesion (> 50%) proximal to the
sample site. The diastolic component reflects the
resulting vasodilation distal to the lesion.
30.
Pattern # 5:
Thewaveforms were obtained from the
distal subclavian artery in an arm at
rest.
31.
A. Normal; multiphasic
B.Abnormal; obstruction to outflow
C. Normal; monophasic
D. Abnormal; proximal lesion
32.
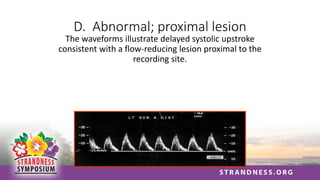
D. Abnormal; proximallesion
The waveforms illustrate delayed systolic upstroke
consistent with a flow-reducing lesion proximal to the
recording site.
33.
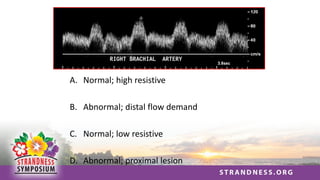
Pattern # 6:
Thewaveforms were recorded in the
brachial artery from an arm at rest
34.
A. Normal; highresistive
B. Abnormal; distal flow demand
C. Normal; low resistive
D. Abnormal; proximal lesion
35.
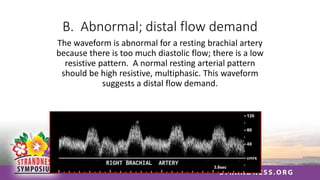
B. Abnormal; distalflow demand
The waveform is abnormal for a resting brachial artery
because there is too much diastolic flow; there is a low
resistive pattern. A normal resting arterial pattern
should be high resistive, multiphasic. This waveform
suggests a distal flow demand.
36.
Pattern # 7:
Thewaveforms were recorded in
the distal brachial artery from the
patient presented in the previous
question (Pattern # 6).
37.
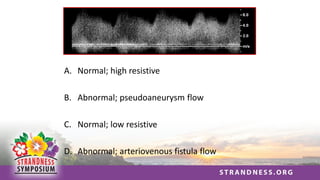
A. Normal; highresistive
B. Abnormal; pseudoaneurysm flow
C. Normal; low resistive
D. Abnormal; arteriovenous fistula flow
38.
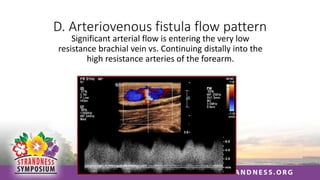
D. Arteriovenous fistulaflow pattern
Significant arterial flow is entering the very low
resistance brachial vein vs. Continuing distally into the
high resistance arteries of the forearm.
39.
Pattern # 8:
Thefollowing waveforms were
recorded from the right and left
common carotid arteries (CCAs)
40.
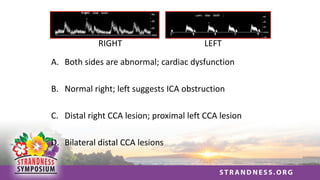
A. Both sidesare abnormal; cardiac dysfunction
B. Normal right; left suggests ICA obstruction
C. Distal right CCA lesion; proximal left CCA lesion
D. Bilateral distal CCA lesions
RIGHT LEFT
41.
B. Normal rightCCA; left ICA obstruction
Approximately 80% of the blood flow from the CCA
enters the circulation of the ICA and ophthalmic arteries.
Therefore the CCA normally has forward diastolic flow
(right side). The absence of diastolic flow (left side)
suggests critical stenosis or occlusion of the left ICA.
42.
Pattern # 9:
Thefollowing waveforms were recorded
in the internal carotid artery of a patient
with an asymptomatic bruit
43.
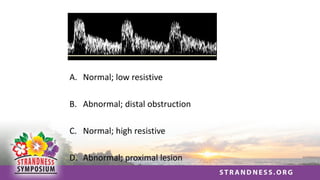
A. Normal; lowresistive
B. Abnormal; distal obstruction
C. Normal; high resistive
D. Abnormal; proximal lesion
44.
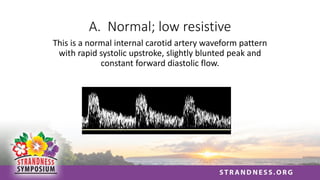
A. Normal; lowresistive
This is a normal internal carotid artery waveform pattern
with rapid systolic upstroke, slightly blunted peak and
constant forward diastolic flow.
45.
Pattern # 10:
Thefollowing waveforms were
recorded from the common carotid
arteries of a patient returning for a
follow-up exam
46.
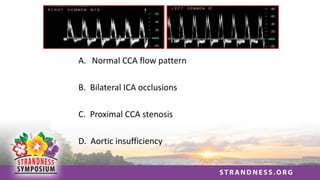
A. Normal CCAflow pattern
B. Bilateral ICA occlusions
C. Proximal CCA stenosis
D. Aortic insufficiency
47.
D. Aortic Insufficiency
Aorticinsufficiency results in
reversed flow throughout
diastole and a bisferiens
waveform (2 distinct peak
separate with the height of
the 2nd peak equal to or taller
than the height of the first).
These findings are classic for
aortic insufficiency.
Echo Findings
• s/p AVR
bioprosthetic valve
• Severe AI, 3-4+
• T/12 160 msec
48.
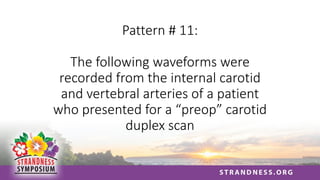
Pattern # 11:
Thefollowing waveforms were
recorded from the internal carotid
and vertebral arteries of a patient
who presented for a “preop” carotid
duplex scan
49.
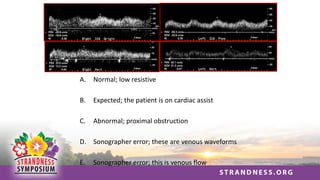
A. Normal; lowresistive
B. Expected; the patient is on cardiac assist
C. Abnormal; proximal obstruction
D. Sonographer error; these are venous waveforms
E. Sonographer error; this is venous flow
50.
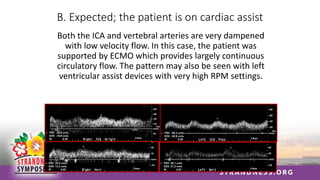
B. Expected; thepatient is on cardiac assist
Both the ICA and vertebral arteries are very dampened
with low velocity flow. In this case, the patient was
supported by ECMO which provides largely continuous
circulatory flow. The pattern may also be seen with left
ventricular assist devices with very high RPM settings.
51.
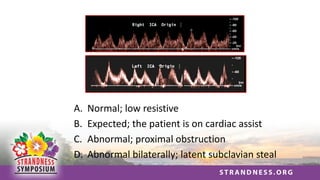
Pattern # 12:
Thefollowing waveforms were also
recorded from the internal carotid
arteries of a patient who presented
for a “preop” carotid duplex scan
52.
A. Normal; lowresistive
B. Expected; the patient is on cardiac assist
C. Abnormal; proximal obstruction
D. Abnormal bilaterally; latent subclavian steal
53.
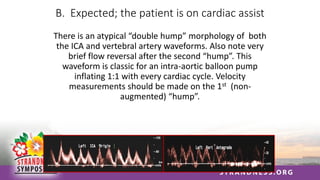
B. Expected; thepatient is on cardiac assist
There is an atypical “double hump” morphology of both
the ICA and vertebral artery waveforms. Also note very
brief flow reversal after the second “hump”. This
waveform is classic for an intra-aortic balloon pump
inflating 1:1 with every cardiac cycle. Velocity
measurements should be made on the 1st (non-
augmented) “hump”.
54.
Pattern # 13:
TheDoppler spectral waveforms were
recorded from the vertebral artery of a
patient with non-focal symptoms.
55.
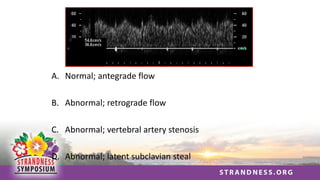
A. Normal; antegradeflow
B. Abnormal; retrograde flow
C. Abnormal; vertebral artery stenosis
D. Abnormal; latent subclavian steal
56.
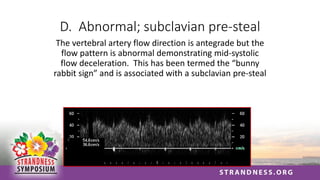
D. Abnormal; subclavianpre-steal
The vertebral artery flow direction is antegrade but the
flow pattern is abnormal demonstrating mid-systolic
flow deceleration. This has been termed the “bunny
rabbit sign” and is associated with a subclavian pre-steal
57.
Rohren, E. M.et al. Am. J. Roentgenol. 2003;181:1695-1704
58.
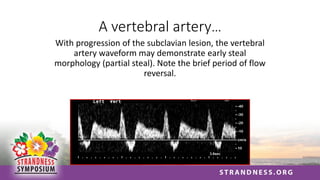
A vertebral artery…
Withprogression of the subclavian lesion, the vertebral
artery waveform may demonstrate early steal
morphology (partial steal). Note the brief period of flow
reversal.
59.
Pattern # 14:
Thefollowing vertebral artery color
flow image and waveform display
were recorded from a patient with
non-focal symptoms.
60.
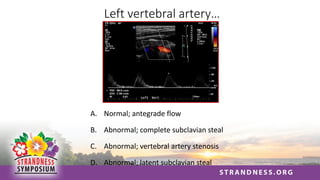
Left vertebral artery…
A.Normal; antegrade flow
B. Abnormal; complete subclavian steal
C. Abnormal; vertebral artery stenosis
D. Abnormal; latent subclavian steal
61.
B. Complete subclaviansteal
Flow throughout the
cardiac cycle is
directed toward the
arm (shown above
the zero baseline)
Retrograde flow is
also apparent in the
color Doppler image.
62.
Pattern # 15:
Thefollowing waveforms were
recorded in the internal carotid
arteries of a patient in the ICU
63.
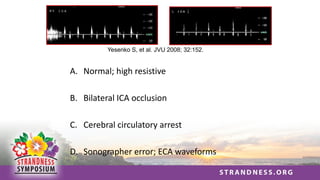
Yesenko S, etal. JVU 2008; 32:152.
A. Normal; high resistive
B. Bilateral ICA occlusion
C. Cerebral circulatory arrest
D. Sonographer error; ECA waveforms
64.
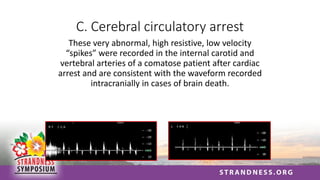
C. Cerebral circulatoryarrest
These very abnormal, high resistive, low velocity
“spikes” were recorded in the internal carotid and
vertebral arteries of a comatose patient after cardiac
arrest and are consistent with the waveform recorded
intracranially in cases of brain death.
65.
Pattern # 16:
Thefollowing waveform pattern was
recorded in a lower extremity vein of a
patient with a painful, swollen limb.
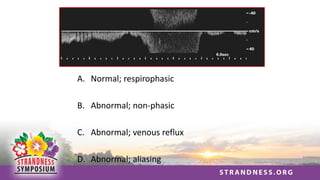
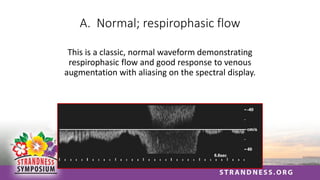
A. Normal; respirophasicflow
This is a classic, normal waveform demonstrating
respirophasic flow and good response to venous
augmentation with aliasing on the spectral display.
68.
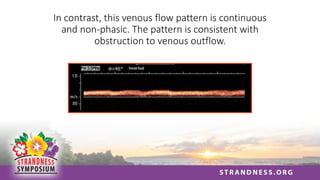
In contrast, thisvenous flow pattern is continuous
and non-phasic. The pattern is consistent with
obstruction to venous outflow.
69.
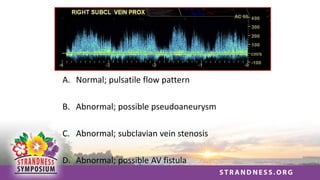
Pattern # 17:
Thefollowing waveforms were
recorded in a right subclavian vein
of a patient who experienced upper
extremity and neck trauma.
70.
A. Normal; pulsatileflow pattern
B. Abnormal; possible pseudoaneurysm
C. Abnormal; subclavian vein stenosis
D. Abnormal; possible AV fistula
71.
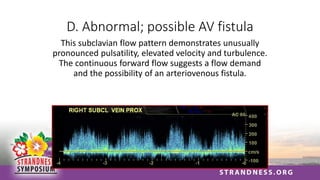
D. Abnormal; possibleAV fistula
This subclavian flow pattern demonstrates unusually
pronounced pulsatility, elevated velocity and turbulence.
The continuous forward flow suggests a flow demand
and the possibility of an arteriovenous fistula.
72.
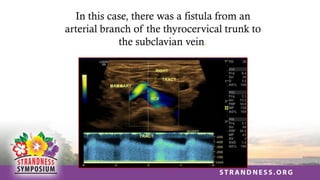
In this case,there was a fistula from an
arterial branch of the thyrocervical trunk to
the subclavian vein.
73.
Pattern # 18:
Thefollowing waveforms were
recorded during an abdominal
duplex exam in a patient who had
undergone abdominal aortic surgery
74.
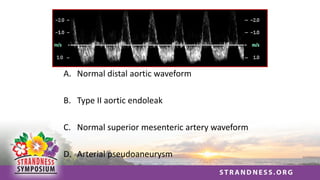
A. Normal distalaortic waveform
B. Type II aortic endoleak
C. Normal superior mesenteric artery waveform
D. Arterial pseudoaneurysm
75.
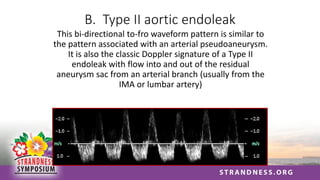
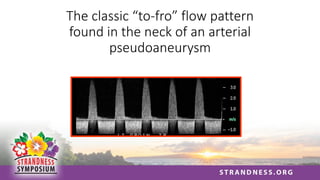
B. Type IIaortic endoleak
This bi-directional to-fro waveform pattern is similar to
the pattern associated with an arterial pseudoaneurysm.
It is also the classic Doppler signature of a Type II
endoleak with flow into and out of the residual
aneurysm sac from an arterial branch (usually from the
IMA or lumbar artery)
76.
The classic “to-fro”flow pattern
found in the neck of an arterial
pseudoaneurysm
77.
Pattern # 19
Thesewaveforms were recorded in
the carotid arteries of a patient
who was pre-operative for a cardiac
surgery.
C. Hypertrophic Obstructive
Cardiomyopathy
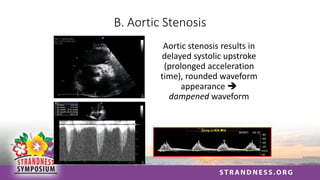
Hypertrophicobstructive
cardiomyopathy results in
Doppler waveforms with
exaggerated, rapid upstroke
followed by rapid decent.
They have a classic systolic
“spike and dome”
appearance.
• Severe anterior leaflet SAM with
septal contact at rest
• LVOT gradient 90 mmHg
80.
Pattern # 20
54year old man with SOB and
edema; pre-operative carotid
ultrasound prior to cardiac surgery
81.
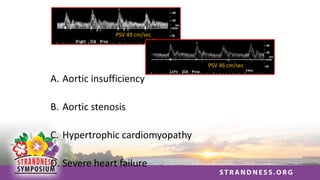
PSV 49 cm/sec
PSV46 cm/sec
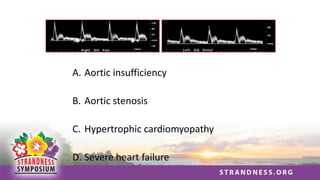
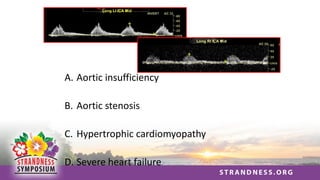
A. Aortic insufficiency
B. Aortic stenosis
C. Hypertrophic cardiomyopathy
D. Severe heart failure
82.
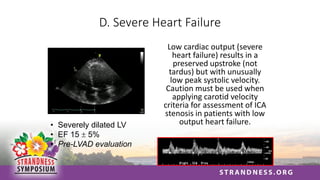
D. Severe HeartFailure
Low cardiac output (severe
heart failure) results in a
preserved upstroke (not
tardus) but with unusually
low peak systolic velocity.
Caution must be used when
applying carotid velocity
criteria for assessment of ICA
stenosis in patients with low
output heart failure.
• Severely dilated LV
• EF 15 5%
• Pre-LVAD evaluation
83.
Pattern # 21
Thesewaveforms are from the
internal carotid arteries of an 83
year old man referred for ultrasound
after presenting with syncope