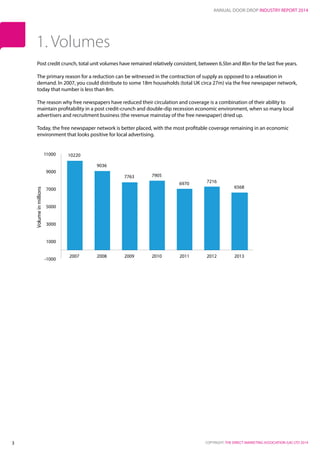
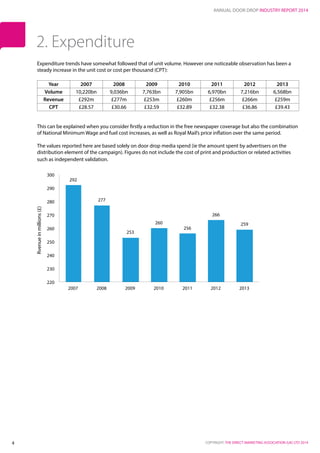
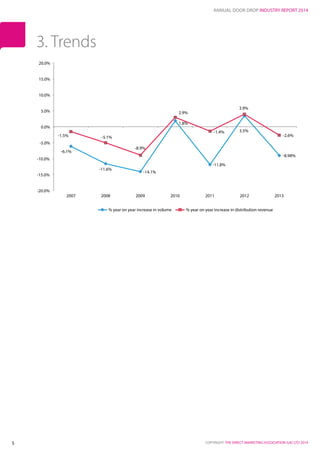
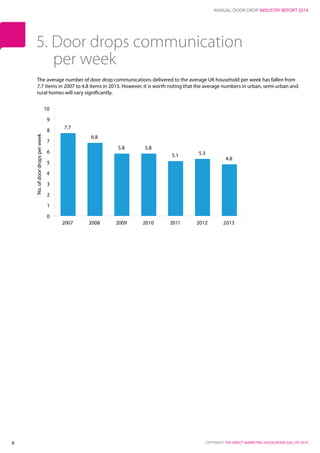
Annual door drop
industry report
2014
ANNUAL DOOR DROP INDUSTRY REPORT 2014
COPYRIGHT: THE DIRECT MARKETING ASSOCIATION (UK) LTD 20141
Contents
Contents. . . . . . . . . . . . . . . . . . . . . . . . . . . . . . . . . . . . . . . . . . . . . . . . . . . . . . . . . . . . . . . . . . . . . . . . . . . . . . . . . . . . . . . . . . . . . . . . . . . . . . . . . . . . . . . . . . . . . . . . . . . . . . . . . . . . . . . . . . . . . . . . . 1
Executive summary. . . . . . . . . . . . . . . . . . . . . . . . . . . . . . . . . . . . . . . . . . . . . . . . . . . . . . . . . . . . . . . . . . . . . . . . . . . . . . . . . . . . . . . . . . . . . . . . . . . . . . . . . . . . . . . . . . . . . . . . . . . . . . . . . . 2
1. Volumes.. . . . . . . . . . . . . . . . . . . . . . . . . . . . . . . . . . . . . . . . . . . . . . . . . . . . . . . . . . . . . . . . . . . . . . . . . . . . . . . . . . . . . . . . . . . . . . . . . . . . . . . . . . . . . . . . . . . . . . . . . . . . . . . . . . . . . . . . . . . . . . 3
2. Expenditure. . . . . . . . . . . . . . . . . . . . . . . . . . . . . . . . . . . . . . . . . . . . . . . . . . . . . . . . . . . . . . . . . . . . . . . . . . . . . . . . . . . . . . . . . . . . . . . . . . . . . . . . . . . . . . . . . . . . . . . . . . . . . . . . . . . . . . . . . 4
3. Trends. . . . . . . . . . . . . . . . . . . . . . . . . . . . . . . . . . . . . . . . . . . . . . . . . . . . . . . . . . . . . . . . . . . . . . . . . . . . . . . . . . . . . . . . . . . . . . . . . . . . . . . . . . . . . . . . . . . . . . . . . . . . . . . . . . . . . . . . . . . . . . . . . 5
4. Door drop and total UK advertising expenditure growth. . . . . . . . . . . . . . . . . . . . . . . . . . . . . . . . . . . . . . . . . . . . . . . . . . . . . . . . . . . . . . . . . . . . . . . . . . . . . 6
5. Door drops communication per week.. . . . . . . . . . . . . . . . . . . . . . . . . . . . . . . . . . . . . . . . . . . . . . . . . . . . . . . . . . . . . . . . . . . . . . . . . . . . . . . . . . . . . . . . . . . . . . . . . . . . . . 8
6. Door drop promotional material facts and figures 2007 to 2012. . . . . . . . . . . . . . . . . . . . . . . . . . . . . . . . . . . . . . . . . . . . . . . . . . . . . . . . . . . . . . . . . . . 9
6.1 Average item weight.. . . . . . . . . . . . . . . . . . . . . . . . . . . . . . . . . . . . . . . . . . . . . . . . . . . . . . . . . . . . . . . . . . . . . . . . . . . . . . . . . . . . . . . . . . . . . . . . . . . . . . . . . . . . . . . . . . . . . . . . . . . 9
6.2 Total door drop material. . . . . . . . . . . . . . . . . . . . . . . . . . . . . . . . . . . . . . . . . . . . . . . . . . . . . . . . . . . . . . . . . . . . . . . . . . . . . . . . . . . . . . . . . . . . . . . . . . . . . . . . . . . . . . . . . . . . . . . 10
Methodology.. . . . . . . . . . . . . . . . . . . . . . . . . . . . . . . . . . . . . . . . . . . . . . . . . . . . . . . . . . . . . . . . . . . . . . . . . . . . . . . . . . . . . . . . . . . . . . . . . . . . . . . . . . . . . . . . . . . . . . . . . . . . . . . . . . . . . . . . . . 11
Appendix. . . . . . . . . . . . . . . . . . . . . . . . . . . . . . . . . . . . . . . . . . . . . . . . . . . . . . . . . . . . . . . . . . . . . . . . . . . . . . . . . . . . . . . . . . . . . . . . . . . . . . . . . . . . . . . . . . . . . . . . . . . . . . . . . . . . . . . . . . . . . . . . 12
About DMA . . . . . . . . . . . . . . . . . . . . . . . . . . . . . . . . . . . . . . . . . . . . . . . . . . . . . . . . . . . . . . . . . . . . . . . . . . . . . . . . . . . . . . . . . . . . . . . . . . . . . . . . . . . . . . . . . . . . . . . . . . . . . . . . . . . . . . . . . . . . 13
Copyright and disclaimer.. . . . . . . . . . . . . . . . . . . . . . . . . . . . . . . . . . . . . . . . . . . . . . . . . . . . . . . . . . . . . . . . . . . . . . . . . . . . . . . . . . . . . . . . . . . . . . . . . . . . . . . . . . . . . . . . . . . . . . . . . . 14
ANNUAL DOOR DROP INDUSTRY REPORT 2014
COPYRIGHT: THE DIRECT MARKETING ASSOCIATION (UK) LTD 20142
Welcome to the 20th Annual door drop report from the DMA Door Drop Board Committee, which each year looks at
advertising volumes and expenditure as it relates to the UK door drop industry.
This report measures and identifies the size of the UK market in terms of volume and spend from advertisers who
directly, or through an agency, fund the distribution of their pre‐printed communications material (ie advertiser
spend on door drops).
This report compares figures from 2013 to previous years. Year on year, 2013 saw a reduction in unit volume of some
8.98%, from 7.216bn to 6.568bn. This reduction, however, followed an increase of 3.53% the previous year, from
6.97bn to 7.216bn. Indeed the annual reported unit volume has moved up and down for some five years, with the
general trend being a reduction.
This can be explained by a number of factors:
•	 The economic climate beginning with the credit crunch in 2007
•	 The subsequent double dip and deepest recession(s) post the 1930s, resulting in a number of retail
businesses closing stores
•	 During a challenging economic climate, a closure of many free newspapers, one of the three available routes
to market for unaddressed, door-drop distribution
•	 In similar circumstances, a contraction of advertising investment in traditional advertising vehicles in favour
of digital channels such as search
•	 Finally, continued improvement and refinement to planning techniques encouraging better and less
wasteful targeting/distribution
Executive summary
ANNUAL DOOR DROP INDUSTRY REPORT 2014
COPYRIGHT: THE DIRECT MARKETING ASSOCIATION (UK) LTD 20143
Post credit crunch, total unit volumes have remained relatively consistent, between 6.5bn and 8bn for the last five years.
The primary reason for a reduction can be witnessed in the contraction of supply as opposed to a relaxation in
demand. In 2007, you could distribute to some 18m households (total UK circa 27m) via the free newspaper network,
today that number is less than 8m.
The reason why free newspapers have reduced their circulation and coverage is a combination of their ability to
maintain profitability in a post credit-crunch and double-dip recession economic environment, when so many local
advertisers and recruitment business (the revenue mainstay of the free newspaper) dried up.
Today, the free newspaper network is better placed, with the most profitable coverage remaining in an economic
environment that looks positive for local advertising.
1. Volumes
10220
9036
7763 7905
6970 7216
6568
-1000
1000
3000
5000
7000
9000
11000
2007 2008 2009 2010 2011 2012 2013
Volumeinmillions
ANNUAL DOOR DROP INDUSTRY REPORT 2014
COPYRIGHT: THE DIRECT MARKETING ASSOCIATION (UK) LTD 20144
Expenditure trends have somewhat followed that of unit volume. However one noticeable observation has been a
steady increase in the unit cost or cost per thousand (CPT):
Year 2007 2008 2009 2010 2011 2012 2013
Volume 10,220bn 9,036bn 7,763bn 7,905bn 6,970bn 7,216bn 6,568bn
Revenue £292m £277m £253m £260m £256m £266m £259m
CPT £28.57 £30.66 £32.59 £32.89 £32.38 £36.86 £39.43
This can be explained when you consider firstly a reduction in the free newspaper coverage but also the combination
of National Minimum Wage and fuel cost increases, as well as Royal Mail’s price inflation over the same period.
The values reported here are based solely on door drop media spend (ie the amount spent by advertisers on the
distribution element of the campaign). Figures do not include the cost of print and production or related activities
such as independent validation.
2. Expenditure
292
277
253
260
256
266
259
220
230
240
250
260
270
280
290
300
2007 2008 2009 2010 2011 2012 2013
Rvenueinmillions(£)
ANNUAL DOOR DROP INDUSTRY REPORT 2014
COPYRIGHT: THE DIRECT MARKETING ASSOCIATION (UK) LTD 20145
 
3. Trends
-6.1%
-11.6%
-14.1%
1.8%
-11.8%
3.5%
-8.98%
-1.5% -5.1%
-8.9%
2.9%
-1.4%
3.9%
-2.6%
-20.0%
-15.0%
-10.0%
-5.0%
0.0%
5.0%
10.0%
15.0%
20.0%
2007 2008 2009 2010 2011 2012 2013
% year on year increase in volume % year on year increase in distribution revenue
ANNUAL DOOR DROP INDUSTRY REPORT 2014
COPYRIGHT: THE DIRECT MARKETING ASSOCIATION (UK) LTD 20146
The door drop industry outperformed total UK advertising expenditure during the late 1990s and this reflected the
increasing maturity of the medium and its growing popularity as both a strategic and a tactical communications tool.
Its ability to work with other media and almost uniquely offer both precision and penetration were also important
contributors to growth against the background of increasing media fragmentation.
Improved use of client data and targeting techniques to enhance relevance also contributed to a below average
growth rate over that period.
According to research conducted by the Advertising Association, door drop expenditure has remained relatively flat
for the last four years:
4. Door drop and total UK advertising
expenditure growth
Out of home Press Cinema Direct mail Door drop
5%
-4%
-17%
13%
1%
10%
2%
-2%
-12%
0%
3%
-9%
-6%
8%
1%
-22%
15%
-8%
26%
-14%
-7% -6%
-24%
-34%
10%
1%
23%
0%
-2%
-5%
-9%
3%
-2%
4%
-3%
-30%
-20%
-10%
0%
10%
20%
30%
2007 2008 2009 2010 2011 2012 2013
COPYRIGHT: THE DIRECT MARKETING ASSOCIATION (UK) LTD 2014
ANNUAL DOOR DROP INDUSTRY REPORT 2014
7
Internet Door drop
3%
-5%
-1%
7%
9%
0%
4%4%
-9%
-11%
3%
27%
4%
-3%
40%
19%
5%
17%
4%
13%
17%
-2%
-5%
-9%
3%
-2%
4%
-3%
-30%
-20%
-10%
0%
10%
20%
30%
40%
50%
2007 2008 2009 2010 2011 2012 2013
TV Radio
ANNUAL DOOR DROP INDUSTRY REPORT 2014
COPYRIGHT: THE DIRECT MARKETING ASSOCIATION (UK) LTD 20148
The average number of door drop communications delivered to the average UK household per week has fallen from
7.7 items in 2007 to 4.8 items in 2013. However, it is worth noting that the average numbers in urban, semi-urban and
rural homes will vary significantly.
 
5. Door drops communication
per week
7.7
6.8
5.8 5.8
5.1 5.3
4.8
0
1
2
3
4
5
6
7
8
9
10
2007 2008 2009 2010 2011 2012 2013
No.ofdoordropsperweek
ANNUAL DOOR DROP INDUSTRY REPORT 2014
COPYRIGHT: THE DIRECT MARKETING ASSOCIATION (UK) LTD 20149
The DMA Door Drop Board Committee monitors the total amount of promotional material delivered annually via
door drop campaigns. The scope of the industry survey was expanded in 2009 to include the size and weight of door
drop items. This revealed a reduction in the size and pagination of door drop material, which has also reduced the
overall weight. This exercise has been repeated in 2013 and the results compared with figures from 2007.
The DMA Door Drop Board Committee has identified the following key figures for 2007 and 2013.
6.1 Average item weight
The average weight of a door drop communication item in 2007 was 18 grams but it has reduced by
17.33% over the last five years and stands at 14.88 grams in 2013.
6. Door drop promotional material
facts and figures 2007 to 2012
18
16.5
14.69
14.13
16.24
14.81 14.88
0
2
4
6
8
10
12
14
16
18
20
2007 2008 2009 2010 2011 2012 2013
Weightingrams
COPYRIGHT: THE DIRECT MARKETING ASSOCIATION (UK) LTD 2014
ANNUAL DOOR DROP INDUSTRY REPORT 2014
10
6.2 Total door drop material
The compound position taking into account unit volume and average size/weight means that the total volume of door
drop communication material being distributed has fallen from 184,001 tonnes in 2007 to 97,730 tonnes in 2013 (a drop
of 46.89%) which, when combined with door drop’s green credentials, is a positive news story for the environment.
184001
149088
114024 111698 113189
106872
97730
0
20000
40000
60000
80000
100000
120000
140000
160000
180000
200000
2007 2008 2009 2010 2011 2012 2013
Weightintonnes
ANNUAL DOOR DROP INDUSTRY REPORT 2014
COPYRIGHT: THE DIRECT MARKETING ASSOCIATION (UK) LTD 201411
For data published from 2005, the survey was redefined seeking to measure and establish the size of the UK market in
terms of volume and spend from advertisers who directly, or through an agency, fund the distribution of their
pre‐printed communications material (ie advertiser spend on door drops).
This includes revenue and volumes for pre‐printed communications where the advertiser has directly or indirectly
(eg via an agency) commissioned and funded the door to door delivery of their prepared (ie pre‐printed or produced)
communications material which has then been distributed on a commercial basis. This includes leaflets, catalogues,
newsletters and product samples etcetera for commercial organisations, local authorities, charities, central
government as well as locally sourced directories. The survey specifically excludes volumes and distribution
expenditure for:
•	 Local free weekly newspaper
•	 Items inserted mechanically into paid or free publications
•	 National directories, where these are effectively publications with advertising space sold by the media
owner (examples - Yellow Pages, BT Phonebooks, Thomson Directories)
The above three‘excluded’categories measure their own advertising revenue separately and have control over their
own recycling and waste control arrangements, liaising directly with Defra.
Primary research was used to collect the information using a spread sheet and analysed in-house by the DMA’s
research department. The commentary is contributed by the Membership, Legal and Administration Committee of
the Door Drop Board Committee and the DMA’s communications team.
The sample covers all the major door drop companies operating in the UK. This information was collected between
January and April 2014 and the data corresponds to January to December 2013. All the information collected is
confidential and only aggregates are published in this report.
Additional information was collected via secondary research from the Office for National Statistics and
the Advertising Association.
Methodology
ANNUAL DOOR DROP INDUSTRY REPORT 2014
COPYRIGHT: THE DIRECT MARKETING ASSOCIATION (UK) LTD 201412
Sources and helpful links
Door Drop Promotional Material Weights: DMA Door Drop Council Item Weight Survey 2010
Recycling Levels: Royal Mail and the DMA Direct Marketing Material Waste Prevention Report 2009
http://www.dma.org.uk/toolkit/direct-marketing-material-waste-prevention
Other Advertising Expenditure: Advertising Association
http://expenditurereport.warc.com/FreeTopLineData.aspx
GB Household Figures: Estimates based on data from the Office for National Statistics
http://www.ons.gov.uk/ons/rel/family-demography/families-and-households/2013/stb-families.html
Appendix
ANNUAL DOOR DROP INDUSTRY REPORT 2014
COPYRIGHT: THE DIRECT MARKETING ASSOCIATION (UK) LTD 201413
The DMA is Europe’s largest professional body representing the direct marketing industry. With a large in-house
team of specialists offering everything from free legal advice and government lobbying on direct marketing issues
to research papers and best practice, it is always at the forefront of developments in the industry.
The DMA protects the one-to-one to millions industry and consumers. It promotes the highest standards through
self-regulation and lobbies against over-regulation. The DM Code of Practice sits at the heart of everything we do – and
all members are required to adhere to it. It sets out the industry’s standards of ethical conduct and best practice.
Our 15 DMA councils and committees cover the whole marketing spectrum – from the digital world of social media
and mobile marketing to offline channels, such as door drops and inserts. The councils are made up of DMA members
and regularly produce best practice and how to guides for our members.
We also have a packed calendar of conferences, workshops and discussions on the latest topics and best practice,
and 80% of them are free for members and their staff.
As the industry moves on so do we, which is why we’ve launched a number of new services for our members – a VAT
helpline, a Social Media Helpdesk and an IP Protection Service.
Visit www.dma.org.uk regularly to keep up to date with all our services.
About DMA
ANNUAL DOOR DROP INDUSTRY REPORT 2014
COPYRIGHT: THE DIRECT MARKETING ASSOCIATION (UK) LTD 201414
The Annual door drop industry report 2014 is published by The Direct Marketing Association (UK) Ltd Copyright
© Direct Marketing Association. All rights reserved. No part of this publication may be reproduced, copied or
transmitted in any form or by any means, or stored in a retrieval system of any nature, without the prior permission of
the DMA (UK) Ltd except as permitted by the provisions of the Copyright, Designs and Patents Act 1988 and related
legislation. Application for permission to reproduce all or part of the Copyright material shall be made to the DMA
(UK) Ltd, DMA House, 70 Margaret Street, London, W1W 8SS.
Although the greatest care has been taken in the preparation and compilation of the Annual door drop industry
report 2014, no liability or responsibility of any kind (to extent permitted by law), including responsibility for
negligence is accepted by the DMA, its servants or agents. All information gathered is believed correct at July 2014.
All corrections should be sent to the DMA for future editions.
Copyright and disclaimer

Dma 2013 Statistics

  • 1.
  • 2.
    ANNUAL DOOR DROPINDUSTRY REPORT 2014 COPYRIGHT: THE DIRECT MARKETING ASSOCIATION (UK) LTD 20141 Contents Contents. . . . . . . . . . . . . . . . . . . . . . . . . . . . . . . . . . . . . . . . . . . . . . . . . . . . . . . . . . . . . . . . . . . . . . . . . . . . . . . . . . . . . . . . . . . . . . . . . . . . . . . . . . . . . . . . . . . . . . . . . . . . . . . . . . . . . . . . . . . . . . . . . 1 Executive summary. . . . . . . . . . . . . . . . . . . . . . . . . . . . . . . . . . . . . . . . . . . . . . . . . . . . . . . . . . . . . . . . . . . . . . . . . . . . . . . . . . . . . . . . . . . . . . . . . . . . . . . . . . . . . . . . . . . . . . . . . . . . . . . . . . 2 1. Volumes.. . . . . . . . . . . . . . . . . . . . . . . . . . . . . . . . . . . . . . . . . . . . . . . . . . . . . . . . . . . . . . . . . . . . . . . . . . . . . . . . . . . . . . . . . . . . . . . . . . . . . . . . . . . . . . . . . . . . . . . . . . . . . . . . . . . . . . . . . . . . . . 3 2. Expenditure. . . . . . . . . . . . . . . . . . . . . . . . . . . . . . . . . . . . . . . . . . . . . . . . . . . . . . . . . . . . . . . . . . . . . . . . . . . . . . . . . . . . . . . . . . . . . . . . . . . . . . . . . . . . . . . . . . . . . . . . . . . . . . . . . . . . . . . . . 4 3. Trends. . . . . . . . . . . . . . . . . . . . . . . . . . . . . . . . . . . . . . . . . . . . . . . . . . . . . . . . . . . . . . . . . . . . . . . . . . . . . . . . . . . . . . . . . . . . . . . . . . . . . . . . . . . . . . . . . . . . . . . . . . . . . . . . . . . . . . . . . . . . . . . . . 5 4. Door drop and total UK advertising expenditure growth. . . . . . . . . . . . . . . . . . . . . . . . . . . . . . . . . . . . . . . . . . . . . . . . . . . . . . . . . . . . . . . . . . . . . . . . . . . . . 6 5. Door drops communication per week.. . . . . . . . . . . . . . . . . . . . . . . . . . . . . . . . . . . . . . . . . . . . . . . . . . . . . . . . . . . . . . . . . . . . . . . . . . . . . . . . . . . . . . . . . . . . . . . . . . . . . . 8 6. Door drop promotional material facts and figures 2007 to 2012. . . . . . . . . . . . . . . . . . . . . . . . . . . . . . . . . . . . . . . . . . . . . . . . . . . . . . . . . . . . . . . . . . . 9 6.1 Average item weight.. . . . . . . . . . . . . . . . . . . . . . . . . . . . . . . . . . . . . . . . . . . . . . . . . . . . . . . . . . . . . . . . . . . . . . . . . . . . . . . . . . . . . . . . . . . . . . . . . . . . . . . . . . . . . . . . . . . . . . . . . . . 9 6.2 Total door drop material. . . . . . . . . . . . . . . . . . . . . . . . . . . . . . . . . . . . . . . . . . . . . . . . . . . . . . . . . . . . . . . . . . . . . . . . . . . . . . . . . . . . . . . . . . . . . . . . . . . . . . . . . . . . . . . . . . . . . . . 10 Methodology.. . . . . . . . . . . . . . . . . . . . . . . . . . . . . . . . . . . . . . . . . . . . . . . . . . . . . . . . . . . . . . . . . . . . . . . . . . . . . . . . . . . . . . . . . . . . . . . . . . . . . . . . . . . . . . . . . . . . . . . . . . . . . . . . . . . . . . . . . . 11 Appendix. . . . . . . . . . . . . . . . . . . . . . . . . . . . . . . . . . . . . . . . . . . . . . . . . . . . . . . . . . . . . . . . . . . . . . . . . . . . . . . . . . . . . . . . . . . . . . . . . . . . . . . . . . . . . . . . . . . . . . . . . . . . . . . . . . . . . . . . . . . . . . . . 12 About DMA . . . . . . . . . . . . . . . . . . . . . . . . . . . . . . . . . . . . . . . . . . . . . . . . . . . . . . . . . . . . . . . . . . . . . . . . . . . . . . . . . . . . . . . . . . . . . . . . . . . . . . . . . . . . . . . . . . . . . . . . . . . . . . . . . . . . . . . . . . . . 13 Copyright and disclaimer.. . . . . . . . . . . . . . . . . . . . . . . . . . . . . . . . . . . . . . . . . . . . . . . . . . . . . . . . . . . . . . . . . . . . . . . . . . . . . . . . . . . . . . . . . . . . . . . . . . . . . . . . . . . . . . . . . . . . . . . . . . 14
  • 3.
    ANNUAL DOOR DROPINDUSTRY REPORT 2014 COPYRIGHT: THE DIRECT MARKETING ASSOCIATION (UK) LTD 20142 Welcome to the 20th Annual door drop report from the DMA Door Drop Board Committee, which each year looks at advertising volumes and expenditure as it relates to the UK door drop industry. This report measures and identifies the size of the UK market in terms of volume and spend from advertisers who directly, or through an agency, fund the distribution of their pre‐printed communications material (ie advertiser spend on door drops). This report compares figures from 2013 to previous years. Year on year, 2013 saw a reduction in unit volume of some 8.98%, from 7.216bn to 6.568bn. This reduction, however, followed an increase of 3.53% the previous year, from 6.97bn to 7.216bn. Indeed the annual reported unit volume has moved up and down for some five years, with the general trend being a reduction. This can be explained by a number of factors: • The economic climate beginning with the credit crunch in 2007 • The subsequent double dip and deepest recession(s) post the 1930s, resulting in a number of retail businesses closing stores • During a challenging economic climate, a closure of many free newspapers, one of the three available routes to market for unaddressed, door-drop distribution • In similar circumstances, a contraction of advertising investment in traditional advertising vehicles in favour of digital channels such as search • Finally, continued improvement and refinement to planning techniques encouraging better and less wasteful targeting/distribution Executive summary
  • 4.
    ANNUAL DOOR DROPINDUSTRY REPORT 2014 COPYRIGHT: THE DIRECT MARKETING ASSOCIATION (UK) LTD 20143 Post credit crunch, total unit volumes have remained relatively consistent, between 6.5bn and 8bn for the last five years. The primary reason for a reduction can be witnessed in the contraction of supply as opposed to a relaxation in demand. In 2007, you could distribute to some 18m households (total UK circa 27m) via the free newspaper network, today that number is less than 8m. The reason why free newspapers have reduced their circulation and coverage is a combination of their ability to maintain profitability in a post credit-crunch and double-dip recession economic environment, when so many local advertisers and recruitment business (the revenue mainstay of the free newspaper) dried up. Today, the free newspaper network is better placed, with the most profitable coverage remaining in an economic environment that looks positive for local advertising. 1. Volumes 10220 9036 7763 7905 6970 7216 6568 -1000 1000 3000 5000 7000 9000 11000 2007 2008 2009 2010 2011 2012 2013 Volumeinmillions
  • 5.
    ANNUAL DOOR DROPINDUSTRY REPORT 2014 COPYRIGHT: THE DIRECT MARKETING ASSOCIATION (UK) LTD 20144 Expenditure trends have somewhat followed that of unit volume. However one noticeable observation has been a steady increase in the unit cost or cost per thousand (CPT): Year 2007 2008 2009 2010 2011 2012 2013 Volume 10,220bn 9,036bn 7,763bn 7,905bn 6,970bn 7,216bn 6,568bn Revenue £292m £277m £253m £260m £256m £266m £259m CPT £28.57 £30.66 £32.59 £32.89 £32.38 £36.86 £39.43 This can be explained when you consider firstly a reduction in the free newspaper coverage but also the combination of National Minimum Wage and fuel cost increases, as well as Royal Mail’s price inflation over the same period. The values reported here are based solely on door drop media spend (ie the amount spent by advertisers on the distribution element of the campaign). Figures do not include the cost of print and production or related activities such as independent validation. 2. Expenditure 292 277 253 260 256 266 259 220 230 240 250 260 270 280 290 300 2007 2008 2009 2010 2011 2012 2013 Rvenueinmillions(£)
  • 6.
    ANNUAL DOOR DROPINDUSTRY REPORT 2014 COPYRIGHT: THE DIRECT MARKETING ASSOCIATION (UK) LTD 20145   3. Trends -6.1% -11.6% -14.1% 1.8% -11.8% 3.5% -8.98% -1.5% -5.1% -8.9% 2.9% -1.4% 3.9% -2.6% -20.0% -15.0% -10.0% -5.0% 0.0% 5.0% 10.0% 15.0% 20.0% 2007 2008 2009 2010 2011 2012 2013 % year on year increase in volume % year on year increase in distribution revenue
  • 7.
    ANNUAL DOOR DROPINDUSTRY REPORT 2014 COPYRIGHT: THE DIRECT MARKETING ASSOCIATION (UK) LTD 20146 The door drop industry outperformed total UK advertising expenditure during the late 1990s and this reflected the increasing maturity of the medium and its growing popularity as both a strategic and a tactical communications tool. Its ability to work with other media and almost uniquely offer both precision and penetration were also important contributors to growth against the background of increasing media fragmentation. Improved use of client data and targeting techniques to enhance relevance also contributed to a below average growth rate over that period. According to research conducted by the Advertising Association, door drop expenditure has remained relatively flat for the last four years: 4. Door drop and total UK advertising expenditure growth Out of home Press Cinema Direct mail Door drop 5% -4% -17% 13% 1% 10% 2% -2% -12% 0% 3% -9% -6% 8% 1% -22% 15% -8% 26% -14% -7% -6% -24% -34% 10% 1% 23% 0% -2% -5% -9% 3% -2% 4% -3% -30% -20% -10% 0% 10% 20% 30% 2007 2008 2009 2010 2011 2012 2013
  • 8.
    COPYRIGHT: THE DIRECTMARKETING ASSOCIATION (UK) LTD 2014 ANNUAL DOOR DROP INDUSTRY REPORT 2014 7 Internet Door drop 3% -5% -1% 7% 9% 0% 4%4% -9% -11% 3% 27% 4% -3% 40% 19% 5% 17% 4% 13% 17% -2% -5% -9% 3% -2% 4% -3% -30% -20% -10% 0% 10% 20% 30% 40% 50% 2007 2008 2009 2010 2011 2012 2013 TV Radio
  • 9.
    ANNUAL DOOR DROPINDUSTRY REPORT 2014 COPYRIGHT: THE DIRECT MARKETING ASSOCIATION (UK) LTD 20148 The average number of door drop communications delivered to the average UK household per week has fallen from 7.7 items in 2007 to 4.8 items in 2013. However, it is worth noting that the average numbers in urban, semi-urban and rural homes will vary significantly.   5. Door drops communication per week 7.7 6.8 5.8 5.8 5.1 5.3 4.8 0 1 2 3 4 5 6 7 8 9 10 2007 2008 2009 2010 2011 2012 2013 No.ofdoordropsperweek
  • 10.
    ANNUAL DOOR DROPINDUSTRY REPORT 2014 COPYRIGHT: THE DIRECT MARKETING ASSOCIATION (UK) LTD 20149 The DMA Door Drop Board Committee monitors the total amount of promotional material delivered annually via door drop campaigns. The scope of the industry survey was expanded in 2009 to include the size and weight of door drop items. This revealed a reduction in the size and pagination of door drop material, which has also reduced the overall weight. This exercise has been repeated in 2013 and the results compared with figures from 2007. The DMA Door Drop Board Committee has identified the following key figures for 2007 and 2013. 6.1 Average item weight The average weight of a door drop communication item in 2007 was 18 grams but it has reduced by 17.33% over the last five years and stands at 14.88 grams in 2013. 6. Door drop promotional material facts and figures 2007 to 2012 18 16.5 14.69 14.13 16.24 14.81 14.88 0 2 4 6 8 10 12 14 16 18 20 2007 2008 2009 2010 2011 2012 2013 Weightingrams
  • 11.
    COPYRIGHT: THE DIRECTMARKETING ASSOCIATION (UK) LTD 2014 ANNUAL DOOR DROP INDUSTRY REPORT 2014 10 6.2 Total door drop material The compound position taking into account unit volume and average size/weight means that the total volume of door drop communication material being distributed has fallen from 184,001 tonnes in 2007 to 97,730 tonnes in 2013 (a drop of 46.89%) which, when combined with door drop’s green credentials, is a positive news story for the environment. 184001 149088 114024 111698 113189 106872 97730 0 20000 40000 60000 80000 100000 120000 140000 160000 180000 200000 2007 2008 2009 2010 2011 2012 2013 Weightintonnes
  • 12.
    ANNUAL DOOR DROPINDUSTRY REPORT 2014 COPYRIGHT: THE DIRECT MARKETING ASSOCIATION (UK) LTD 201411 For data published from 2005, the survey was redefined seeking to measure and establish the size of the UK market in terms of volume and spend from advertisers who directly, or through an agency, fund the distribution of their pre‐printed communications material (ie advertiser spend on door drops). This includes revenue and volumes for pre‐printed communications where the advertiser has directly or indirectly (eg via an agency) commissioned and funded the door to door delivery of their prepared (ie pre‐printed or produced) communications material which has then been distributed on a commercial basis. This includes leaflets, catalogues, newsletters and product samples etcetera for commercial organisations, local authorities, charities, central government as well as locally sourced directories. The survey specifically excludes volumes and distribution expenditure for: • Local free weekly newspaper • Items inserted mechanically into paid or free publications • National directories, where these are effectively publications with advertising space sold by the media owner (examples - Yellow Pages, BT Phonebooks, Thomson Directories) The above three‘excluded’categories measure their own advertising revenue separately and have control over their own recycling and waste control arrangements, liaising directly with Defra. Primary research was used to collect the information using a spread sheet and analysed in-house by the DMA’s research department. The commentary is contributed by the Membership, Legal and Administration Committee of the Door Drop Board Committee and the DMA’s communications team. The sample covers all the major door drop companies operating in the UK. This information was collected between January and April 2014 and the data corresponds to January to December 2013. All the information collected is confidential and only aggregates are published in this report. Additional information was collected via secondary research from the Office for National Statistics and the Advertising Association. Methodology
  • 13.
    ANNUAL DOOR DROPINDUSTRY REPORT 2014 COPYRIGHT: THE DIRECT MARKETING ASSOCIATION (UK) LTD 201412 Sources and helpful links Door Drop Promotional Material Weights: DMA Door Drop Council Item Weight Survey 2010 Recycling Levels: Royal Mail and the DMA Direct Marketing Material Waste Prevention Report 2009 http://www.dma.org.uk/toolkit/direct-marketing-material-waste-prevention Other Advertising Expenditure: Advertising Association http://expenditurereport.warc.com/FreeTopLineData.aspx GB Household Figures: Estimates based on data from the Office for National Statistics http://www.ons.gov.uk/ons/rel/family-demography/families-and-households/2013/stb-families.html Appendix
  • 14.
    ANNUAL DOOR DROPINDUSTRY REPORT 2014 COPYRIGHT: THE DIRECT MARKETING ASSOCIATION (UK) LTD 201413 The DMA is Europe’s largest professional body representing the direct marketing industry. With a large in-house team of specialists offering everything from free legal advice and government lobbying on direct marketing issues to research papers and best practice, it is always at the forefront of developments in the industry. The DMA protects the one-to-one to millions industry and consumers. It promotes the highest standards through self-regulation and lobbies against over-regulation. The DM Code of Practice sits at the heart of everything we do – and all members are required to adhere to it. It sets out the industry’s standards of ethical conduct and best practice. Our 15 DMA councils and committees cover the whole marketing spectrum – from the digital world of social media and mobile marketing to offline channels, such as door drops and inserts. The councils are made up of DMA members and regularly produce best practice and how to guides for our members. We also have a packed calendar of conferences, workshops and discussions on the latest topics and best practice, and 80% of them are free for members and their staff. As the industry moves on so do we, which is why we’ve launched a number of new services for our members – a VAT helpline, a Social Media Helpdesk and an IP Protection Service. Visit www.dma.org.uk regularly to keep up to date with all our services. About DMA
  • 15.
    ANNUAL DOOR DROPINDUSTRY REPORT 2014 COPYRIGHT: THE DIRECT MARKETING ASSOCIATION (UK) LTD 201414 The Annual door drop industry report 2014 is published by The Direct Marketing Association (UK) Ltd Copyright © Direct Marketing Association. All rights reserved. No part of this publication may be reproduced, copied or transmitted in any form or by any means, or stored in a retrieval system of any nature, without the prior permission of the DMA (UK) Ltd except as permitted by the provisions of the Copyright, Designs and Patents Act 1988 and related legislation. Application for permission to reproduce all or part of the Copyright material shall be made to the DMA (UK) Ltd, DMA House, 70 Margaret Street, London, W1W 8SS. Although the greatest care has been taken in the preparation and compilation of the Annual door drop industry report 2014, no liability or responsibility of any kind (to extent permitted by law), including responsibility for negligence is accepted by the DMA, its servants or agents. All information gathered is believed correct at July 2014. All corrections should be sent to the DMA for future editions. Copyright and disclaimer