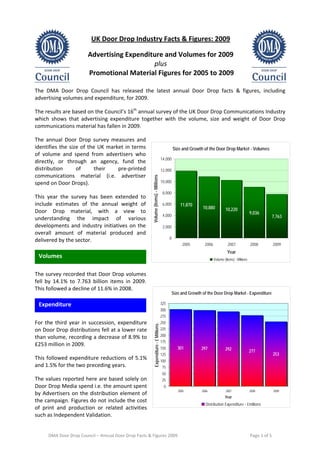
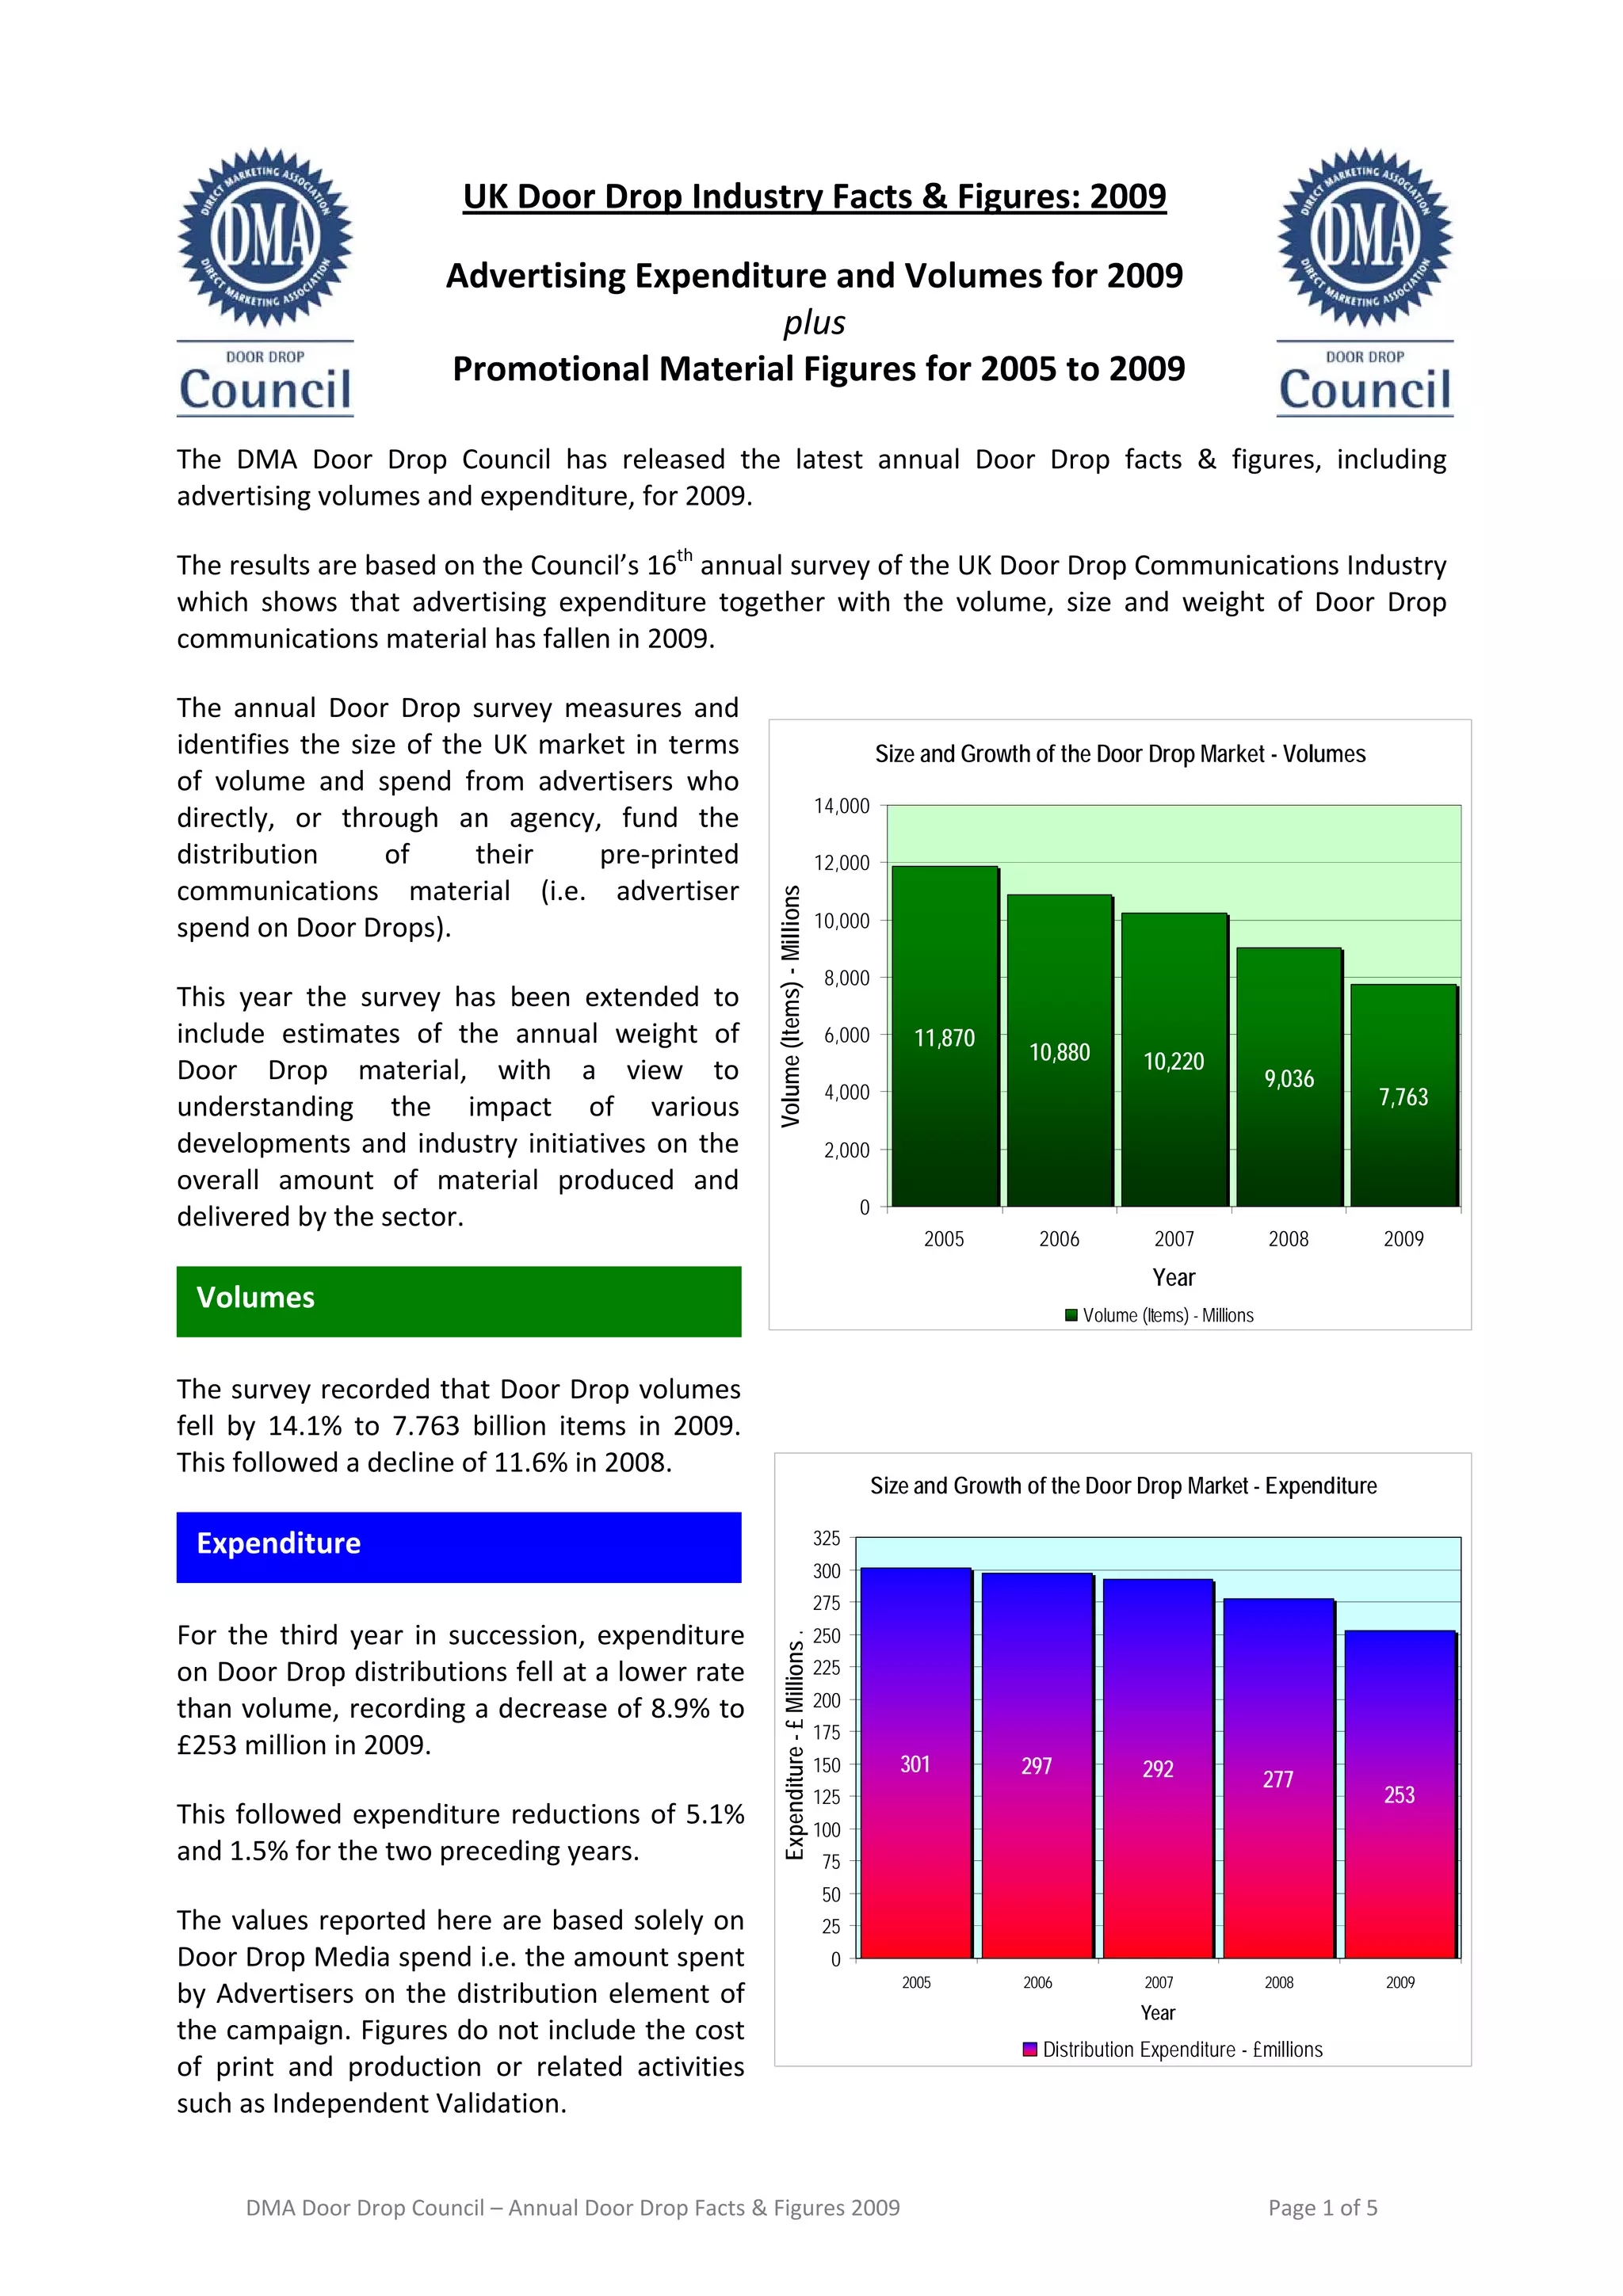
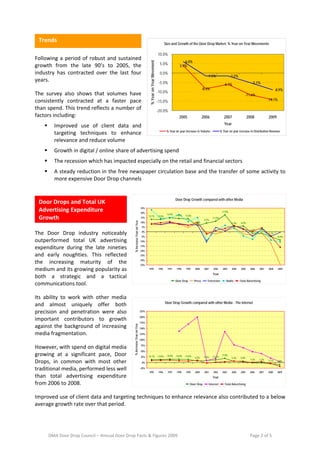
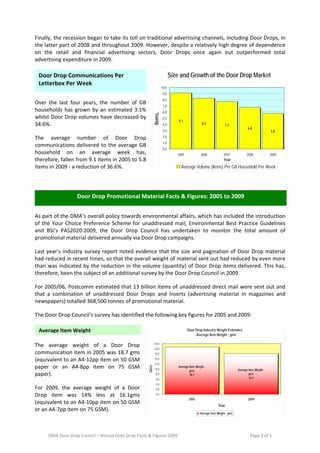
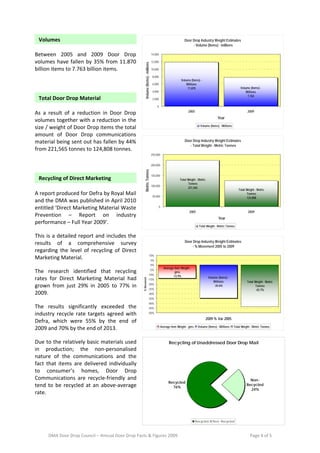
UK Door Drop Industry Facts & Figures: 2009 

                             Advertising Expenditure and Volumes for 2009  
                                                 plus 
                              Promotional Material Figures for 2005 to 2009 

The  DMA  Door  Drop  Council  has  released  the  latest  annual  Door  Drop  facts  &  figures,  including 
advertising volumes and expenditure, for 2009.  

The results are based on the Council’s 16th annual survey of the UK Door Drop Communications Industry 
which  shows  that  advertising  expenditure  together  with  the  volume,  size  and  weight  of  Door  Drop 
communications material has fallen in 2009. 

The  annual  Door  Drop  survey  measures  and 
identifies  the  size  of  the  UK  market  in  terms                                                           Size and Growth of the Door Drop Market - Volumes
of  volume  and  spend  from  advertisers  who 
                                                                                                      14,000
directly,  or  through  an  agency,  fund  the 
distribution        of        their     pre‐printed                                                   12,000
communications  material  (i.e.  advertiser 
                                                                     Volume (Items) - Millions


spend on Door Drops).                                                                                 10,000

                                                                                                       8,000
This  year  the  survey  has  been  extended  to 
include  estimates  of  the  annual  weight  of                                                        6,000        11,870
                                                                                                                                10,880           10,220
Door  Drop  material,  with  a  view  to                                                                                                                             9,036
                                                                                                       4,000                                                                    7,763
understanding  the  impact  of  various 
developments  and  industry  initiatives  on  the                                                      2,000
overall  amount  of  material  produced  and 
                                                                                                            0
delivered by the sector. 
                                                                                                                      2005        2006             2007              2008       2009
                                                                                                                                                   Year
 Volumes                                                                                                                                 Volume (Items) - Millions
                                                                  

The survey recorded that Door Drop volumes 
fell  by  14.1%  to  7.763  billion  items  in  2009.                        Trends xx
This followed a decline of 11.6% in 2008.  
                                                                                                                Size and Growth of the Door Drop Market - Expenditure

 Expenditure                                                                                          325
                                                                                                      300
                                                                                                      275
For  the  third  year  in  succession,  expenditure                                                   250
                                                                         Expenditure - £ Millions .


on Door Drop distributions fell at a lower rate                                                       225

than volume, recording a decrease of 8.9% to                                                          200
                                                                                                      175
£253 million in 2009. 
                                                                                                      150          301         297               292                 277
                                                                                                      125                                                                           253
This  followed  expenditure  reductions  of  5.1%                                                     100
and 1.5% for the two preceding years.                                                                 75
                                                                                                      50
The values reported here  are based solely on                                                         25
Door Drop Media spend i.e. the amount spent                                                            0
                                                                                                                   2005         2006              2007               2008           2009
by  Advertisers  on  the  distribution  element  of 
                                                                                                                                                 Year
the campaign. Figures do not include the cost 
                                                                                                                                  Distribution Expenditure - £millions
of  print  and  production  or  related  activities 
such as Independent Validation.       


      DMA Door Drop Council – Annual Door Drop Facts & Figures 2009                                                                                                  Page 1 of 5 
Trends                                                                                                                         Size and Growth of the Door Drop Market: % Year on Year Movements
                                                                                            
                                                                                                                            10.0%
Following  a  period  of  robust  and  sustained 
                                                                                                                                                   6.0%


                                                                                                  % Year on Year Movement
growth  from  the  late  90’s  to  2005,  the                                                                                5.0%               3.9%
industry  has  contracted  over  the  last  four                                                                             0.0%
                                                                                                                                                                         -1.5%                   -1.5%
years.                                                                                                                       -5.0%                                                                                  -5.1%
                                                                                                                                                                                           -6.1%
                                                                                                                                                                     -8.3%                                                                -8.9%
The  survey  also  shows  that  volumes  have                                                                               -10.0%
                                                                                                                                                                                                             -11.6%
consistently  contracted  at  a  faster  pace                                                                               -15.0%                                                                                                -14.1%

than spend. This trend reflects a number of                                                                                 -20.0%
factors including:                                                                                                                             2005                  2006                  2007                  2008             2009
                                                                                                                                                                                           Year
             Improved  use  of  client  data  and 
                                                                                                                                     % Year on year increase in Volume                  % Year on year increase in Distribution Revenue
              targeting  techniques  to  enhance 
              relevance and reduce volume 
             Growth in digital / online share of advertising spend 
             The recession which has impacted especially on the retail and financial sectors 
             A steady reduction in the free newspaper circulation base and the transfer of some activity to 
              more expensive Door Drop channels  
  
                                                                                                                                             Door Drop Growth compared with other Media
     Door Drops and Total UK 
                                                                                          25%
     Advertising Expenditure                                                              20%                                                                                            17.8%
                                                                                                                                     14.9%   14.0%   13.6%
                                                                                                 13.1%
     Growth                                                
                                                                                          15%
                                                                                                                            13.0%
                                                                                                                                                                      9.2%
                                                                                                                                                                                11.2%
                                                                % Increase Year on Year


                                                                                          10%                                                                6.5%                                 5.4%    6.0%
                                                                                           5%
                                                                                                                                                                                                                  -1.5%   -1.5%
                                                                                           0%
The  Door  Drop  industry  noticeably                                                      -5%
                                                                                                                                                                                                                                  -5.1%
                                                                                                                                                                                                                                           -8.9%
outperformed  total  UK  advertising                                                      -10%
                                                                                          -15%
expenditure  during  the  late  nineties                                                  -20%
and  early  noughties.  This  reflected                                                   -25%
                                                                                          -30%
the  increasing  maturity  of  the                                                        -35%
medium and its growing popularity as                                                             1995                       1996      1997   1998    1999    2000     2001      2002      2003    2004    2005    2006    2007    2008     2009

                                                                                                                                                                                Year
both  a  strategic  and  a  tactical 
                                                                                                                                             Door Drop       Press      Television           Radio       Total Advertising
communications tool.  

Its  ability  to  work  with  other  media 
                                                                                                                                    Door Drop Growth compared with other Media - The Internet
and  almost  uniquely  offer  both 
precision  and  penetration  were  also                                                   225%

                                                                                          200%
important  contributors  to  growth                                                       175%
                                                               % Increase Year on Year


against  the  background  of  increasing                                                  150%

media fragmentation.                                                                      125%

                                                                                          100%

                                                                                          75%
However, with spend on digital media 
                                                                                          50%
growing  at  a  significant  pace,  Door                                                  25%    13.1%                      13.0%    14.9%   14.0%   13.6%
                                                                                                                                                             6.5%     9.2%      11.2%
                                                                                                                                                                                         17.8%
                                                                                                                                                                                                  5.4%   6.0%
                                                                                                                                                                                                                  -1.5%   -1.5%
Drops,  in  common  with  most  other                                                      0%
                                                                                                                                                                                                                                  -5.1%    -8.9%


traditional media, performed less well                                                    -25%
                                                                                                 1995                       1996      1997   1998    1999    2000     2001      2002      2003    2004   2005     2006    2007    2008     2009
than  total  advertising  expenditure                                                                                                                                           Year
from 2006 to 2008.                                                                                                                                       Door Drop           Internet      Total Advertising


Improved use of client data and targeting techniques to enhance relevance also contributed to a below 
average growth rate over that period.  


           DMA Door Drop Council – Annual Door Drop Facts & Figures 2009                                                                                                                                          Page 2 of 5 
Finally, the recession began to take its toll on traditional advertising channels, including Door Drops, in 
the latter part of 2008 and throughout 2009. However, despite a relatively high degree of dependence 
on  the  retail  and  financial  advertising  sectors,  Door  Drops  once  again  out  outperformed  total 
advertising expenditure in 2009.  

    Door Drop Communications Per                                                             Size and Growth of the Door Drop Market
    Letterbox Per Week 
                                                                                      10.0
                                                                                       9.0
                                                                                       8.0
Over  the  last  four  years,  the  number  of  GB 
                                                                                       7.0
households  has  grown  by  an  estimated  3.1%                                        6.0


                                                                             Items.
whilst Door Drop volumes have decreased by                                             5.0
                                                                                                 9.1
34.6%.                                                                                 4.0                         8.3
                                                                                                                                    7.7
                                                                                                                                                    6.8
                                                                                       3.0                                                                           5.8
The  average  number  of  Door  Drop                                                   2.0
                                                                                       1.0
communications  delivered  to  the  average  GB 
                                                                                       0.0
household  on  an  average  week  has,                                                          2005              2006             2007            2008              2009
therefore, fallen from 9.1 items in 2005 to 5.8                                                                                    Year
items in 2009 ‐ a reduction of 36.6%.                                                              Average Volume (Items) Per GB Household Per Week


                        Door Drop Promotional Material Facts & Figures: 2005 to 2009 
                                                                                                                                                                             

As part of the DMA’s overall policy towards environmental affairs, which has included the introduction 
of  the  Your  Choice  Preference  Scheme  for  unaddressed  mail,  Environmental  Best  Practice  Guidelines 
and  BSi’s  PAS2020:2009,  the  Door  Drop  Council  has  undertaken  to  monitor  the  total  amount  of 
promotional material delivered annually via Door Drop campaigns.  

Last  year’s  industry  survey  report  noted  evidence  that  the  size  and  pagination  of  Door  Drop  material 
had reduced in recent times, so that the overall weight of material sent out had reduced by even more 
than  was  indicated  by  the  reduction  in  the  volume  (quantity)  of  Door  Drop  items  delivered.  This  has, 
therefore, been the subject of an additional survey by the Door Drop Council in 2009.  

For 2005/06, Postcomm estimated that 13 billion items of unaddressed direct mail were sent out and 
that  a  combination  of  unaddressed  Door  Drops  and  Inserts  (advertising  material  in  magazines  and 
newspapers) totalled 368,500 tonnes of promotional material. 

The Door Drop Council’s survey has identified the following key figures for 2005 and 2009:  

    Average Item Weight                                         
                                                                                                       Door Drop Industry Weight Estimates
                                                                                                           - Average Item Weight - gms

                                                                              20.0
The  average  weight  of  a  Door  Drop 
                                                                              18.0
communication item in 2005 was 18.7 gms                                       16.0

(equivalent to an A4‐12pp item on 50 GSM                                      14.0
                                                                              12.0
paper  or  an  A4‐8pp  item  on  75  GSM                                                         Average Item Weight -
                                                                       Gms


                                                                              10.0                                                           Average Item Weight -
                                                                                                         gms
paper).                                                                        8.0                       18.7                                        gms
                                                                               6.0                                                                   16.1

                                                                               4.0
For  2009,  the  average  weight  of  a  Door                                  2.0

Drop  item  was  14%  less  at  16.1gms                                        0.0
                                                                                                         2005                                        2009
(equivalent to an A4‐10pp item on 50 GSM                                                                                      Year
or an A4‐7pp item on 75 GSM). 
                                                                                                                 Average Item Weight - gms


       DMA Door Drop Council – Annual Door Drop Facts & Figures 2009                                                                                  Page 3 of 5 
Volumes                                                                                                                      Door Drop Industry Weight Estimates
                                                                                                                                      - Volume (Items) - millions

Between  2005  and  2009  Door  Drop                                                             14,000

volumes  have  fallen  by  35%  from  11.870                                                     12,000


                                                                     Volume (Items) - millions
billion items to 7.763 billion items.                                                            10,000

                                                                                                  8,000
                                                                                                                              Volume (Items) -
                                                                                                  6,000                           Millions
                                                                                                                                   11,870                                      Volume (Items) -
                                                                                                  4,000                                                                            Millions
                                                                                                                                                                                    7,763
    Total Door Drop Material                                                                      2,000

                                                                                                       0
                                                                                                                                    2005                                            2009
As  a  result  of  a  reduction  in  Door  Drop 
                                                                                                                                                             Year
volumes together with a reduction in the 
                                                                                                                                              Volume (Items) - Millions
size / weight of Door Drop items the total 
amount  of  Door  Drop  communications 
material being sent out has fallen by 44%                                                                                        Door Drop Industry Weight Estimates
                                                                                                                                    - Total Weight - Metric Tonnes
from 221,565 tonnes to 124,808 tonnes. 
                                                                                                 250,000

                                                                                                 200,000
                                                                    Metric Tonnes


                                                                                                 150,000
    Recycling of Direct Marketing                                                                                            Total Weight - Metric
                                                                                                                                    Tonnes
                                                                                                 100,000
                                                                                                                                    221,565
                                                                                                                                                                             Total Weight - Metric
A report produced for Defra by Royal Mail                                                         50,000
                                                                                                                                                                                    Tonnes
                                                                                                                                                                                    124,808
and the DMA was published in April 2010 
entitled ‘Direct Marketing Material Waste                                                                  0
                                                                                                                                    2005                                             2009
Prevention  –  Report  on  industry                                                                                                                          Year
performance – Full Year 2009’. 
                                                                                                                                             Total Weight - Metric Tonnes


This is a detailed report and includes the 
                                                                                                                                 Door Drop Industry Weight Estimates
results  of  a  comprehensive  survey                                                                                                 - % Movement 2005 to 2009
regarding  the  level  of  recycling  of  Direct 
                                                                                           10%
Marketing Material.                                                                              5%
                                                                                                 0%
                                                                                                                 Average Item Weight -
                                                                                                 -5%
The  research  identified  that  recycling                                            -10%
                                                                                                                         gms
                                                                                                                        -13.9%                        Volume (Items) -
rates  for  Direct  Marketing  Material  had 
                                                                 % Movement


                                                                                      -15%
                                                                                                                                                          Millions                  Total Weight - Metric
                                                                                      -20%
grown  from  just  29%  in  2005  to  77%  in                                         -25%
                                                                                                                                                          -34.6%                           Tonnes
                                                                                                                                                                                           -43.7%
2009.                                                                                 -30%
                                                                                      -35%
                                                                                      -40%
The  results  significantly  exceeded  the                                            -45%

industry  recycle  rate  targets  agreed  with                                        -50%
                                                                                                                                                     2009 % Var 2005
Defra,  which  were  55%  by  the  end  of 
                                                                                                               Average Item Weight - gms    Volume (Items) - Millions     Total Weight - Metric Tonnes
2009 and 70% by the end of 2013. 

Due to the relatively basic materials used                                                                           Recycling of Unaddressed Door Drop Mail
in  production;  the  non‐personalised 
nature  of  the  communications  and  the 
fact  that  items  are  delivered  individually 
to  consumer’s  homes,  Door  Drop 
Communications  are  recycle‐friendly  and                                                                                                                                            Non-
                                                                                                                     Recycled
tend  to  be  recycled  at  an  above‐average                                                                                                                                       Recycled
                                                                                                                       76%
                                                                                                                                                                                      24%
rate. 


                                                                                                                                           Recycled      Non- Recycled


       DMA Door Drop Council – Annual Door Drop Facts & Figures 2009                                                                                                                  Page 4 of 5 
 
Scope of the Annual Industry Survey: 
        For data published from 2005, the survey was redefined seeking to measure and establish the size of the UK market in terms of 
        volume and spend from advertisers who directly, or through an agency, fund the distribution of their pre‐printed communications           
        material (i.e. advertiser spend on Door Drops). 
        This includes revenue and volumes for pre‐printed communications where the Advertiser has directly or indirectly (e.g. via an Agency) 
        commissioned and funded the door to door delivery of their prepared (i.e. pre‐printed or produced) communications material which 
                                                                                                                                                  
        has then been distributed on a commercial basis.  This includes leaflets, catalogues, newsletters, product samples etc for commercial 
        organisations, local authorities, charities, central government, locally‐sourced directories etc. 
        The survey specifically excludes volumes and distribution expenditure for:                                                                
                  Local Free Weekly Newspapers. 
                  Items inserted mechanically into paid or free publications. 
                                                                                                                                                  
                  National Directories, where these are effectively publications with advertising space sold by the media owner (e.g. Yellow 
                   Pages, BT Phonebooks, Thomson Directories).   
        All three areas excluded above measure their own advertising revenue separately and have direct control over their own recycling 
                                                                                                                                                  
        and waste control direct with DEFRA. 
 
Sources: 
        Door Drop Volumes and Expenditure: DMA Door Drop Council Annual Survey 2009                                                               
        Door Drop Promotional Material Weights: DMA Door Drop Council Item Weight Survey 2009                                                     
        Recycling Levels: Royal Mail and the DMA Direct Marketing Material Waste Prevention Report 2009.                                          
        Other Advertising Expenditure: Advertising Association Advertising Statistics Yearbook 2009                                               
        GB Household Figures: Estimates based on data from the Office for National Statistics                                                     

        © Copyright DMA Door Drop Council, May 2010                                                                                               


           DMA Door Drop Council – Annual Door Drop Facts & Figures 2009                                                        Page 5 of 5 

Door Drop Facts & Figures 2009 UK

  • 1.
    UK Door Drop Industry Facts & Figures: 2009  Advertising Expenditure and Volumes for 2009   plus   Promotional Material Figures for 2005 to 2009  The  DMA  Door  Drop  Council  has  released  the  latest  annual  Door  Drop  facts  &  figures,  including  advertising volumes and expenditure, for 2009.   The results are based on the Council’s 16th annual survey of the UK Door Drop Communications Industry  which  shows  that  advertising  expenditure  together  with  the  volume,  size  and  weight  of  Door  Drop  communications material has fallen in 2009.  The  annual  Door  Drop  survey  measures  and  identifies  the  size  of  the  UK  market  in  terms  Size and Growth of the Door Drop Market - Volumes of  volume  and  spend  from  advertisers  who  14,000 directly,  or  through  an  agency,  fund  the  distribution  of  their  pre‐printed  12,000 communications  material  (i.e.  advertiser  Volume (Items) - Millions spend on Door Drops).   10,000 8,000 This  year  the  survey  has  been  extended  to  include  estimates  of  the  annual  weight  of  6,000 11,870 10,880 10,220 Door  Drop  material,  with  a  view  to  9,036 4,000 7,763 understanding  the  impact  of  various  developments  and  industry  initiatives  on  the  2,000 overall  amount  of  material  produced  and  0 delivered by the sector.  2005 2006 2007 2008 2009 Year Volumes  Volume (Items) - Millions   The survey recorded that Door Drop volumes  fell  by  14.1%  to  7.763  billion  items  in  2009.  Trends xx This followed a decline of 11.6% in 2008.   Size and Growth of the Door Drop Market - Expenditure Expenditure  325   300 275 For  the  third  year  in  succession,  expenditure  250 Expenditure - £ Millions . on Door Drop distributions fell at a lower rate  225 than volume, recording a decrease of 8.9% to  200 175 £253 million in 2009.  150 301 297 292 277 125 253 This  followed  expenditure  reductions  of  5.1%  100 and 1.5% for the two preceding years.  75 50 The values reported here  are based solely on  25 Door Drop Media spend i.e. the amount spent  0 2005 2006 2007 2008 2009 by  Advertisers  on  the  distribution  element  of  Year the campaign. Figures do not include the cost  Distribution Expenditure - £millions of  print  and  production  or  related  activities  such as Independent Validation.        DMA Door Drop Council – Annual Door Drop Facts & Figures 2009                                                      Page 1 of 5 
  • 2.
    Trends  Size and Growth of the Door Drop Market: % Year on Year Movements   10.0% Following  a  period  of  robust  and  sustained  6.0% % Year on Year Movement growth  from  the  late  90’s  to  2005,  the  5.0% 3.9% industry  has  contracted  over  the  last  four  0.0% -1.5% -1.5% years.   -5.0% -5.1% -6.1% -8.3% -8.9% The  survey  also  shows  that  volumes  have  -10.0% -11.6% consistently  contracted  at  a  faster  pace  -15.0% -14.1% than spend. This trend reflects a number of  -20.0% factors including:   2005 2006 2007 2008 2009 Year  Improved  use  of  client  data  and  % Year on year increase in Volume % Year on year increase in Distribution Revenue targeting  techniques  to  enhance  relevance and reduce volume   Growth in digital / online share of advertising spend   The recession which has impacted especially on the retail and financial sectors   A steady reduction in the free newspaper circulation base and the transfer of some activity to  more expensive Door Drop channels      Door Drop Growth compared with other Media Door Drops and Total UK  25% Advertising Expenditure  20% 17.8% 14.9% 14.0% 13.6% 13.1% Growth    15% 13.0% 9.2% 11.2% % Increase Year on Year 10% 6.5% 5.4% 6.0% 5% -1.5% -1.5% 0% The  Door  Drop  industry  noticeably  -5% -5.1% -8.9% outperformed  total  UK  advertising  -10% -15% expenditure  during  the  late  nineties  -20% and  early  noughties.  This  reflected  -25% -30% the  increasing  maturity  of  the  -35% medium and its growing popularity as  1995 1996 1997 1998 1999 2000 2001 2002 2003 2004 2005 2006 2007 2008 2009 Year both  a  strategic  and  a  tactical  Door Drop Press Television Radio Total Advertising communications tool.   Its  ability  to  work  with  other  media  Door Drop Growth compared with other Media - The Internet and  almost  uniquely  offer  both  precision  and  penetration  were  also  225% 200% important  contributors  to  growth  175% % Increase Year on Year against  the  background  of  increasing  150% media fragmentation.  125% 100% 75% However, with spend on digital media  50% growing  at  a  significant  pace,  Door  25% 13.1% 13.0% 14.9% 14.0% 13.6% 6.5% 9.2% 11.2% 17.8% 5.4% 6.0% -1.5% -1.5% Drops,  in  common  with  most  other  0% -5.1% -8.9% traditional media, performed less well  -25% 1995 1996 1997 1998 1999 2000 2001 2002 2003 2004 2005 2006 2007 2008 2009 than  total  advertising  expenditure  Year from 2006 to 2008.  Door Drop Internet Total Advertising Improved use of client data and targeting techniques to enhance relevance also contributed to a below  average growth rate over that period.   DMA Door Drop Council – Annual Door Drop Facts & Figures 2009                                                      Page 2 of 5 
  • 3.
    Finally, the recession began to take its toll on traditional advertising channels, including Door Drops, in  the latter part of 2008 and throughout 2009. However, despite a relatively high degree of dependence  on  the  retail and  financial  advertising  sectors,  Door  Drops  once  again  out  outperformed  total  advertising expenditure in 2009.   Door Drop Communications Per  Size and Growth of the Door Drop Market Letterbox Per Week  10.0   9.0 8.0 Over  the  last  four  years,  the  number  of  GB  7.0 households  has  grown  by  an  estimated  3.1%  6.0 Items. whilst Door Drop volumes have decreased by  5.0 9.1 34.6%.  4.0 8.3 7.7 6.8 3.0 5.8 The  average  number  of  Door  Drop  2.0 1.0 communications  delivered  to  the  average  GB  0.0 household  on  an  average  week  has,  2005 2006 2007 2008 2009 therefore, fallen from 9.1 items in 2005 to 5.8  Year items in 2009 ‐ a reduction of 36.6%.  Average Volume (Items) Per GB Household Per Week   Door Drop Promotional Material Facts & Figures: 2005 to 2009    As part of the DMA’s overall policy towards environmental affairs, which has included the introduction  of  the  Your  Choice  Preference  Scheme  for  unaddressed  mail,  Environmental  Best  Practice  Guidelines  and  BSi’s  PAS2020:2009,  the  Door  Drop  Council  has  undertaken  to  monitor  the  total  amount  of  promotional material delivered annually via Door Drop campaigns.   Last  year’s  industry  survey  report  noted  evidence  that  the  size  and  pagination  of  Door  Drop  material  had reduced in recent times, so that the overall weight of material sent out had reduced by even more  than  was  indicated  by  the  reduction  in  the  volume  (quantity)  of  Door  Drop  items  delivered.  This  has,  therefore, been the subject of an additional survey by the Door Drop Council in 2009.   For 2005/06, Postcomm estimated that 13 billion items of unaddressed direct mail were sent out and  that  a  combination  of  unaddressed  Door  Drops  and  Inserts  (advertising  material  in  magazines  and  newspapers) totalled 368,500 tonnes of promotional material.  The Door Drop Council’s survey has identified the following key figures for 2005 and 2009:   Average Item Weight    Door Drop Industry Weight Estimates - Average Item Weight - gms 20.0 The  average  weight  of  a  Door  Drop  18.0 communication item in 2005 was 18.7 gms  16.0 (equivalent to an A4‐12pp item on 50 GSM  14.0 12.0 paper  or  an  A4‐8pp  item  on  75  GSM  Average Item Weight - Gms 10.0 Average Item Weight - gms paper).  8.0 18.7 gms 6.0 16.1 4.0 For  2009,  the  average  weight  of  a  Door  2.0 Drop  item  was  14%  less  at  16.1gms  0.0 2005 2009 (equivalent to an A4‐10pp item on 50 GSM  Year or an A4‐7pp item on 75 GSM).  Average Item Weight - gms DMA Door Drop Council – Annual Door Drop Facts & Figures 2009                                                      Page 3 of 5 
  • 4.
    Volumes    Door Drop Industry Weight Estimates - Volume (Items) - millions Between  2005  and  2009  Door  Drop  14,000 volumes  have  fallen  by  35%  from  11.870  12,000 Volume (Items) - millions billion items to 7.763 billion items.  10,000 8,000 Volume (Items) -   6,000 Millions 11,870 Volume (Items) - 4,000 Millions 7,763 Total Door Drop Material    2,000 0 2005 2009 As  a  result  of  a  reduction  in  Door  Drop  Year volumes together with a reduction in the  Volume (Items) - Millions size / weight of Door Drop items the total  amount  of  Door  Drop  communications  material being sent out has fallen by 44%  Door Drop Industry Weight Estimates - Total Weight - Metric Tonnes from 221,565 tonnes to 124,808 tonnes.  250,000   200,000 Metric Tonnes 150,000 Recycling of Direct Marketing  Total Weight - Metric   Tonnes 100,000 221,565 Total Weight - Metric A report produced for Defra by Royal Mail  50,000 Tonnes 124,808 and the DMA was published in April 2010  entitled ‘Direct Marketing Material Waste  0 2005 2009 Prevention  –  Report  on  industry  Year performance – Full Year 2009’.  Total Weight - Metric Tonnes This is a detailed report and includes the  Door Drop Industry Weight Estimates results  of  a  comprehensive  survey  - % Movement 2005 to 2009 regarding  the  level  of  recycling  of  Direct  10% Marketing Material.  5% 0% Average Item Weight - -5% The  research  identified  that  recycling  -10% gms -13.9% Volume (Items) - rates  for  Direct  Marketing  Material  had  % Movement -15% Millions Total Weight - Metric -20% grown  from  just  29%  in  2005  to  77%  in  -25% -34.6% Tonnes -43.7% 2009.   -30% -35% -40% The  results  significantly  exceeded  the  -45% industry  recycle  rate  targets  agreed  with  -50% 2009 % Var 2005 Defra,  which  were  55%  by  the  end  of  Average Item Weight - gms Volume (Items) - Millions Total Weight - Metric Tonnes 2009 and 70% by the end of 2013.  Due to the relatively basic materials used  Recycling of Unaddressed Door Drop Mail in  production;  the  non‐personalised  nature  of  the  communications  and  the  fact  that  items  are  delivered  individually  to  consumer’s  homes,  Door  Drop  Communications  are  recycle‐friendly  and  Non- Recycled tend  to  be  recycled  at  an  above‐average  Recycled 76% 24% rate.    Recycled Non- Recycled DMA Door Drop Council – Annual Door Drop Facts & Figures 2009                                                      Page 4 of 5 
  • 5.
      Scope of the Annual Industry Survey:  For data published from 2005, the survey was redefined seeking to measure and establish the size of the UK market in terms of    volume and spend from advertisers who directly, or through an agency, fund the distribution of their pre‐printed communications    material (i.e. advertiser spend on Door Drops).  This includes revenue and volumes for pre‐printed communications where the Advertiser has directly or indirectly (e.g. via an Agency)  commissioned and funded the door to door delivery of their prepared (i.e. pre‐printed or produced) communications material which      has then been distributed on a commercial basis.  This includes leaflets, catalogues, newsletters, product samples etc for commercial  organisations, local authorities, charities, central government, locally‐sourced directories etc.    The survey specifically excludes volumes and distribution expenditure for:       Local Free Weekly Newspapers.   Items inserted mechanically into paid or free publications.       National Directories, where these are effectively publications with advertising space sold by the media owner (e.g. Yellow  Pages, BT Phonebooks, Thomson Directories).    All three areas excluded above measure their own advertising revenue separately and have direct control over their own recycling      and waste control direct with DEFRA.    Sources:    Door Drop Volumes and Expenditure: DMA Door Drop Council Annual Survey 2009      Door Drop Promotional Material Weights: DMA Door Drop Council Item Weight Survey 2009      Recycling Levels: Royal Mail and the DMA Direct Marketing Material Waste Prevention Report 2009.      Other Advertising Expenditure: Advertising Association Advertising Statistics Yearbook 2009      GB Household Figures: Estimates based on data from the Office for National Statistics      © Copyright DMA Door Drop Council, May 2010      DMA Door Drop Council – Annual Door Drop Facts & Figures 2009                                                      Page 5 of 5