Downloaded 50 times
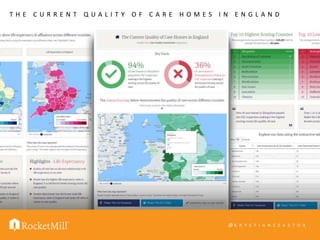
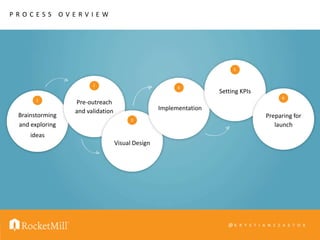
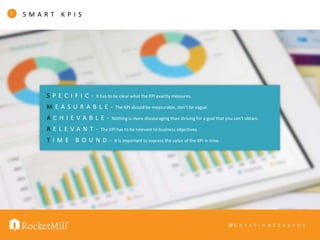


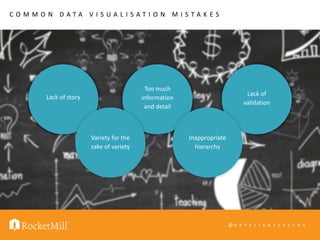


This document outlines a DIY data visualization content marketing strategy focused on generating effective content that leads to natural links. It details a structured process from brainstorming ideas to the launch of the content, emphasizing the importance of KPIs that are specific, measurable, achievable, relevant, and time-bound. Key insights include the relationship between socioeconomic factors and care home quality, along with common pitfalls in data visualization.


