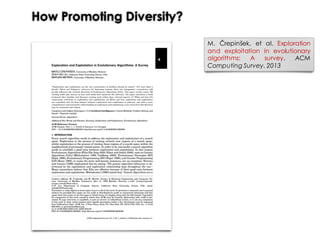
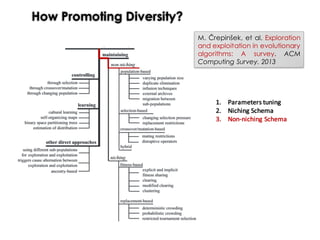
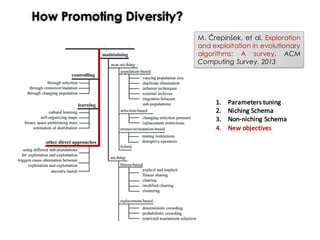
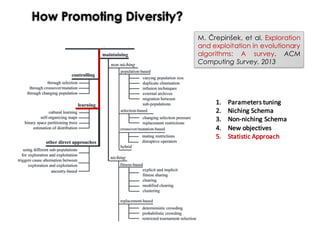
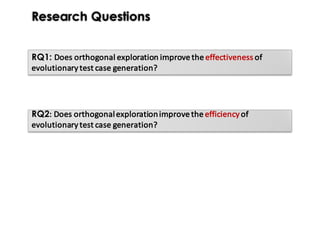
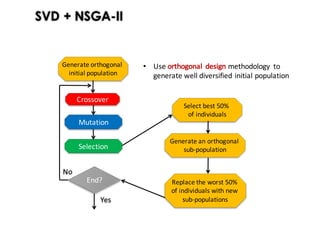
![Key factors for GAs
“Genetic Algorithms (GAs) must maintain a balance between the
exploitation […] and the exploration […] as to increase the probability of
finding the optimal solution.” Wong et al. [2003]
Exploitation: find nearby better solutions by promoting beneficial aspects
(genes) of existing solutions.
Exploration: find new solutions in different regions of the search space by
generating solutions with new aspects](https://image.slidesharecdn.com/issse2014-160321230237/85/Diversity-mechanisms-for-evolutionary-populations-in-Search-Based-Software-Engineering-5-320.jpg)
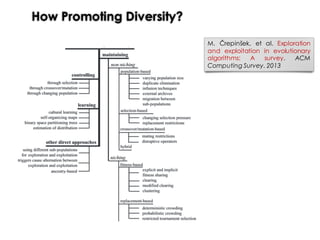
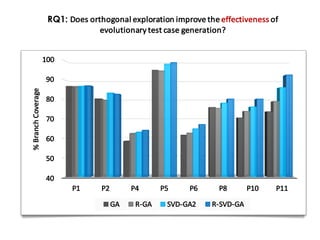
![Key factors for GAs
“Genetic Algorithms (GAs) must maintain a balance between the
exploitation […] and the exploration […] as to increase the probability of
finding the optimal solution.” Wong et al. [2003]
Exploitation: find nearby better solutions by promoting beneficial aspects
(genes) of existing solutions. It is guaranteed by:
• Selection: it selects the fittest individuals for reproduction
• Crossover: it generate new nearby solutions
Exploration: find new solutions in different regions of the search space by
generating solutions with new aspects. It is guaranteed by:
• Mutation: it randomly modifies individuals with a given probability, and
thus increases the structural diversity of a population.](https://image.slidesharecdn.com/issse2014-160321230237/85/Diversity-mechanisms-for-evolutionary-populations-in-Search-Based-Software-Engineering-6-320.jpg)
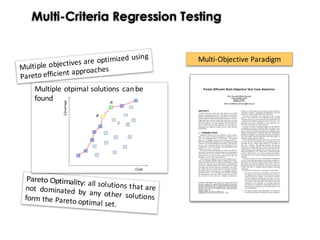
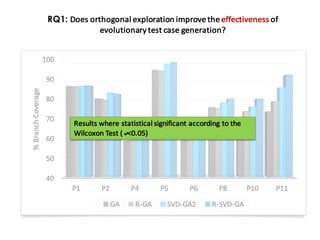
![0.5
1.5
0.5
1.5
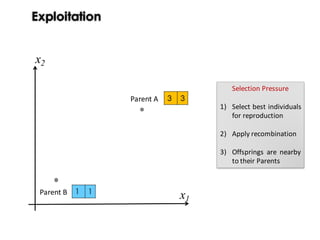
Exploitation
Selection Pressure
To find nearby better
solutions using crossover
and selection.
( ) ]2;0[,1)1(sin)(min 8
∈+−= xxxf
x
f(x)](https://image.slidesharecdn.com/issse2014-160321230237/85/Diversity-mechanisms-for-evolutionary-populations-in-Search-Based-Software-Engineering-7-320.jpg)
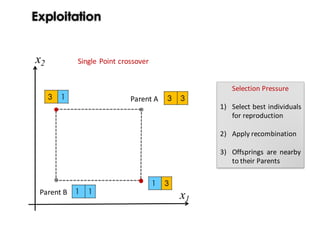
![Exploration
GA got you
from here…
x
f(x)
( ) ]3.2;0[,1)1(sin)(min 8
∈+−= xxxf](https://image.slidesharecdn.com/issse2014-160321230237/85/Diversity-mechanisms-for-evolutionary-populations-in-Search-Based-Software-Engineering-11-320.jpg)
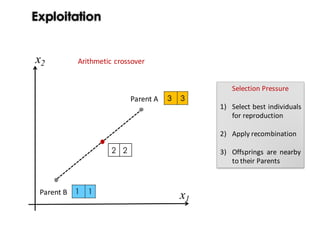
![Exploration
GA got you
from here…
( ) ]3.2;0[,1)1(sin)(min 8
∈+−= xxxf
Exploration
Looking for new
unexplored regions
x
f(x)](https://image.slidesharecdn.com/issse2014-160321230237/85/Diversity-mechanisms-for-evolutionary-populations-in-Search-Based-Software-Engineering-12-320.jpg)
![Exploration
GA got you
from here…
to here…
…but if you tried
something
radical…
( ) ]3.2;0[,1)1(sin)(min 8
∈+−= xxxf
x
f(x)](https://image.slidesharecdn.com/issse2014-160321230237/85/Diversity-mechanisms-for-evolutionary-populations-in-Search-Based-Software-Engineering-13-320.jpg)
![Exploration
GA got you
from here…
to here…
…but if you tried
something
radical…
…you could
get here!
( ) ]3.2;0[,1)1(sin)(min 8
∈+−= xxxf
x
f(x)](https://image.slidesharecdn.com/issse2014-160321230237/85/Diversity-mechanisms-for-evolutionary-populations-in-Search-Based-Software-Engineering-14-320.jpg)
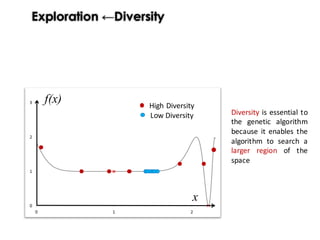
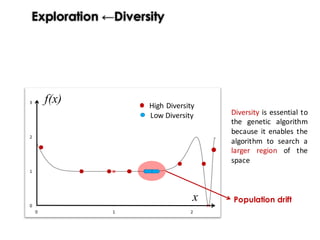
![Exploration ←Diversity
“Progress in evolution depends fundamentally on the existence of variation of
population.”
“Unfortunately, a key problem in many Evolutionary Computation (EC) systems is
the loss of diversity through premature convergence. ”
McPhee and Hopper [2]
“This lack of diversity often leads to stagnation, as the system finds itself trapped
in local optima, lacking the genetic diversity needed to escape. ”](https://image.slidesharecdn.com/issse2014-160321230237/85/Diversity-mechanisms-for-evolutionary-populations-in-Search-Based-Software-Engineering-17-320.jpg)

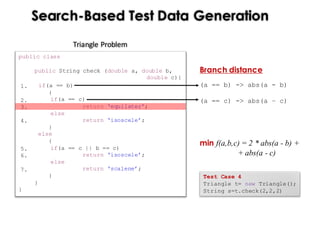
![c=2 a, b ϵ [-1;4]
a
b
Fitness
1) Flat seach space
2) Several Local optimal
3) Only one global optimum
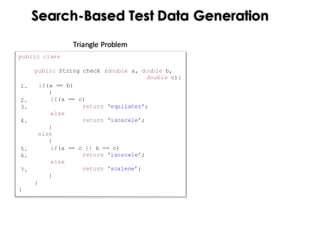
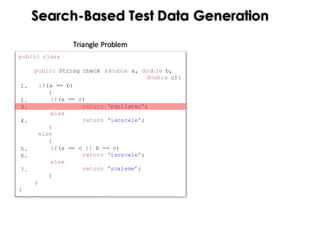
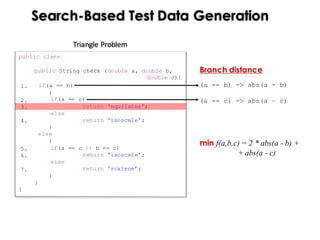
Triangle Problem
Search-Based Test Data Generation](https://image.slidesharecdn.com/issse2014-160321230237/85/Diversity-mechanisms-for-evolutionary-populations-in-Search-Based-Software-Engineering-26-320.jpg)
![a, b ϵ [-30;30]
c=2
a
b
Fitness
GAs Simulation
Mutation Rate = 0.10
Population = 50
Crossover = single-point
Premature convergence
(genetic drift)](https://image.slidesharecdn.com/issse2014-160321230237/85/Diversity-mechanisms-for-evolutionary-populations-in-Search-Based-Software-Engineering-27-320.jpg)


![Mutation Rate
Peaks Funtcion
x1
x2
f(x)
Mutation Type = uniform
Mutation Rate = 0.01
Population Size =50
Crossover = Single-point
Crossover prob. = 0.6
Selection = roulette wheel
[Whitley and Starkweather 1990]](https://image.slidesharecdn.com/issse2014-160321230237/85/Diversity-mechanisms-for-evolutionary-populations-in-Search-Based-Software-Engineering-40-320.jpg)
![Mutation Rate
Peaks Funtcion
x1
x2
f(x)
Exploitation
Exploration
Sub-optimal
solutions
can be reached
Mutation Type = uniform
Mutation Rate = 0.01
Population Size =50
Crossover = Single-point
Crossover prob. = 0.6
Selection = roulette wheel
[Whitley and Starkweather 1990]](https://image.slidesharecdn.com/issse2014-160321230237/85/Diversity-mechanisms-for-evolutionary-populations-in-Search-Based-Software-Engineering-41-320.jpg)
![Mutation Rate
Peaks Funtcion
x1
x2
f(x)
GAs might remain
at certain distance
to the optimum
Exploitation
Exploration
Mutation Type = uniform
Mutation Rate = 0.90
Population Size =50
Crossover = Single-point
Crossover prob. = 0.6
Selection = roulette wheel
[Whitley and Starkweather 1990]](https://image.slidesharecdn.com/issse2014-160321230237/85/Diversity-mechanisms-for-evolutionary-populations-in-Search-Based-Software-Engineering-42-320.jpg)
![Mutation Rate
Peaks Funtcion
x1
x2
f(x)
GAs might remain
at certain distance
to the optimum
Exploitation
Exploration
Mutation Type = uniform
Mutation Rate = 0.90
Population Size =50
Crossover = Single-point
Crossover prob. = 0.6
Selection = roulette wheel
[Whitley and Starkweather 1990]](https://image.slidesharecdn.com/issse2014-160321230237/85/Diversity-mechanisms-for-evolutionary-populations-in-Search-Based-Software-Engineering-43-320.jpg)
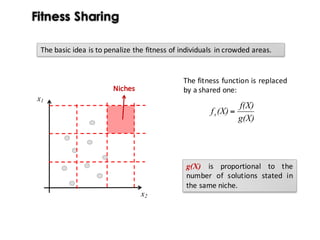
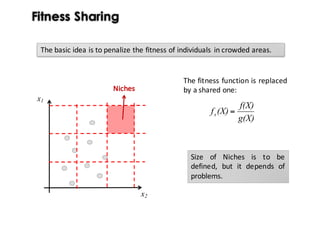
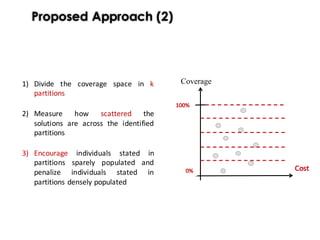
![Fitness Sharing
x1
x2
The basic idea is to penalize the fitness of individuals in crowded areas.
1) Divide the search space in partitions
or segments
2) Measure how scattered the
solutions are across the identified
partitions
3) Encourage individuals stated in
partitions sparely populated and
penalize individuals stated in
partitions densely populated
Niches
[Holland 1975]
[Goldberg and Richardson 198]](https://image.slidesharecdn.com/issse2014-160321230237/85/Diversity-mechanisms-for-evolutionary-populations-in-Search-Based-Software-Engineering-45-320.jpg)
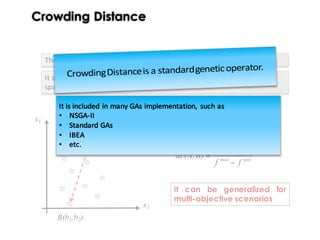
![Crowding Distance
The most used diversity preserving techniques is the crowding distance.
x1
x2
A(a1,a2)
B(b1,b2)
[Mahfoud 1995]](https://image.slidesharecdn.com/issse2014-160321230237/85/Diversity-mechanisms-for-evolutionary-populations-in-Search-Based-Software-Engineering-49-320.jpg)
![Crowding Distance
x1
x2
It selects individuals that are distant from each other in the objectives
space.
( ) ( )
)B,A(
babaB)(A,d
babaB)(A,d
11
2
22
2
11
Hamming
222
1
−+−=
−+−=
Genotype
The independent variables
can have different ranges!
The most used diversity preserving techniques is the crowding distance.
x1
x2
A(a1,a2)
B(b1,b2)
[Mahfoud 1995]](https://image.slidesharecdn.com/issse2014-160321230237/85/Diversity-mechanisms-for-evolutionary-populations-in-Search-Based-Software-Engineering-50-320.jpg)
![Crowding Distance
minmax
ff
f(B)f(A)
B)dc(A,
−
−
=
Phenotype
x1
x2
It selects individuals that are distant from each other in the objectives
space.
The most used diversity preserving techniques is the crowding distance.
x1
x2
A(a1,a2)
B(b1,b2)
It can be generalized for
multi-objective scenarios
[Mahfoud 1995]](https://image.slidesharecdn.com/issse2014-160321230237/85/Diversity-mechanisms-for-evolutionary-populations-in-Search-Based-Software-Engineering-51-320.jpg)
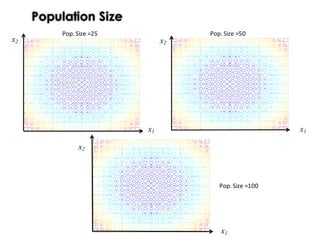
![Population Size
The idea is to maintain diversity by varying the population size.
Steps:
1. Run GA with a given initial population size(PopSize=M)
2. Once GA converged storethe best solution
3. Increase PopSize=PopSize*2
4. Re-run with the new population size
5. Repeat steps 2-4 until the best solution is not improved for k re-runs
[McPhee and Hopper 1999]](https://image.slidesharecdn.com/issse2014-160321230237/85/Diversity-mechanisms-for-evolutionary-populations-in-Search-Based-Software-Engineering-54-320.jpg)
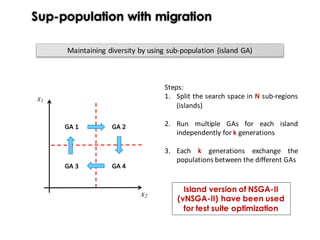
![Injection of new individuals
The idea is to maintain diversity by replacing identical individuals.
Variants:
1. Single generation: during each generation replace duplicated solutions
with new random ones (injection)
Issue: already explored individuals might be regenerated
2. Archive based: all individuals are stored in an archive of individuals
already explored; during each generation:
i. replace solutions already presents in the archive with new random
ones
ii. update archive
Issue: it requires to store all individuals (too memory)
[Chaiyaratana et al. 2007]
[Zhang and Sanderson 2009]](https://image.slidesharecdn.com/issse2014-160321230237/85/Diversity-mechanisms-for-evolutionary-populations-in-Search-Based-Software-Engineering-56-320.jpg)
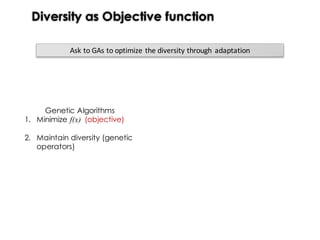
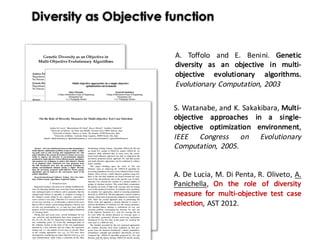
![Diversity as Objective function
Ask to GAs to optimize the diversity through adaptation
Genetic Algorithms
1. Minimize f(x) (objective)
2. Maintain diversity (genetic
operators) (objective)
Multi-Objective Problem
min f(x)
min [f1(x),..., fn(x)]
min [f(x) d(x)]
min [f1(x) ... fn(x) d(x)]
Single-Objective Problem
d(x)= average similarity between
x and the other solutions](https://image.slidesharecdn.com/issse2014-160321230237/85/Diversity-mechanisms-for-evolutionary-populations-in-Search-Based-Software-Engineering-60-320.jpg)


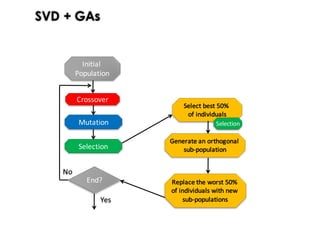

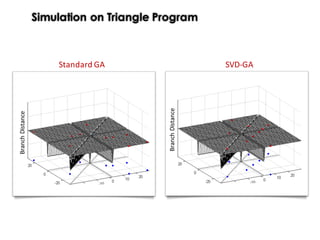
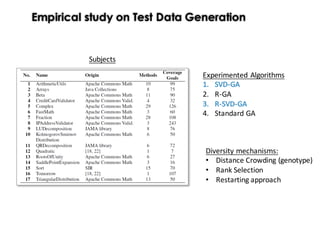
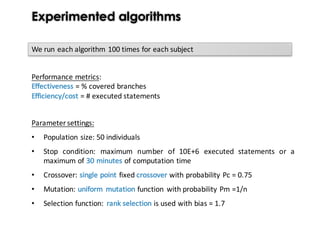
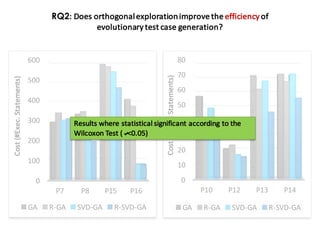


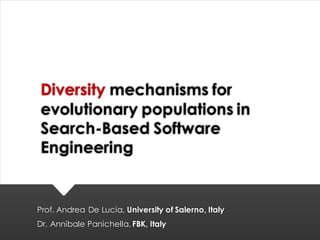
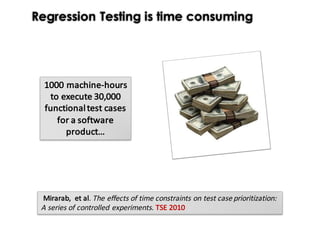
This document discusses mechanisms for maintaining diversity in evolutionary algorithms. It begins by explaining the importance of balancing exploration and exploitation. Several techniques for preserving diversity are then presented, including modifying genetic operators, changing the objective function, and applying statistical methods. Empirical evaluations demonstrate how diversity mechanisms can improve performance in search-based software engineering problems like test data generation and test suite optimization, which often suffer from premature convergence and getting stuck in local optima due to loss of diversity. Parameter tuning techniques like adjusting the mutation rate and niching methods like fitness sharing are also described as ways to explicitly promote diversity.