This document provides a geological interpretation of Elgol on the Strathaird Peninsula of the Isle of Skye, Scotland. It describes the Jurassic-aged sedimentary units in the mapped area, including coarse-grained sandstone formations separated by finer-grained shale units, indicating deposition in a deltaic environment with fluctuating sea levels. During the Paleogene period, the area experienced intense igneous activity in the form of basalt lava flows, sills, and dykes cutting through the older sedimentary rocks. Structural contour mapping was used to infer boundaries between units where outcrops were lacking inland.
I spent 7 weeks individually mapping an area of 14Km2. Strath lies on the eastern periphery of the Cuillin centre, and contains exposure of formations from Pre-Cambrian Torridonian sediments, to Palaeogene Igneous complexes.
I carried out geological field mapping, whilst conducting research to study the composition and origin of the formations. This poster was submitted with a separate report.
The project has stimulated my curiosity in structural geology, particularly faulting and folding. I observed a fascinating uncomfortable relationship between tertiary igneous intrusions and Ordovician carbonates.
Towards the coast are Jurassic Shales that allowed me to explore subsurface fluid flow and observe well preserved marine fossils.
I achieved a first-class grade for my dissertation.
A dissertation project in partial completion of Durham Universities Geology F600 Program with funding from Durham Universities Department of Earth Sciences. Fieldwork was carried out over a period of 6 weeks from the Oystercatcher House B&B, Raasay.
Application of Low Frequency Passive Seismic Method for Hydrocarbon Detection...Andika Perbawa
Passive seismic survey is a geophysical method that utilizes a spectral frequency from seismicity data to identify subsurface reservoir fluids. Rock pores that contain hydrocarbon fluids show higher low-frequency amplitude between 2-4 Hz compared with those that contain water. This paper shows the feasibility study that has been done in S Field, South Sumatra Basin. Four wells were used to validate the result of the spectral data. This method is also considered as a prospect ranking tool in the vicinity of the S field.
Eighteen measurement points were collected and grouped into 6 clusters. Four clusters are located near S-1, S-2, S-3, and S-4 wells. One cluster is located on prospect K and the other one on prospect G. Standard signal processing flows were conducted such as band-pass filter, FFT, and moving average.
The result shows that the maximum amplitude low-frequency between 2-4 Hz of K and S-1 is less than 0.017. On the other hand, S-2, S-3, S-4 and G show a relatively high amplitude of more than 0.02 which indicates a greater possibility of hydrocarbon accumulation when compared with K and S-1. This result was confirmed by gas production in S-2 and oil production in S-3. S-4 has not been tested yet, but the refined well correlation it indicates that there is a limestone reservoir of about 60 feet above OWC. S-1 shows a low amplitude which indicates low potential. The completion log confirmed that the well did not penetrate the reservoir target. Prospect G which has a high amplitude of low-frequency anomaly is more interesting than prospect K.
To conclude, low-frequency passive seismic method was successful in distinguishing between water or no hydrocarbons. It is feasible to employ this methodology as a tool for hydrocarbon detection and also as a tool to help in prospect ranking.
Structural measurements in oriented core photograph january 2019_galkineVadim Galkine
n this post I describe the method of structural measurements of planar structures using oriented core digital photographs. The main advantage of the method is an opportunity to reduce field-based time of the drill-core processing. All the measurements can be done in the office.
Users can work either in the standard GIS platforms (ArcMap, MapInfo etc) or even use digitizers outside of GIS environment which makes the technique comparatively cheap.
The method consists of two steps:
1) digitazing photographs and obtaining a table of xy coordinates of the three-point sets of planar structures
2) calculating actual structure orientations using the MSExcel calculation spreadsheets.
The spreadsheets are provided as attachments to the post. They can also be downloaded from http://remoteexploration.com/oriented-core-techniques.html
Five days field report of Gilgit Baltistan .
Started from Mansehra then Besham then Kohistan then Gilgit and at last stop is in Hunza.
Visited dasu and basha dam.
each and every feature realed to geology is marked in this field report.
Methods and stages of Mineral Exploration: Adaptive Resource Management PlanNgatcha Bryan
Exploration can be divided into a number of interlinked and sequential stages which involve increasing
expenditure and decreasing risk. Early stages of exploration are planning and prospecting. The planning
stage covers the selection of commodity, type of deposit, exploration methods, and the seĴing up of an
exploration entity. Prospecting covers activities leading to the selection of an area for detailed ground
work; this is the point at which land is acquired. The subsequent stages involve targeted prospecting and
exploration in order to quantify and qualify the mineral resources. Pre-feasibility study is then
performed for evaluating the commercial viability of the deposit (Adapted from Moon et al., 2006).
To understand the General Tectonic setting of Pakistan which includes all tectonic segments and the currently active convergent boundaries present in Pakistan
Petroleum system and geology of lower indus basinhamza3195
this presentation is about the petroleum system and geology of lower indus basin. moreover there are some operational fields discussed in this presentation.
a SAMPLE OF MY SKILLED WORK IN A PRESS RELAESE "CUTTINGS" SLIDESHOW.
i GAINED PROFITABLE £210 000 ORDER FROM JUS ONE PRESS REALEASE.
mY ACHIEVED GOAL WAS TO ACHIEVE 52 PRESS RELAESES PUBLISHED IN ONE YERA ( 1 A WEEK!)
tHAT TAKES OME TENACITY
gARY jAMES lIPTROT mcim cHARTERED mARKETER
yuk ikutan kelas Not Balok di Gedung Cisadane Kota Tangerang setiap hari Jum'at jam 3 sore,,, terbuka untuk umum bareng kita-kita Tiyadhita Marching Brass (Music Coach : Kak Aldy Yuditiyanto)
• Designed a Bio Inspired Transfemoral Prosthesis System for the amputes based on Artificial Neural Networks implemented on MATLAB.
• Designed a prototype of a Prosthetic limb and trained the same using Artificial neural networks to replicate the working of the biological Limb.
• An algorithm based on discrete wavelet transforms and was developed to train the neurons in order to respond to the stimuli extracted from the amputated limb using the myoelectric signal (MES) extracted using piezo electric sensors
• Matlab was used to implement the 3 layer Neural network and the Neural network was trained using the Levenberg-Marquardt (LM) Algorithm for classification of the signals.
• The classified signal was then transmitted to a Micro controller to control the movement of the limb, servo motors were used to control the positioning of the limb to great accuracy.
• The design was implemented minimizing the weight to a great extent with great amount of flexibility and control.
• Its main application is for the amputes to live a natural life.
releaseMyAd is the best online portal for advertisement.You can easily book your Ads in different TV Channels such as CNN-IBN, NewsX, NDTV Profit Prime, Bloomberg TV, DD News, ET Now etc at the lowest rates via releaseMyAd.
Founder: Ferruccio Lamborghini
Founded: Sant'Agata, Italy
President: Stephan Winkelmann (2005 - Present)
Lamborghini's 831 employees produced 1,711 vehicles per year
“The geological structures in the Bight basin and the possibility of petroleum” school exercise which I made in a group. This was one of our class subject.
Document is published in English, I hope the readers will get some effective information
Journal Petroleum Geology. Northern and Central North Sea Aptian sands, lowstand systems tract. Sequence stratigraphy development, Logs and micropapaeontology. prospectivity
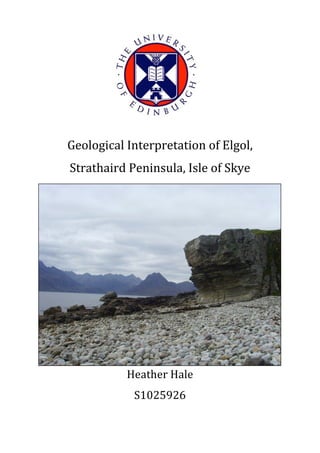
1.
Geological
Interpretation
of
Elgol,
Strathaird
Peninsula,
Isle
of
Skye
Heather
Hale
S1025926
2. 1
Table
of
Contents
1. Abstract
2
2. Introduction
3
3. Description
of
the
Mapped
Lithological
Units
8
3.01 Bearreraig
Sandstone
Formation
8
3.02 Cullaidh
Shale
Formation
11
3.03 Elgol
Sandstone
Formation
11
3.04 Lealt
Shale
Formation
13
3.05 Valtos
Sandstone
Formation
14
3.06 Duntlum
Formation
16
3.07 Kilmaluag
Formation
17
3.08 Basalt
Lava
Flows
18
3.09 Intrusive
Sill
20
3.10 Dykes
20
3.11 Superficial
Deposits
23
4. Structure
of
the
Area
24
4.01 Structure
Contours
24
4.02 Thicknesses
of
Units
27
4.03 Implied
Sequence
of
Deformation
Events
33
5. Interpretation
of
the
Overall
Geological
Evolution
of
the
Area
35
5.01
Bearreraig
Sandstone
Formation
36
5.02
Cullaidh
Shale
Formation
37
5.03
Elgol
Sandstone
Formation
37
5.04
Lealt
Shale
Formation
39
5.05
Valtos
Sandstone
Formation
40
5.06
Duntlum
and
Kilmaluag
Formation
40
5.07
Igneous
Evolution
During
the
Paleogene
40
6. Conclusions
42
7. Acknowledgements
44
8. Management
Statement
45
9. Appendices
46
10.
Bibliography
47
3. 2
1.
Abstract
The
Geology
of
Elgol,
situated
in
the
South
of
the
Strathaird
Peninsula,
displays
a
conformable
sequence
of
the
Great
Estuarine
Group,
with
the
Bearreraig
Sandstone
Formation
deposited
stratigraphically
below,
deposited
in
the
Jurassic
Period.
The
Bearreraig,
Elgol
and
Valtos
Sandstone
Formations
display
coarsening
upwards
sequences
separated
by
units
composed
of
finer
grained
shales
and
mudstones.
The
coarsening
upwards
sequences
are
typical
of
deposition
within
a
deltaic
environment,
with
sea
level
rising
in
between
deposition
of
the
sandstone
units,
engulfing
the
delta,
depositing
shales
and
mudstones.
During
the
Paleogene,
the
area
was
subjected
to
an
intense
period
of
igneous
activity,
which
was
observed
in
the
mapping
area
by
the
presence
of
basalt
lava
flows
as
well
as
a
basic
sill,
observed
at
two
localities,
and
dykes
penetrating
the
area.
The
unconformity
between
the
top
of
the
Great
Estuarine
Group
and
the
Paleogene
igneous
activity
represents
either
a
period
of
erosion
or
ceased
deposition.
Due
to
a
lack
of
observed
contacts
inland,
extensive
work
was
done
with
structural
contours
in
order
to
infer
boundaries
between
units.
4. 3
2.
Introduction
The
Strathaird
Peninsula
outcrops
in
the
South
West
of
the
Isle
of
Skye
displaying
units
from
the
Great
Esturine
Group
and
the
Bearreraig
Sandstone
Formation
(Figure
1).
The
mapping
area
focused
on
the
South
of
the
peninsula
around
the
small
town
of
Elgol
and
consisted
of
around
13km2.
Five
weeks
were
spent
on
the
Isle
of
Skye
in
June
2013,
undertaking
fieldwork
in
order
to
create
a
geological
map
of
the
area,
with
a
total
of
29
days
spent
in
the
field.
The
Isle
of
Skye
contains
rocks
of
a
range
of
ages
from
the
Precambrian
to
present
day.
The
units
observed
within
the
mapping
area
were
deposited
during
232
8
J. P. HARRIS AND J. D. HUDSON
3 A 5 6 7
G -
Rubha Hunish
THE Duntulm
MINCH jROTTERNISH
WATERNISH
Loch Bay
GREAT ESTUARINE
GROUP OUTCROPS
DUIRINISH
Neist Point
Waterstem Head
SEA OF THE
HEBRIDES
Kms
10 20 30
FIG. 1. Location Map, Great Estuarine Group outcrop in black.
and at the same time to define type sections and revise the nomenclature according to
the guidelines of Holland et al. (1978).
A revision of the existing stratigraphical nomenclature (Anderson 1948; Anderson
1963; Hudson 1962) is also appropriate because it includes a number of indistinctive
names and stratigraphical inconsistencies (Fig. 2). The White Sandstone varies from
white to dark brown while maintaining other more important characteristics. The
term 'Series' in Concretionary Sandstone Series as originally defined by Anderson
(1948) is inappropriate as it forms a part of the Great Estuarine Series; also the
name 'Concretionary' is not distinctive because concretions occur in most of the
2013
at University of Edinburgh on November 22,http://sjg.lyellcollection.org/Downloaded from
Figure
1:
The
location
of
the
Strathaird
Peninsula,
underlined
in
red,
and
the
locations
of
the
Great
Estuarine
Group
outcrops
(Harris
and
Hudson,
1980).
5. 4
the
Jurassic,
as
deciphered
from
belemnite
fossils
discovered
within
the
oldest
unit
in
the
area
–
the
Bearreraig
Sandstone.
During
this
period
in
the
geological
record,
sea
levels
were
fluctuating
depositing
siliciclastic
sediment
at
times
of
low
sea
level
and
shales
and
muds
at
times
of
high
sea
level.
The
beginning
of
the
Paleogene
period
is
believed
to
be
the
most
extensive
volcanic
period
throughout
geological
history
in
North
West
Europe
(Stephenson
and
Merritt,
2006).
Movements
of
Earth’s
tectonic
plates
began
to
cause
rifting
of
the
crust,
splitting
Europe
from
North
America,
forcing
the
North
Atlantic
Ocean
open.
The
formations
of
the
rift
lead
to
vast
fractures
being
created
in
the
crust
allowing
magma
to
rise
up
and
erupt
(Johnstone
and
Mykura,
1989).
Evidence
of
this
intense
volcanic
activity
was
observed
within
the
mapping
area
by
the
presence
of
basalt
lava
flows,
sills
and
dykes.
The
mapping
area
contained
a
conformable
sequence
of
the
Great
Estuarine
Group
(Figure
2),
which
has
been
extensively
studied
in
the
past
particularly
by
J.P.
Harris
and
J.D.
Hudson
(Harris,
1980;
1984;
1992;
Hudson,
1980;
1987).
The
vertical
succession
shown
in
figure
2
displays
three
distinct
coarsening
upwards
sequences,
separated
by
units
of
thin,
fissile
shale.
The
group
is
conformably
situated
amid
the
marine
Jurassic
succession
present
within
the
Minch
Basin
located
offshore
of
North
Western
Scotland
(Harris
and
Hudson,
1980)
and
has
vast
lateral
continuity
outcropping
on
the
islands
of
Skye,
Raasay,
Eigg
and
Muck
conformably
overlying
the
Bearreraig
Formation.
On
the
Strathaird
Peninsula,
the
Great
Estuarine
Group
is
unconformably
overlain
by
basalt
lava
flows
erupted
during
the
Paleogene.
The
main
objectives
to
be
completed
during
the
fieldwork
were
to
cover
and
map
the
south
of
the
Strathaird
Peninsula
accurately.
Enough
data
had
to
be
collected
to
be
able
to
interpret
the
geological
evolution
of
the
area
on
completion
of
the
map.
This
included
taking
copious
dip
angles
and
dip
directions
on
as
many
exposures
as
possible
and
collecting
samples,
of
which,
thin
sections
would
be
made
of
the
most
interesting
and
important.
Special
attention
would
be
paid
to
the
topography
to
see
if
it
could
provide
information
6. 5
or
clues
on
where
contacts
would
be.
The
final
aim
was
to
improve
on
fieldwork
skills
–
most
importantly
keeping
a
clear,
precise
notebook
and
generating
detailed
descriptions
–
and
to
learn,
building
on
my
geological
knowledge.
The
main
methods
used
to
complete
the
objectives
were
to
use
1:10,000
A4
base
maps
to
record
data
and
to
use
a
compass
clinometer
to
complete
structural
measurements.
Sketches
and
photographs
were
taken
at
key
localities
to
enhance
descriptions.
Samples
were
taken
at
most
localities,
as
they
were
useful
to
look
back
on
if
needed.
Thin
sections
were
chosen
for
areas
of
interest
in
order
to
determine
precise
mineralogy.
Figure
3
is
a
rock
relation
diagram
drawn
of
the
mapping
area.
The
conformable
sequence
of
the
Great
Estuarine
Group
is
shown
and
the
relationships
between
the
Paleogene
lava
flows,
dykes
and
intrusions
throughout
the
area.
The
sediments
of
the
area
are
interpreted
to
have
been
deposited
by
deltas
into
the
Hebrides
basin
as
concluded
by
the
coarsening
upwards
sequences
displayed
in
the
Bearreraig,
Elgol
and
Valtos
Sandstone
formations.
Shale
divisions
that
were
deposited
during
a
time
of
rising
sea
level,
engulfing
the
delta,
separate
these
units.
After
deposition,
the
area
was
subjected
to
a
period
of
erosion
before
being
exposed
to
Paleogene
igneous
activity
creating
an
unconformity
between
the
observed
top
of
the
Great
Estuarine
Group
and
the
lava
flows.
7. 6
Beds
composed
of
mudstones,
siltstones,
shales
and
sandstones.
Highly
compacted
oyster
beds
inter-‐bedded
within
sandstone
and
limestone.
Coarsening
upwards
sandstone
unit.
Protruding
quartz
grains
and
fossil
Neomiodon
bivalves
dominate.
Dark,
finely
bedded,
fissile
shale
inter-‐
bedded
with
siltstone.
Coarsening
upwards
sandstone
unit
deposited
in
a
deltaic
environment.
No
fossil
faunas
or
terrestrial
material
present.
Finely
bedded,
fissile
shale
unit.
Organic
material
present.
Coarsening
upwards
sandstone
unit
deposited
in
a
shallow
deltaic
environment.
Fossil
belemnites
present.
Deposited
unconformably
over
the
Great
Estuarine
Group.
Figure
2:
Vertical
Succession
of
the
Great
Estuarine
Group
with
a
review
of
the
main
geological
formations.
8. 7
Figure
3:
Rock
relation
diagram
of
the
South
of
the
Strathaird
Peninsula
9. 8
3.
Descriptions
of
the
Mapped
Lithological
Units
3.01
Bearreraig
Sandstone
The
stratigraphically
oldest
rock
observed
in
the
mapping
area
was
the
Bearreraig
Sandstone
Formation,
also
known
as
the
Druim
An
Fhurain
Sandstone,
which
was
deposited
during
the
Bajocan
stage
of
the
Middle
Jurassic
as
deciphered
from
belemnite
fossils
(Harris
and
Hudson,
1980).
The
unit
covers
a
large
area
in
the
southeast
of
the
Strathaird
Peninsula
and
is
presumed
to
be
the
thickest
unit
observed,
although
the
base
was
not
seen.
Excellent
cliff
exposures
of
the
unit
can
be
observed
along
the
south
and
east
coastline
of
the
mapping
area.
Table
1
describes
key
localities
and
interesting
observations
of
the
unit.
Sandstone
was
the
only
lithology
present.
The
unit
was
also
mapped
inland
as
mainly
scattered,
low
gradient
outcrops,
exposing
flat-‐topped
beds.
Coastal
localities
72
and
91
(Figure
4)
contained
cliff
sections
varying
from
15
–
20m
in
height.
Beds
from
both
localities
varied
in
thickness
from
about
10cm
-‐
2m
and
were
defined
on
varying
grain
size.
Beds
were
poorly
sorted
and
graded
upwards
from
a
fine
to
coarse
grain
size.
Planar
cross
bedding
was
present
until
the
top
3m
where
trough
cross
bedding
became
dominant.
Beds
were
quartz
Key
Localities
Grid
Reference
Notebook
Pages
Coastal
or
Inland
Lithology
Grain
Size
Interesting
Observations
72
5465
1440
105-‐108
Coastal
Sandstone
Fine
to
coarse
Cliff
sections
displaying
large
cross
bedding.
91
5314
1170
122-‐126
Coastal
Sandstone
Fine
to
coarse
Fossil
belemnites.
Highly
compacted
together.
45
5272
1302
80-‐81
Inland
Sandstone
Medium
grained
Flute
marks.
Cross
laminations
Table
1:
Key
localities
and
interesting
observations
of
the
Bearreraig
Sandstone.
10. 9
dominated
with
occasional
few
mm-‐sized
pebbles
present.
Thin
laminations
could
be
observed
within
the
beds,
defined
by
a
different
colour.
Fossil
belemnites
(Figure
5)
were
observed,
as
well
as
bivalve
shells
and
burrows.
Moving
further
inland
to
higher
elevations
the
presence
of
pebbles,
clasts
and
marine
material
vanishes.
Beds
are
well
sorted,
mainly
medium
grained
and
predominantly
quartz
dominated.
Flue
marks
become
apparent
on
low
gradient
outcrops
showing
the
top
sections
of
beds
(Figure
6).
The
flute
marks
vary
in
orientation
and
are
not
aligned
in
a
uniform
way.
Fractures
become
less
frequent
at
higher
elevations
and
no
internal
deformation
is
present.
Exposures
were
visibly
porous
and
the
appearance
of
concentric
circles
with
no
ripple
marks
become
apparent,
interpreted
as
burrows.
Figure
4:
Bearreraig
Sandstone
observed
at
locality
91
(GR
5314
1170)
showing
cross
bedding.
11. 10
Figure
5:
Fossil
Belemnites
observed
at
locality
91
(GR
5314
1170).
Figure
6:
Bearreraig
Sandstone
observed
inland
at
locality
65
(GR
541
147)
showing
flute
marks
created
at
shallow
depths
within
the
delta.
12. 11
3.02
Cullaidh
Shale
The
Cullaidh
Shale
Formation
was
the
next
continuous
unit
observed
in
the
mapping
area
and
lies
stratigraphically
above
the
Bearreraig
Sandstone.
It
was
a
thin
unit
and
only
observed
at
a
few
roadside
localities
including
7,
9
and
73.
The
unit
was
not
drawn
as
continuous
across
the
mapping
area
as
it
was
not
observed
from
GR
522
136
to
GR
536
150.
The
unit
consisted
of
black,
finely
bedded
-‐
1mm
size
-‐
fissile
outcrops.
Beds
were
smooth
to
the
touch,
fine
grained
and
contained
no
internal
structure.
Under
the
hand
lens,
bright
mica
and
organic
material,
possibly
the
prints
of
leaves,
were
observed.
At
locality
9,
(p21
of
notebook),
a
gradational
contact
could
be
observed
between
the
shale
unit
and
the
Elgol
Sandstone
Formation
above.
The
sandstone
was
clearly
a
separate
unit
as
it
was
light
grey
in
colour
with
thicker
bedding
than
the
shale.
3.03
Elgol
Sandstone
The
Elgol
Sandstone
Formation
was
very
distinctive
throughout
the
mapping
area
and
displayed
a
coarsening
upwards
sequence.
The
best
localities
to
see
a
clear
section
of
the
entire
unit
were
1,
2
and
3
observed
at
the
coast
on
day
one,
which
are
described
extensively
from
pages
1-‐7
in
the
notebook.
Beds
were
grey
in
colour
and
varied
in
thickness
from
10cm
to
1m
with
grain
size
coarsening
upwards.
Grains
appeared
subangular
and
dominantly
quartz.
Laminations
were
present
within
the
beds,
defined
by
different
colours.
Beds
were
rough
in
texture
and
contained
no
evidence
of
terrestrial
or
marine
material
such
as
shell
fragments
or
plant
material.
Moving
upwards,
the
cliff
beds
become
dominated
by
planer
and
trough
cross
bedding
(Figure
7).
Beds
increased
in
grain
size,
become
well
sorted
and
well
cemented
together.
13. 12
Inland,
the
Elgol
Sandstone
exposed
flat-‐topped
beds
at
the
top
of
the
succession,
similar
to
the
Bearreraig
Sandstone.
Outcrops
were
consistently
grey
in
colour,
bedded,
with
planar
surfaces
as
observed
at
the
coast.
Lower
sections
inland
did
not
have
cross
bedding
or
planar
laminations
present,
however
uppermost
sections
contained
cross
lamination.
Beds
continued
to
be
quartz
dominated
with
no
evidence
for
marine
or
terrestrial
material
throughout
the
unit.
In
the
East
of
the
mapping
area,
exposures
became
increasingly
scattered
and
thinner.
Flow
lines,
similar
to
what
would
be
observed
on
a
sandy
beach,
were
present
on
these
surfaces
defined
by
thin
layers
of
different
colour
and
grain
size.
Figure
26,
p38,
displays
a
log
of
the
Elgol
Sandstone
taken
from
the
shoreline,
combining
localities
1,
2
and
3.
The
log
displays
a
coarsening
upwards
sequence.
Figure
7:
Truncated
trough
cross
bedding
shown
in
the
top
3m
of
the
Elgol
Sandstone
Formation.
14. 13
3.04
Lealt
Shale
The
Lealt
Shale
Formation
was
observed
in
only
a
few
localities
as
small
outcrops.
On
the
coast
it
was
seen
as
black,
shallowly
dipping
shale
(Figure
8).
It
was
defined
as
a
separate
unit
as
it
looked
entirely
different
to
the
Elgol
Sandstone.
Exposures
were
smooth,
fine
grained,
crumbly
and
very
easy
to
break
apart.
Mica
specs
were
present
in
hand
specimen.
On
the
coast,
at
locality
four,
the
shale
units
were
inter-‐bedded
with
siltstone.
Siltstone
beds
were
thicker,
orange
to
brown
in
colour
and
more
resistant.
There
were
approximately
3
repetitions
observed
between
shale
and
siltstone.
At
locality
79,
GR
5163
143,
a
boundary
was
present
between
the
Lealt
Shale
and
Valtos
Sandstone.
A
clear
contact
could
not
be
seen
due
to
the
presence
of
dykes
penetrating
the
area.
Figure
8:
Photograph
taken
of
locality
four,
GR
5172
1400,
showing
shallowly
dipping
shale
interbedded
with
siltstone.
50cm
15. 14
Inland,
the
Lealt
shale
was
observed
as
seen
on
the
coast
–
small
outcrops
of
black,
fine
grained,
very
finely
bedded,
smooth,
fissile
shale.
Sections
were
also
observed
inland
with
inter-‐bedded
beds
of
a
smooth,
fine
grained
siltstone
within
the
shale.
3.05
Valtos
Sandstone
The
Valtos
Sandstone
Formation
was
distinctive
throughout
the
mapping
area
due
to
the
presence
of
protruding
quartz
grains
and
outlines
of
Neomiodon
bivalves
(Figure
9).
The
Neomiodon
bivalves
were
distinctive
and
what
defined
the
unit
as
the
Valtos
Sandstone.
Beds
were
fairly
homogenous
throughout
the
mapping
area,
containing
protruding
quartz
grains,
3mm-‐7mm
in
diameter,
and
the
presence
of
Neomiodon
bivalves
at
every
locality.
Beds
had
a
rough
texture
and
contained
laminations.
Compaction
of
Neomiodon
bivalves
varied
between
beds.
The
main
Figure
9:
Neomiodon
bivalve
shell
outlines
and
protruding
Quartz
grains.
16. 15
lithology
was
sandstone
inter-‐bedded
with
limestone.
Desiccation
cracks
were
observed
along
the
coast
at
GR
5164
1442.
At
Glen
Scaladal,
GR
5203
1620,
cliff
sections
10m
in
height
were
observed.
Beds
were
planar
and
continuous
with
thicknesses
varying
from
20cm
to
2m.
Some
beds
were
more
resistant
to
erosion
than
others.
Top
surfaces
of
various
beds
were
somewhat
nodular,
possibly
interpreted
as
burrows.
Various
sizes
of
quartz
grains
could
be
seen
from
a
few
millimetres
to
a
centimetre
in
size
and
frequency
varied
from
5%
to
20%.
Inland,
the
Valtos
Sandstone
tended
to
display
‘stepped’
outcrops
protruding
from
the
landscape
creating
an
extending
ridge
(Figure
10).
Exposures
were
dark
grey,
bedded,
contained
quartz
grains
and
shell
outlines.
Grain
sizes
varied
from
fine
to
coarse.
Although
often
weathered,
fresh
surfaces
exposed
shell
outlines
and
they
were
often
very
compact.
Quartz
grains
were
seen
up
to
4mm
in
diameter,
with
beds
at
locality
18
being
dominated
20%
by
protruding
quartz
grains.
Figure
10:
Stepped
Valtos
outcrop
observed
inland.
2m
17. 16
3.06
Duntlum
Formation
The
Duntlum
Formation
was
observed
mainly
inland
at
a
few,
fairly
small
outcrops.
Exposures
were
principally
light
grey
in
colour
and
fine-‐grained,
with
layers
dominated
by
large,
dark,
rough
oyster
shells
(Figure
11).
These
shell
layers
were
densely
packed
and
protruded
from
the
exposure.
They
were
very
rough,
spikey,
sharp
and
easily
identifiable
in
the
field.
These
densely
packed
oyster
beds
had
not
been
observed
in
any
other
unit.
On
the
coast,
the
unit
was
distinguished
as
a
separate
unit
from
the
Valtos
Sandstone
as
there
were
no
protruding
quartz
grains;
instead
the
distinctive
oyster
beds
became
present
inter-‐bedded
with
mainly
limestone
beds
and
a
few
sandstone
beds
as
observed
at
the
coast.
Beds
varied
in
thickness
from
a
few
centimetres
to
1
½m.
The
paler,
limestone
layers
were
fine
grained
and
eroded
more
than
the
shell
layers
which
were
resistant
to
erosion
and
periodically
observed
as
knick
points
in
river
beds.
Occasionally,
this
erosion
created
holes
Figure
11:
Duntlum
Formation
seen
at
locality
with
basalt
lava
flows
in
the
background.
Oyster
shells
dominate
dark
layers
within
the
outcrop.
18. 17
and
columns
within
the
rock,
which
had
a
similar
appearance
of
honeycomb
weathering.
3.07
Kilmaluag
Formation
The
Kilmaluag
Formation
was
characterised
by
mudstones,
siltsones,
shales
and
sandstones
(Figure
12).
On
the
coast
exposures
were
light
in
colour
however
varied
between
cream,
brown
and
black
across
the
mapping
area.
Finely
bedded,
fine
grained,
continuous
beds
with
easily
breakable
shale
were
often
observed
with
fine
laminations
present
within
beds.
Inland,
exposures
become
smaller
and
dominated
by
damp
mudstones
(Figure
13),
occasionally
inter-‐bedded
with
more
resistant
siltstones
or
sandstone
beds.
Beds
continued
to
be
finely
bedded
and
fairly
continuous
although
chaotic
bedding
planes
were
observed
at
a
few
localities
such
as
locality
23,
GR
5267
1471.
The
colour
of
the
sediments
became
darker
inland
to
brown
and
black.
Bivalve
shells,
laminations
and
flow
lines
were
observed
at
locality
61,
GR
5231
1478,
within
a
sandstone
bed.
Surfaces
of
beds
were
smooth
to
the
touch
and
did
not
crumble,
but
were
easily
snapped.
Figure
12:
Kilmaluag
Formation
seen
at
the
coast.
Locality
41,
GR
5190
1540.
4m
19. 18
3.08
Basalt
Lava
Flows
Distinctive
igneous
cliffs
could
be
observed
throughout
the
mapping
area
(Figure
14).
Cliff
faces
were
generally
20m
high,
highly
weathered
with
rough
bedding
structures
forming
rectangular
structures
and
blocks.
The
cliffs
could
be
traced
around
the
hillside
as
they
were
prominent.
Frequent,
resistant,
vertical
dykes
penetrated
the
cliffs
orientated
northwest
southeast.
Outcrops
were
generally
rough
in
texture
and
contained
fine-‐grained
angular
olivine
crystals
a
few
millimetres
wide
with
no
favourable
orientation.
On
top
of
Ben
Meabost
and
Ben
Cleat,
the
two
areas
of
highest
elevation,
exposures
were
flat
and
patchy.
Scour
marks
created
during
glaciation
could
be
observed
(Figure
15).
Exposures
were
fractured
and
contained
eroded
ridges.
Petrographic
analysis
was
done
on
locality
14,
GR
5392
1572
(Figure
16),
to
observe
the
mineralogy.
Olivine
minerals
contained
thick,
dark
rims
possibly
indicating
an
alteration
to
serpentine.
Glass
was
present
as
groundmass,
indicative
of
rapid
cooling.
Figure
13:
Kilmaluag
Formation
observed
inland
at
locality
94,
GR
5215
1453.
20. 19
Figure
14:
Basalt
lava
flows.
Can
see
vertical
dykes
penetrating
through.
7m
Figure
15:
Scour
marks
from
glaciation.
21. 20
3.09
Intrusive
Sill
Two
intrusive
outcrops
were
present
in
the
area,
interpreted
as
having
originated
from
the
same
event.
They
were
inferred
as
intrusions,
rather
than
basalt
flows
as
they
had
different
compositions
and
were
at
lower
elevations
than
the
basalt
cliffs.
Intrusions
were
located
on
top
of
the
Kilmaluag
Formation
around
GR
520
144,
and
south
of
the
Cullaidh
Shale
Formation
at
GR
520
132.
Both
intrusions
were
generally
orange
in
colour
and
highly
weathered.
Grains
were
poorly
sorted
and
size
varied
from
medium
to
coarse.
The
southern
intrusion
could
be
easily
traced
due
to
protruding
outcrops
however
the
northern
intrusion
boundary
had
to
be
inferred.
Petrographic
analysis
done
on
both
intrusions
to
observe
if
they
were
of
the
same
composition
(Figures
17
and
18)
and
therefore
from
the
same
event.
Both
intrusions
had
the
same
minerals
present
however
different
grain
size
indicating
one
cooled
faster
than
the
other.
Low
metamorphic
grade
and
alteration
mineral
chlorite
is
present
in
high
quantities
within
both
thin
sections
3.10
Dykes
Igneous
dykes
were
frequent
throughout
the
mapping
area
and
easily
observed
due
to
their
northwest
southeast
orientation
(Figure
19).
Dykes
were
highly
weathered,
orange
to
dark
brown
in
colour
and
cut
through
all
of
the
sedimentary
units
observed
(Figure
20).
They
contained
a
chaotic
structure
with
no
particular
orientation
of
crystals.
Grain
size
varied
from
fine
to
medium
grained
with
dark,
angular
black
pyroxene
crystals
present
at
all
localities.
Contacts
between
the
dykes
and
sandstone
units
were
quite
abrupt.
Fine-‐
grained
dykes
were
basaltic
in
composition,
whereas
medium
grained
dykes
were
doleritic.
22. 21
Figure
16:
Petrographic
analysis
of
Locality
14
–
Basalt
lava
flows
containing
olivine,
pyroxene,
plagioclase,
magnetite
and
glass.
Figure
17:
Locality
32
from
northern
intrusion
containing
pyroxene,
plagioclase,
iron
oxides
and
alteration
mineral,
chlorite.
Bigger
crystals
than
locality
38
as
the
intrusion
had
a
longer
time
to
cool.
23. 22
Figure
19:
Rose
diagram
displaying
the
general
orientation
of
dykes
observed
in
the
area.
16
dykes
were
inputted.
Page
27
of
notebook
shows
a
sketch
of
the
dykes
cutting
through
the
basalt
cliffs.
Figure
18:
Locality
38
-‐
igneous
intrusion
with
smaller
crystals
as
the
cooing
period
was
short.
Minerals
present
are
pyroxene,
plagioclase,
iron
oxides
and
alteration
mineral,
chlorite.
24. 23
3.11
Superficial
Deposits
The
base
of
the
Cullaidh
Shale
Formation
and
the
top
of
the
Bearreraig
Sandstone
Formation
was
difficult
to
observe
due
a
large
proportion
of
the
south
east
of
the
mapping
area
being
covered
in
peat.
Cut
out
sections
were
observed
in
the
landscape,
presumably
to
be
dried
and
subsequently
used
as
fuel.
The
presence
of
peat
was
an
indication
the
soil
was
acidic
and
low
in
nutrients.
Alluvium
deposits
were
observed
throughout
the
area
at
the
base
of
streams.
Sand
and
rocks
eroded
from
the
hillsides
were
deposited
in
these
areas.
In
areas
with
no
exposure,
such
as
the
flat
land
at
535
145,
and
526
143,
the
land
was
characterised
by
upland
bog
and
marsh.
Figure
20:
Dyke
from
the
coast.
Contact
between
sandstone
and
dyke
is
quite
abrupt.
1m
25. 24
4.
The
Structure
of
the
Area
The
structure
of
the
mapping
area
is
not
geologically
complex.
The
area
has
no
major
faults
or
folds
offsetting
the
lithological
units.
The
conformable
Great
Estuarine
Group
generally
has
a
similar
dip
direction
averaging
approximately
321°
indicating
no
major
anticlines
or
synclines
within
the
area.
4.01
Structure
Contours
Due
to
the
lack
of
contacts
observed
inland,
extensive
work
was
done
using
structure
contours
to
predict
where
the
boundaries
between
units
would
be
in
relation
to
observed
outcrops.
Work
with
structure
contours
was
initially
done
using
observed
dip
angle
and
dip
directions
from
the
field.
However
the
dip
angle
within
units
tended
to
vary
too
much
to
give
a
suitable
average
and
the
dip
direction
also
varied.
These
recordings
were
not
creating
acceptable
boundaries
that
would
fit
my
observed
outcrops
seen
in
the
field.
Therefore,
practice
was
done
varying
the
dip
angle
and
dip
direction
of
the
sediments
in
order
to
match
observed
outcrops
with
suitable
boundaries
(see
Appendix
1).
The
dip
and
dip
directions
between
units
were
kept
constant
in
the
same
area,
however
the
dip
direction
was
offset
at
a
small
number
of
localities
across
the
mapping
area.
No
major
faults
were
observed
to
account
for
this
offset;
therefore
it
is
concluded
to
have
been
caused
by
minor
folding.
Naturally,
assumptions
had
to
be
made
when
working
out
the
structure
of
the
area.
Structural
contours
were
not
drawn
for
either
of
the
two
igneous
intrusions
at
GR
520
144
and
GR
520
132,
as
the
boundary
could
be
clearly
traced
around
the
southern
intrusion
and
there
was
no
dip
angle
or
dip
direction
taken
to
calculate
structure
contours
for
the
northern
boundary.
The
best
contacts
observed
between
lithological
units
were
at
coastal
localities
(Figure
21a).
Here,
structural
contours
could
be
drawn
between
the
Lealt
Shale,
Valtos,
Duntlum
and
Kilmaluag
Formations.
The
dip
direction
used
was
310°
and
a
dip
angle
of
12.5°.
The
contacts
were
within
170m
from
each
other
and
created
26. 25
very
thin
boundaries
curving
around
the
cliff
sections.
The
same
dip
angle
and
dip
direction
was
used
at
the
contact
between
the
Lealt
Shale
and
Elgol
Sandstone
to
infer
the
top
of
the
sandstone
boundary.
It
was
slightly
harder
to
define
the
boundary
between
the
Cullaidh
Shale
and
Elgol
Sandstone
due
to
the
presence
of
the
igneous
intrusion,
however
the
occurrence
of
two
shale
localities,
6
and
73,
allowed
structure
contours
to
be
drawn.
The
base
of
the
shale
was
not
observed
at
the
coast.
The
dip
direction
of
the
structural
contours
had
to
change
to
account
for
the
Valtos
Sandstone
outcrops
from
GR
524144
to
529147,
which
were
clearly
defined
in
the
mapping
area
(Figure
21b).
The
dip
direction
changed
to
330°
Figure
21
(a)
Circle
1
shows
the
area
where
coastal
locality
structural
contours
were
drawn
from.
(b)
Circle
2
shows
where
the
dip
direction
had
to
change
to
accommodate
Valtos
outcrops
observed
in
the
field.
(c)
Circle
3
shows
the
area
of
the
next
change
in
dip
direction
and
(d)
Circle
4
shows
the
final
change
of
dip
direction
for
the
sedimentary
units
in
the
area.
(e)
Circle
5
shows
where
the
dip
direction
was
changed
for
the
unconformably
overlying
basalts.
1
5
3
4
2
Ben
Meabost
Ben
Cleat
27. 26
using
the
same
dip
as
previously,
12.5°,
and
fit
well
for
all
of
the
boundaries
in
that
area,
including
the
top
and
base
of
the
Elgol
Sandstone.
Continuing
inland,
the
dip
direction
changed
to
313°
at
GR
5298
1498
to
account
for
the
band
of
Valtos
exposure
that
continued
to
5386
1546
(Figure
21c).
The
structural
contours
used
for
the
top
of
the
Duntlum
Formation
could
not
be
carried
on
from
the
previous
location
of
5287
1479
so
were
inferred
from
the
160m
contour
line,
GR
5338
1531.
The
dip
remained
the
same
for
all
units
at
12.5°.
The
final
change
in
dip
direction
for
the
sedimentary
units
was
to
331°
and
allowed
the
boundaries
to
the
East
of
Ben
Meabost
to
be
inferred
(Figure
21d).
The
base
of
the
Cullaidh
Shale
was
not
seen
so
a
thin
boundary
was
inferred,
similar
to
the
thickness
of
the
coastal
locality.
The
Kilmaluag
Formation
was
pinched
out
at
GR
5409
1643
due
to
the
unconformably
overlying
basalt
lava
flows.
This
locality
was
used
to
draw
structural
contours
for
the
base
of
the
basalt
lava
flows.
The
dip
angle
and
direction
were
kept
the
same
for
the
basalt
flows
around
the
south
of
Ben
Meabost
as
there
were
no
close
contacts
to
use
to
infer
a
different
dip
angle
or
dip
direction
for
the
base
of
the
lava
flows.
However
at
locality
35,
GR
5200
1484,
a
contact
between
the
Kilmaluag
Formation
and
basalt
lava
flows
was
observed.
The
dip
direction
of
310°
was
kept
the
same
around
the
South
of
Ben
Cleat
however
the
dip
direction
changed
to
334°
to
trace
the
base
of
the
flows
around
the
West
side
of
Ben
Cleat
(Figure
21e).
The
dip
angle
was
also
changed
to
8°.
The
difference
in
dip
angles
and
dip
directions
used
on
the
base
of
the
basalt
flows
compared
to
the
sedimentary
units
are
evidence
for
the
unoconformity
between
the
Kilmaluag
Formation.
As
assumptions
were
made,
accuracy
was
reduced:
the
dip
angle
and
dip
direction
carried
on
from
figure
21(a)
created
a
good
fit
inferred
boundary
between
the
observed
igneous
exposure
around
locality
35
however
did
not
work
for
locality
61
with
creates
an
indent
into
the
basalt
formation.
An
obvious
shell
was
seen
at
this
locality
so
it
could
not
have
been
interpreted
as
igneous.
Table
2
summarises
what
dip
angles
and
dip
directions
were
used
at
each
area.
28. 27
Area
Dip
Dip
direction
1
12.5°
310°
2
12.5°
330°
3
12.5°
313°
4
12.5°
331°
5
8°
334°
The
structure
of
the
area
in
Glen
Scaladal
had
to
be
entirely
inferred
and
was
completed
based
on
a
number
of
assumptions.
Valtos
sandstone
was
observed
at
locality
40
from
Glen
Scaladal
as
well
as
the
Kilmaluag
Formation
at
locality
81
and
lava
flows
100
metres
above
sea
level.
Cross
section,
line
two
(Figure
22),
was
drawn
from
locality
40
to
the
Bearreraig
Sandstone
GR
5322
1371.
An
assumption
was
made
that
the
sandstone
observed
in
Glen
Scaladal
was
the
top
of
the
Valtos
sandstone
unit.
Therefore
both
of
the
sandstone
units
could
be
matched
up
across
the
section.
The
thickness
of
the
Duntlum
formation,
stratigraphicaly
above,
was
kept
the
same
width
and
reached
30m
above
sea
level
at
GR
5211
1596.
The
lava
flows
were
also
connected
and
the
rest
of
the
space
was
interpreted
as
the
Kilmaluag
formation.
The
thickness
of
the
Kilmaluag
Formation
varies
across
the
section
because
it
was
eroded
before
the
basalt
flows
were
deposited
unconformably
on
top
at
a
later
date.
4.02
Thicknesses
of
units
As
can
be
perceived
from
the
base
maps
the
thicknesses
of
the
units
vary.
Thicknesses
of
the
units
were
calculated
at
the
coast,
inland
and
from
cross
sections
1
(figure
23),
2
and
3
(Figure
24)
to
understand
the
variation
(Table
3).
Unit
Location
Grid
Reference
Thickness
(m)
Cullaidh
Shale
Coast
5188
1355
to
5191
1358
16.5
Table
2:
Summary
of
which
dip
angles
and
dip
directions
were
used
to
create
structure
contour
boundaries.
29. 28
Elgol
Sandstone
Coast
5172
1397
to
5172
1363
79
Elgol
Sandstone
Inland
5422
1583
to
5432
1580
61.6
Elgol
Sandstone
Cross
Section
Line
3
5391
1540
to
5410
1535
83
Valtos
Sandstone
Cross
Section
Line
2
5274
1462
to
5276
1460
23.7
Valtos
Sandtone
Inland
5415
1579
to
5419
1584
26.5
Valtos
Sandstone
Cross
Section
Line
3
5380
1545
to
5384
1544
16.9
Lealt
Shale
Cross
Section
Line
2
5276
1460
to
5289
1435
86.3
Lealt
Shale
Inland
5418
1580
to5424
1580
35.8
Lealt
Shale
Cross
Section
Line
3
5384
1543
to
5391
1542
30.1
Duntlum
Cross
Section
Line
2
5274
1464
to
5274
1462
5.2
Duntlum
Inland
5411
1578
to
5414
1580
15.4
Duntlum
Glen
Scaladal
5205
1590
to
5211
1590
35
Duntlum
Cross
Section
Line
3
5474
1546
to
5380
1545
18.7
Kilmaluag
Cross
Section
Line
2
5266
1480
to
5274
1463
109
Kilmaluag
Inland
5406
1580
to
5411
1579
35.8
Kilmaluag
Glen
Scaladal
5210
1590
to
5219
1587
83
30. 29
Kilmaulag
Cross
Section
Line
3
5353
1553
to
5474
1546
71
All
of
the
units
are
shown
to
vary
in
thickness
quite
considerably,
indicating
they
were
deposited
in
a
dynamic
undulating
environment
such
as
a
delta,
as
concluded
from
coarsening
upwards
successions.
Some
areas
within
the
mapping
area
are
thicker
because
they
will
have
been
deposited
in
a
deeper
area
such
as
a
lagoon,
whereas
those
that
are
thin
will
have
been
deposited
at
a
higher
elevation
within
the
delta
such
as
the
top
of
a
channel.
The
thickness
of
the
Cullaidh
Shale
Formation
and
Bearreraig
Sandstone
Formation
could
not
be
accurately
constrained
as
a
top
and
lower
contact
was
never
observed.
Table
3:
Thickness
variations
across
the
mapping
area.
33. 32
Implied
Sequence
of
Deformation
Events
Figure
24:
Cross
section
line
three
34. 33
4.03
Implied
Sequence
of
Deformation
Events
Figure
25
displays
the
evolution
of
the
sediment
structure
through
time
and
the
relationships
between
the
Paleogene
igneous
formations.
The
diagram
drawn
is
only
one
interpretation
of
the
evolution
of
the
area.
There
was
not
a
relationship
observed
between
the
intrusion
and
the
basalt
lava
flows,
therefore
it
is
difficult
to
constrain
which
one
came
first.
It
has
also
been
inferred
that
the
intrusion
came
from
the
southeast,
rather
than
the
northeast.
There
is
a
large
unconformity
between
the
top
of
the
Kilmaluag
Formation,
which
was
deposited
during
the
Jurassic,
to
the
basalt
lava
flows
which
were
deposited
at
a
later
time,
in
the
Paleogene.
There
is
no
evidence
of
Cretaceous
sediments,
which
implies
deposition
either
ceased
above
the
Kilmaluag
Formation
or
that
the
period
was
one
of
erosion
in
the
area.
The
Skudiburgh
Formation
deposited
at
the
top
of
the
Great
Estuarine
Group
(Harris
and
Hudson,
1980)
was
not
observed
in
the
mapping
area
so
it
is
likely
it
was
eroded
before
deposition
of
the
basalts.
Initial
tilting
of
the
sediments
occurred
due
to
faulting
taking
place
further
North
of
the
mapping
area
(Trewin,
2002).
Erosion
subsequently
took
place,
of
possible
Cretaceous
sediments
as
well
as
the
Skudiburgh
Formation,
creating
a
flat
surface,
which
the
basalts
then
deposited
on
and
were
tilted
further
due
to
additional
faulting
in
the
North.
Cross
section,
line
one
and
line
two
(Figures
23
and
22),
drawn
to
scale,
show
the
present
landscape
relationships
displaying
the
tilted
sediments
which
were
eroded
before
the
deposition
of
the
lava
flows
and
igneous
intrusion.
35. 34
Figure
25:
Evolution
diagram
for
the
mapping
area.
Number
3
is
the
environment
as
seen
from
cross
section
line
one
and
number
4
is
the
environment
as
seen
from
cross
section
line
two.
36. 35
5.
Interpretation
of
the
overall
geological
evolution
of
the
area
The
different
stratigraphical
sequences
observed
in
the
mapping
area
represent
the
evolutionary
stages
in
the
sedimentary
fill
of
the
Hebridies
Basin
from
the
Middle
to
Late
Jurassic,
with
igneous
activity
affecting
the
area
in
the
Paleogene.
It
has
been
suggested
by
Harris,
1992
that
the
units
observed
within
the
mapping
area
–
the
Bearreraig
Sandstone
and
Great
Estuarine
Group
-‐
were
deposited
in
two
lagoonal
sub
basins
within
the
Hebridies
Basin
separated
by
a
gradually
subsiding
basement
ridge
known
as
the
mid-‐Skye
palaeohigh.
After
the
deposition
of
sediment
during
the
Jurassic,
there
is
a
large
unconformity
between
the
Kilmaluag
Formation
and
the
Paleogene
lava
flows
with
no
evidence
of
depositional
activity
between
the
Jurassic
and
Paleogene.
Observations
from
mapping
the
Strathaird
Peninsula
can
be
taken
to
indicate
units
including
the
Bearreraig,
Elgol
and
Valtos
Formations
were
deposited
in
dynamic,
fluctuating
environments,
whereas
others
were
fairly
homogenous
suggesting
a
calmer
environment
of
deposition.
The
first
order
interpretations
of
the
area
are
that
the
units
were
deposited
in
a
shallow,
fluvial
environment,
which
altered
between
the
different
units.
Evidence
for
coarsening
upwards
sequences
–
classic
of
a
deltaic
environment
–
was
observed
in
the
Bearreraig,
Elgol
and
Valtos
Sandstone
Formations.
Between
the
siliciclastic
phases
of
delta
deposition,
shale
units
were
deposited
consisting
of
fine-‐grained
sands
and
muds.
Literature
suggests
the
mapping
area
was
a
deltaic
environment,
for
which
there
is
evidence
within
notebook
observations.
The
phases
of
shale
deposition
represent
a
time
of
high
sea
level,
allowing
for
the
deposition
of
fine
sands
and
muds
in
units
such
as
the
Cullaidh
Shale
and
Lealt
Shale
Formations.
Sedimentological
Evolution
of
the
Bearreraig
Sandstone
Formation
and
Great
Estuarine
Group
The
interpretation
of
the
overall
geological
evolution
of
the
area
will
be
discussed
from
the
oldest
unit
to
the
youngest.
37. 36
5.01
Bearreraig
Sandstone
Formation
The
Bearreraig
Sandstone
Formation
displays
a
coarsening
upwards
sequence,
which
is
interpreted
to
have
been
deposited
in
a
deltaic
environment,
as
a
delta
is
the
only
environment
that
generates
coarsening
upwards
sequences.
Beds
varying
in
thickness
from
10cm
to
2m
suggest
the
environment
experienced
varying
time
periods
of
deposition,
which
would
concur
with
the
interpretation
that
the
unit
was
deposited
within
a
delta.
Inland
of
the
mapping
area,
flute
marks
were
observed,
indicating
an
environment
of
shallow
deposition,
agreeing
with
Morton’s
(1965)
idea
that
sharp
variations
in
thickness
of
the
unit
imply
near-‐shore
deposition.
Distinctive
planar
and
trough-‐cross
bedding
was
observed,
representing
a
dynamically
active
environment
of
deposition.
There
was
also
evidence
for
large
scale
cross
bedding
indicating
a
tidal
and
or
wave-‐
influenced
environment.
Thin
laminations
observed
within
beds
were
evidence
of
water
movement
within
small
rivers
or
channels.
The
high
volume
of
quartz
sediment
suggests
the
delta
was
dominantly
siliciclastic.
At
this
time
in
the
geological
record,
sea
levels
would
have
been
low,
allowing
for
rivers
to
cut
down
and
deposit
sediment
to
the
delta.
The
Bearreraig
sandstone
is
a
very
thick
unit
so
the
depositional
environment
must
have
been
similar
for
quite
a
long
time.
The
base
of
the
formation
was
not
observed,
therefore
a
thickness
for
the
whole
unit
could
not
be
calculated,
however
Morton,
1965
states
that
the
Bearreraig
Sandstone
Series
reaches
its
maximum
exposed
thickness,
of
approximately
490m,
at
the
southern
end
of
the
Strathaird
Peninsula
and
is
apparently
the
thickest
Bajocian
succession
in
Europe.
Belemnites
were
discovered
at
the
base
of
the
cliff
sections
suggesting
a
marine
environment
of
deposition
however
were
not
observed
higher
up
the
cliff
sections.
The
deltaic
environment
possibly
changed
from
marine
to
freshwater
as
deposition
continued
with
time.
The
presence
of
belemnites
allows
the
unit
to
be
dated
to
the
Mid-‐Jurassic.
38. 37
5.02
Cullaidh
Shale
Formation
The
base
of
the
Cullaidh
Shale
Formation
was
not
observed,
however
it
is
interpreted
as
thin
from
logs
generated
by
Harris
and
Hudson,
1980.
The
formation
was
dark,
fissile
and
easily
eroded.
This
formation
is
constructed
as
being
deposited
during
a
time
of
rising
sea
level,
where
the
ocean
engulfed
the
delta,
depositing
over
an
undulating
surface.
No
exposure
was
observed
from
GR
522
136
to
536
150
indicating
elevated
topography
could
have
prevented
deposition
taking
place,
however
sediment
that
was
observed
at
other
localities
may
have
been
deposited
in
surrounding
depressions.
The
dark,
fissile,
organic-‐rich
nature
of
the
shale
and
lack
of
behtnos
suggests
that
the
environment
was
hostile
and
anoxic
(Trewin,
2002).
There
was
no
evidence
for
tidal
or
fluvial
influence
due
to
the
homogeneous
nature
of
the
unit,
suggesting
a
calm
environment
of
deposition
with
limited
sediment
being
deposited.
5.03
Elgol
Sandstone
Formation
The
Elgol
Sandstone
Formation
displays
a
coarsening
upwards
sequence
typical
of
a
deltaic
environment,
as
seen
in
the
Bearreraig
Sandstone
Formation,
which
is
agreed
in
the
literature
by
Harris
and
Hudson,
1980.
Quartz
dominated
–
siliciclastic
material
-‐
was
supplied
for
deposition
from
inland
continental
areas
to
the
delta.
No
fossil
material
was
observed
in
this
unit
possibly
indicating
an
inhospitable
environment,
however
evidence
was
seen
of
possible
burrow
structures
as
discussed
in
page
5
of
the
notebook.
The
top
of
the
unit
displayed
dynamic
structures
suggesting
large-‐scale
processes
operating.
The
unit
becomes
thinner
inland
suggesting
deposition
was
at
the
edge
of
a
delta
lobe.
Fine
laminations
observed
within
beds
inland
interpret
as
being
deposited
in
a
small
channel
within
the
delta.
39. 38
Logs
taken
from
the
field
show
progression
of
the
delta
(Figure
26).
Towards
the
base
of
the
unit
is
the
progradational
phase,
which
shows
the
growth
of
the
delta
into
the
ocean
through
time.
This
period
is
fairly
calm
and
does
not
show
dynamic
processes.
As
sediment
begins
to
build
up
at
the
distributary
mouth
it,
depositing
finer
material
ocean
ward
and
coarser
sediment
closer
to
the
river
mouth.
The
dynamic
nature
of
the
delta
increases
towards
the
top
of
the
log
as
shallow
water
processes
dominate.
Figure
27
shows
the
morphology
of
a
delta.
Progradational
phase
of
the
delta.
Distal
bar
deposits
Bar
front
deposits
Bar
crest
with
channel
deposits.
Figure
26:
Elgol
Sandstone
log
taken
from
the
coast
at
517
148.
Page
128
of
notebook.
Log
shows
the
evolution
of
a
fluvial
dominated
delta.
40. 39
5.04
Lealt
Shale
Formation
A
sharp
transition
from
grey,
quartz
dominated
Elgol
Sandstone
to
black,
very
fissile
shale
was
observed
in
the
field,
indicating
a
very
fast
period
of
sea
level
rise.
The
unit
was
thick,
with
a
maximum
thickness
of
86m
observed
inland
from
cross
section
two
(Figure
22).
Therefore
the
period
of
shale
deposition
was
quite
extensive
indicating
a
long
period
of
high
sea
level
within
the
Jurassic.
The
end
of
this
period
was
marked
by
the
change
to
a
third
coarsening
upwards-‐sandy
sequence,
the
Valtos
Sandstone
Formation,
interpreted
as
a
time
where
sea
level
began
to
fall.
The
shale
unit
is
understood
to
be
extremely
fissile
due
to
a
high
organic
content
(Pettijohn,
1975).
Figure
27:
Diagram
demonstrating
the
morphology
of
a
delta.
Finer
sediments
will
be
discovered
in
the
prodelta,
coarsening
towards
the
bar
crest
and
distributary
channel
(Trewin,
2002).
41. 40
5.05
Valtos
sandstone
Formation
Fossil
desiccation
cracks
observed
at
the
base
of
the
unit
indicate
the
sediment
of
the
Valtos
Formation,
in
the
aerial
delta
plain,
will
have
been
subjected
to
a
dry
environment.
The
formation
observed
was
dominated
by
siliciclastic
material
containing
abundant
Neomiodon
sparities.
Neomiodon
was
a
only
bivalve
present,
perhaps
suggesting
it
was
an
resourceful
coloniser
of
challenging
environments
due
to
the
dynamic
nature
of
the
delta
(Trewin,
2002).
The
sedimentary
log
on
p129
of
the
field
notebook
demonstrates
a
10m
coarsening
upwards
succession
–
indicative
of
a
deltaic
environment.
5.06
Duntlum
Formation
and
Kilmaluag
Formation
The
Duntlum
and
Kilmaluag
Formations,
together,
represent
a
time
of
rising
sea
level
within
the
delta.
The
Duntlum
Formation
consisted
of
mainly
limestone
and
oyster,
Praeexogyra
hebridica,
(Trewin,
2002)
dominated
beds
whereas,
the
Kilmaluag
Formation
was
characterised
by
mudstones,
siltstones,
shales
and
sandstones.
Oyster
beds
were
not
found
within
the
Kilmaluag
formation
indicating
a
change
in
environment
between
the
two
formations
although
the
sea
level
was
still
high.
This
change
of
environment
could
have
been
to
a
more
freshwater
one
in
which
Praeexogyra
hebridica
may
not
have
been
able
to
survive.
5.07
Igneous
Evolution
During
the
Paleogene
There
is
no
record
of
sedimentological
deposition
within
the
mapping
area
after
the
Late
Jurassic
however;
basalt
flows
were
deposited
unconformably
on
top
of
the
Kilmaluag
Formation
in
the
Paleogene.
The
flows
are
interpreted
as
having
been
deposited
sub
aerially
as
there
is
no
evidence
for
under
water
deposition
such
as
pillow
lavas.
The
unconformity
represents
a
time
period
of
no
deposition
but
with
erosion
taking
place
during
the
Cretaceous.
The
different
dip
angle
of
basalt
deposition
42. 41
suggests
the
units
had
previously
been
tilted
and
eroded
creating
a
flat
surface
before
igneous
deposition.
It
is
unknown
why
deposition
of
the
Great
Estuarine
Group
stopped.
Perhaps
the
delta
altered
its
direction
of
deposition
or
the
land
was
uplifted.
Dykes
were
observed
to
cut
through
all
of
the
sedimentary
units,
lava
flows
and
intrusions.
The
sequences
of
igneous
events
are
therefore
interpreted
as
sedimentary
deposition
followed
by
the
intrusion
of
sills
and
basalt
flows,
which
are
all
cut
by
basic
dykes.
It
is
not
possible
to
interpret
whether
the
intrusions
occurred
before
the
flows
or
vice
versa
as
there
is
no
relationship
between
the
two.
The
two
intrusions
observed
within
the
mapping
area
are
interpreted
as
occurring
from
the
same
event.
Sills
intruded
from
the
southeast
following
the
weaker
shale
layer
(Figure
25).
When
the
dip
angle
began
to
get
steeper
or
the
shale
layer
ran
out,
the
sill
ramped
up
to
a
higher
elevation
–
the
land
surface
–
where
it
deposited,
unconformably,
on
top
of
the
Kimaluag
formation.
Bigger
crystals
were
observed
in
the
northern
intrusion
as
it
had
time
to
cool
slower
than
the
southern
intrusion.
The
intrusion
has
been
interpreted
as
entering
from
the
southeast
as
one
event,
however
this
is
only
one
interpretation.
The
question
must
be
asked
as
to
why
only
a
small
section
of
the
sill
remains
visible
on
the
landscape
at
GR
520
145
and
GR
520
133,
and
why
the
rest
of
the
intrusion
has
been
eroded
away.
The
sill
could
also
have
entered
from
the
northeast,
however
the
steeper
dips
in
the
northeast
could
have
made
it
difficult
for
the
intrusion
to
cut
through
the
stratigraphy.
43. 42
6.
Conclusions
A
conformable
sequence
of
the
Great
Estuarine
Group,
as
well
as
the
Bearreraig
Sandstone
stratigraphically
below,
was
observed
on
the
South
of
the
Strathaird
Peninsula.
The
sequence
could
be
dated
to
the
Mid-‐Jurassic
by
the
presence
of
belemnite
fossils,
which
thrived
during
this
time
of
rising
sea
level
and
warm
seas.
The
Great
Estuarine
Group
displays
evidence
of
deltaic,
fluvial
and
lagoonal
environments
of
deposition.
Environments
were
observed
to
change
between
units
due
to
the
separation
of
coarsening
upwards,
siliciclastic
sediment
by
dark,
fissile
shales.
The
alteration
between
units
was
due
to
varying
sea
levels
during
the
Jurassic.
Low
sea
level
allowed
rivers
to
down
cut
topography,
which
gave
them
the
momentum
to
carry
large
volumes
of
sediment,
supplied
from
high
elevations,
to
be
dispersed
and
deposited
into
the
delta
as
observed
in
the
Bearreraig,
Elgol
and
Valtos
Sandstone
units.
When
sea
level
started
to
progressively
rise,
the
ocean
began
to
engulf
the
delta
depositing
finer
grained
sediment
such
as
silt
and
clays,
which
is
observed
in
the
Cullaidh
and
Lealt
Shale
units,
as
well
as
the
Duntlum
and
Kilmaluag
Formations.
Structural
contours
were
produced
in
order
to
create
boundaries
between
units
that
would
match
field
observations.
A
lack
of
contacts
observed
in
the
field
meant
this
was
obligatory
in
order
to
understand
thicknesses
of
units
and
how
they
varied
over
the
mapping
area.
As
previously
discussed,
the
thicknesses
were
not
constant
due
to
the
undulating
nature
of
the
delta.
Therefore
the
dip
angle
and
dip
directions
taken
in
the
field
were
not
constant
as
they
may
reflect
measurements
of
channels
or
other
structures
within
the
delta.
The
boundaries
created
on
the
final
map
are
those
of
the
‘mega
units’
within
the
Great
Estuarine
Group.
My
conclusions
are
in
agreement
with
those
in
the
literature
that
the
Great
Estuarine
Group
was
deposited
within
the
Hebridies
Basin
as
the
units
can
be
traced
through
numerous
West
coast
islands.
Further
research
undertaken
by
authors
such
as
Hesselbo
and
Coe,
2000
discusses
how
the
salinity
varies
44. 43
between
formations
from
marine
to
non-‐marine.
Without
the
skills
to
interpret
salinity
variations
in
the
field,
conclusions
on
this
could
not
be
made.
After
deposition
of
the
sedimentary
units,
the
area
was
exposed
to
a
period
of
minor
tilting
and
erosion
before
the
area
was
subjected
to
igneous
activity
undertaken
during
the
Paleogene.
Basalt
flows
were
observed
to
unconformably
overly
the
Kilmaluag
Formation
at
a
lower
dip
of
8°
creating
an
unconformity,
with
no
deposition
recorded
during
the
Cretaceous
period.
It
is
unknown
why
deposition
of
the
Great
Estuarine
Group
within
the
delta
ceased
in
the
Late
Jurassic.
The
remnants
of
an
intrusive
sill
were
observed
at
two
locations
within
the
mapping
area.
These
were
interpreted
to
have
originated
from
the
same
event
as
the
intrusion
pushed
through
a
weaker
sill
layer
until
it
could
no
longer
and
therefore
ramped
up
to
a
higher
elevation.
There
is
no
relationship
observed
between
the
flows
and
the
intrusions,
consequently
it
is
not
possible
to
interpret
which
event
occurred
first.
Dykes
orientated
in
a
northwest,
southeast
direction
were
observed
throughout
the
mapping
area,
representing
the
stresses
created
during
a
time
of
plate
re-‐organisation
and
opening
of
the
North
Atlantic
Ocean.
45. 44
7.
Acknowledgements
Thank
you
to:
• Andy
Bell,
lecturer
at
the
University
of
Edinburgh,
for
generating
base
maps.
• Kate
Saunders
for
her
guidance
and
in
depth
discussions.
• To
my
dad,
Nick
Hale,
for
his
patience
and
advice
throughout
the
project.
• The
5th
year
‘dungeon’
regulars
for
their
help
with
ArcMap
and
general
advice
during
the
project.
• Lastly,
thank
you
to
my
Skye
friends
Rebecca
Astbury,
Iain
Brown,
John
Torley
and
Robert
Smith
for
their
motivation
and
companionship
in
Skye.
46. 45
8.
Management
Statement
Before
leaving
Edinburgh,
research
was
done
about
the
area
in
order
to
understand
more
about
the
units
that
were
there.
From
the
research
I
learnt
I
would
be
observing
the
Great
Estuarine
Group.
When
mapping,
the
units
were
given
formation
names.
This
was
done,
as
my
first
locality
was
the
well-‐known,
distinctive
honeycomb
weathering
of
the
Elgol
Sandstone
Formation.
From
there,
when
I
noticed
a
distinct
change
in
lithology
walking
in
a
northerly
direction
I
would
name
it
what
was
stratigraphically
above
the
previous
unit
from
the
literature.
That
meant
that
inland
I
could
match
coastal
observations
and
therefore
give
a
formation
name
from
the
literature.
Mapping
was
undertaken
for
five
weeks
from
the
6th
of
June
to
the
11th
of
July
2013
on
the
Isle
of
Skye.
I
was
accompanied
by
four
other
Edinburgh
University
students
–
Rebecca
Astbury,
Iain
Brown,
John
Torley
and
Robert
Smith.
Accommodation
was
in
Harrapool,
Broadford
at
Rona
View.
Transport
was
by
car
to
and
from
the
mapping
area
and
fieldwork
was
done
independently.
A
further
trip
was
taken
to
Skye
from
the
24th
to
the
25th
of
September
to
collect
more
samples
for
analysis.
47. 46
9.
Appendices
Appendix
One:
Structural
contours
that
fit
the
observed
exposure
mapped
are
shown
clearly
on
the
map.
Practice
was
done
firstly
on
tracing
paper,
changing
the
dip
angle
and
dip
directions
used
in
order
to
find
the
best-‐fit
inferred
contacts,
which
were
drawn
precisely
on
this
map.
48. 47
10.
Bibliography
HARRIS,
J.P.
1984.
Environments
of
Deposition
of
Middle
Jurassic
Sandstones
in
the
Great
Estuarine
Group,
N.
W.
Scotland.
PhD
Thesis,
University
of
Leicester
HARRIS,
J.P.
1992.
Mid-‐Jurassic
lagoonal
delta
systems
in
the
Hebridean
basins:
thickness
and
facies
distribution
patterns
of
potential
reservoir
sandbodies.
Geological
Soceity,
London,
Special
Publications,
62,
111-‐144
HARRIS,
J.P.
&
HUDSON,
J.D.
1980.
Lithostratigraphy
of
the
Great
Estuarine
Group
(Middle
Jurassic),
Inner
Hebridies.
Scottish
Journal
of
Geology,
16,
231-‐250
HESSELBO,
S.P.
&
COE,
A.L.
2000.
Jurassic
sequences
of
the
Hebrides
Basin,
Isle
of
Skye
Scotland
In:
GRAHAM
J.R.
&
RYAN,
A.
(eds)
Field
Trip
Guidebook,
International
Sedimentologists
Association
Meeting,
Dublin.
41-‐58.
University
of
Dublin,
Dublin.
HUDSON,
J.D.
&
ANDREWS,
J.E.
1987.
The
diagenesis
of
the
Great
Estuarine
Group,
Middle
Jurassic,
Inner
Hebrides,
Scotland.
Geological
Society,
London,
Special
Publications,
36,
259-‐276
JOHNSTONE,
G.S.
&
MYKURA
W.
1989.
The
Northern
Highlands
of
Scotland.
British
Geological
Survey.
MORTON,
N.
1965.
The
Bearreraig
Sandstone
Series
(Middle
Jurassic)
of
Skye
and
Raasay.
Scottish
Journal
of
Geology,
2,
189-‐216
STEPHENSON,
D.
&
MERRITT,
J.
2006
Skye:
A
Landscape
Fashioned
by
Geology.
Scottish
National
Heritage.
TREWIN,
N.H.
(ed)
2002.
The
Geology
of
Scotland.
The
Geological
Society,
London.