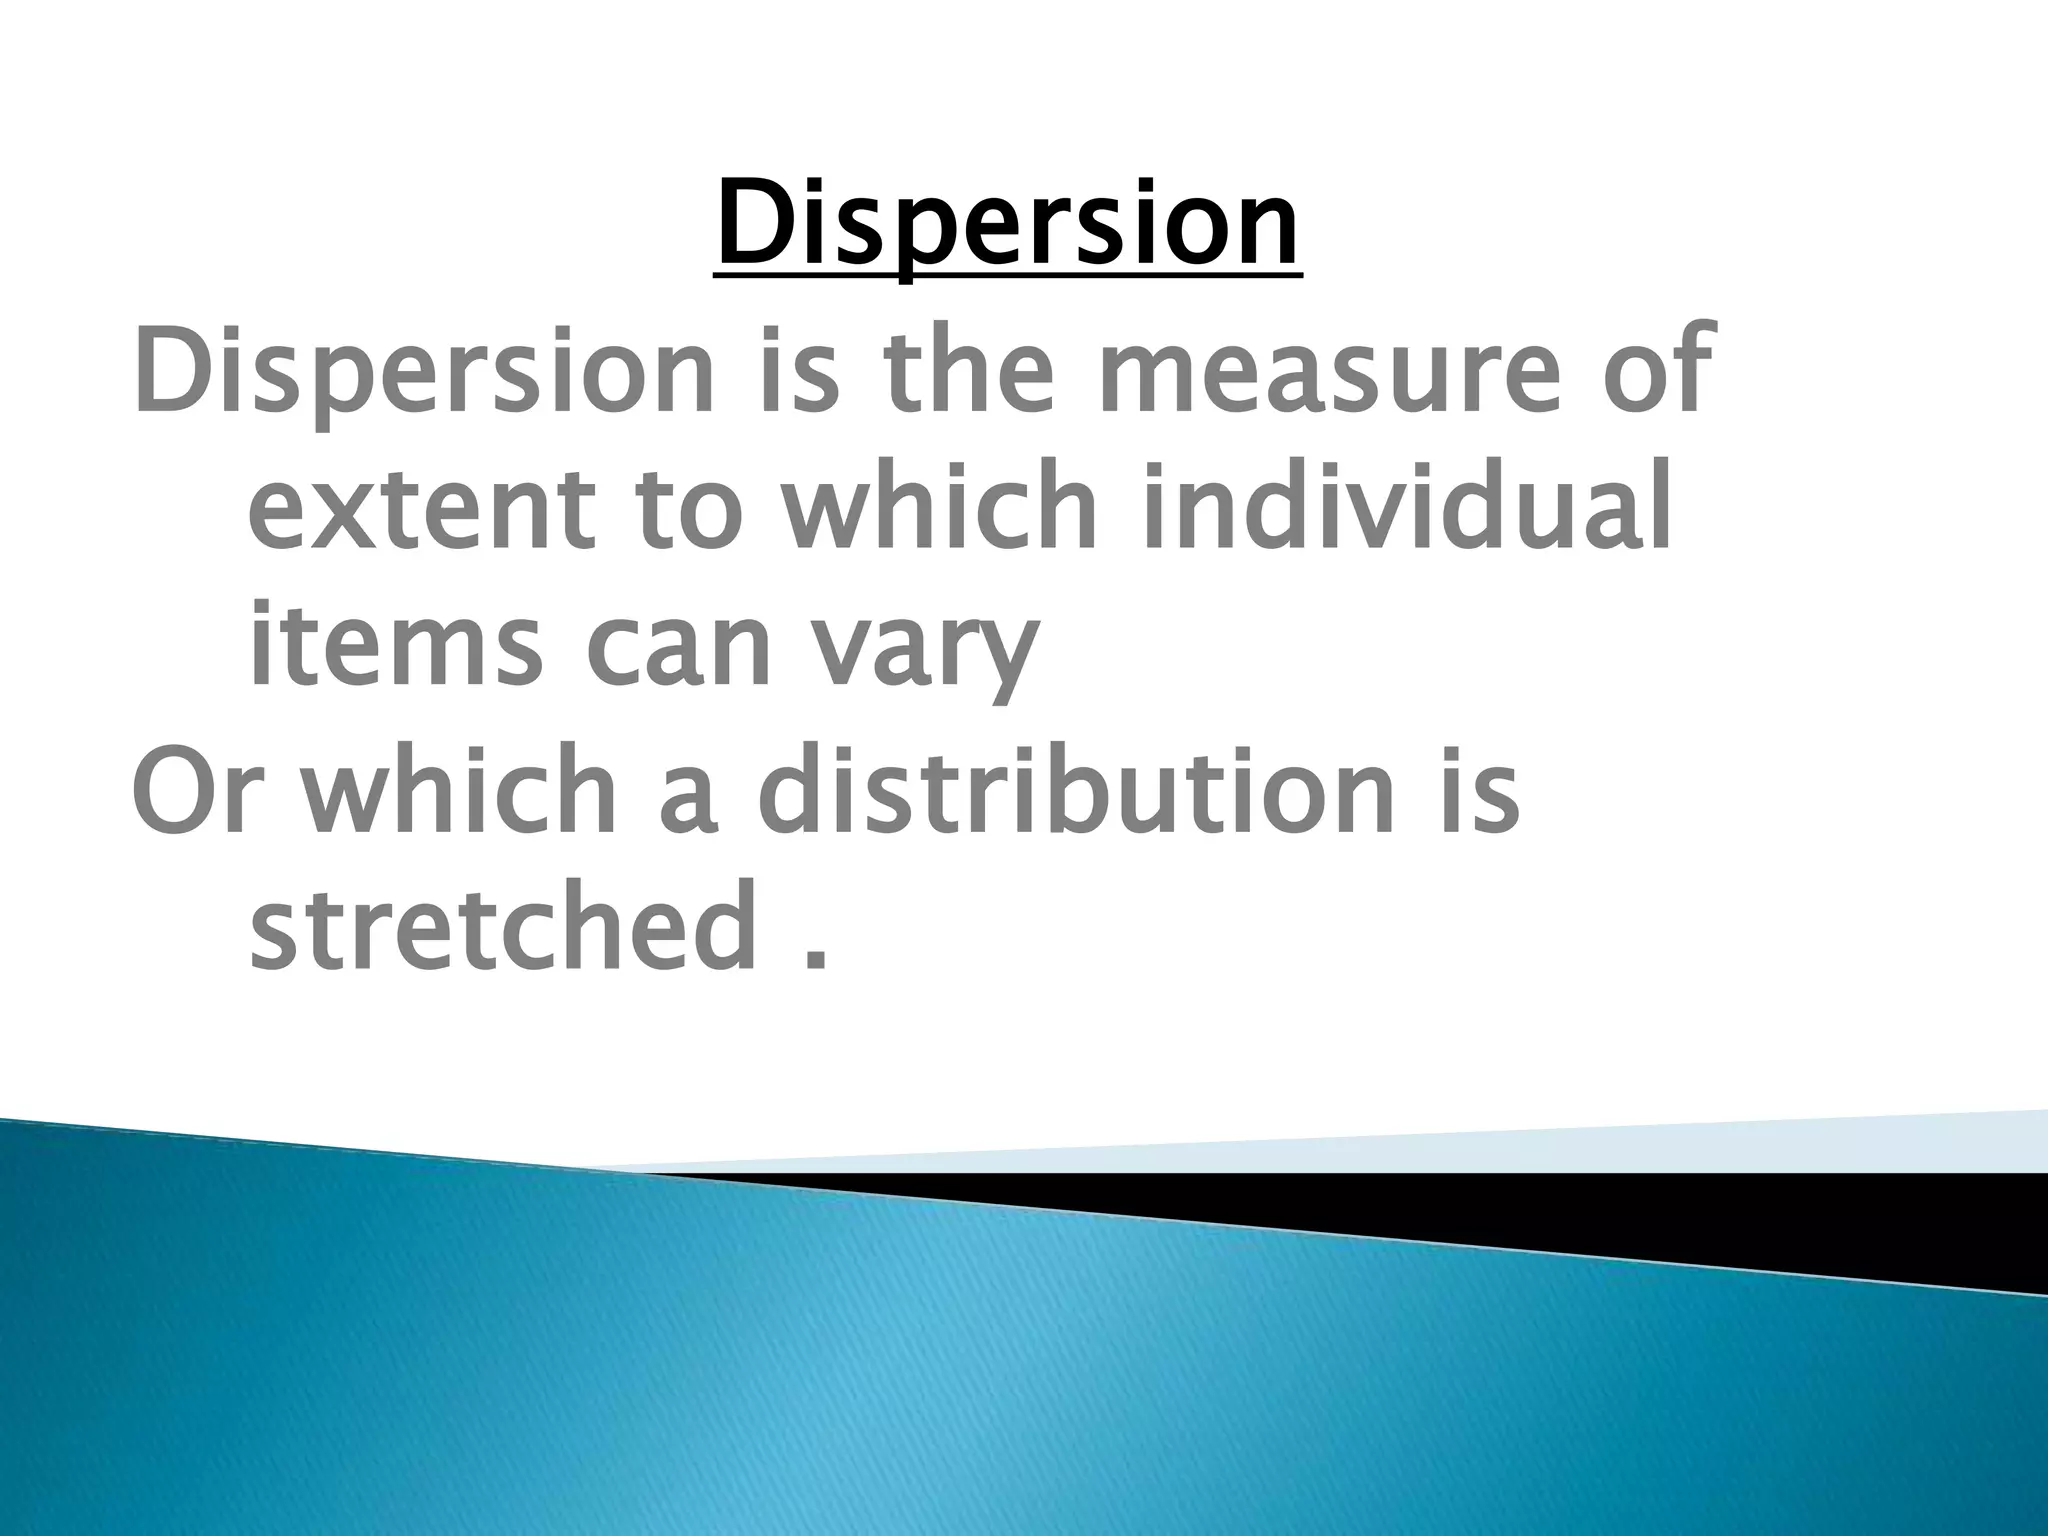
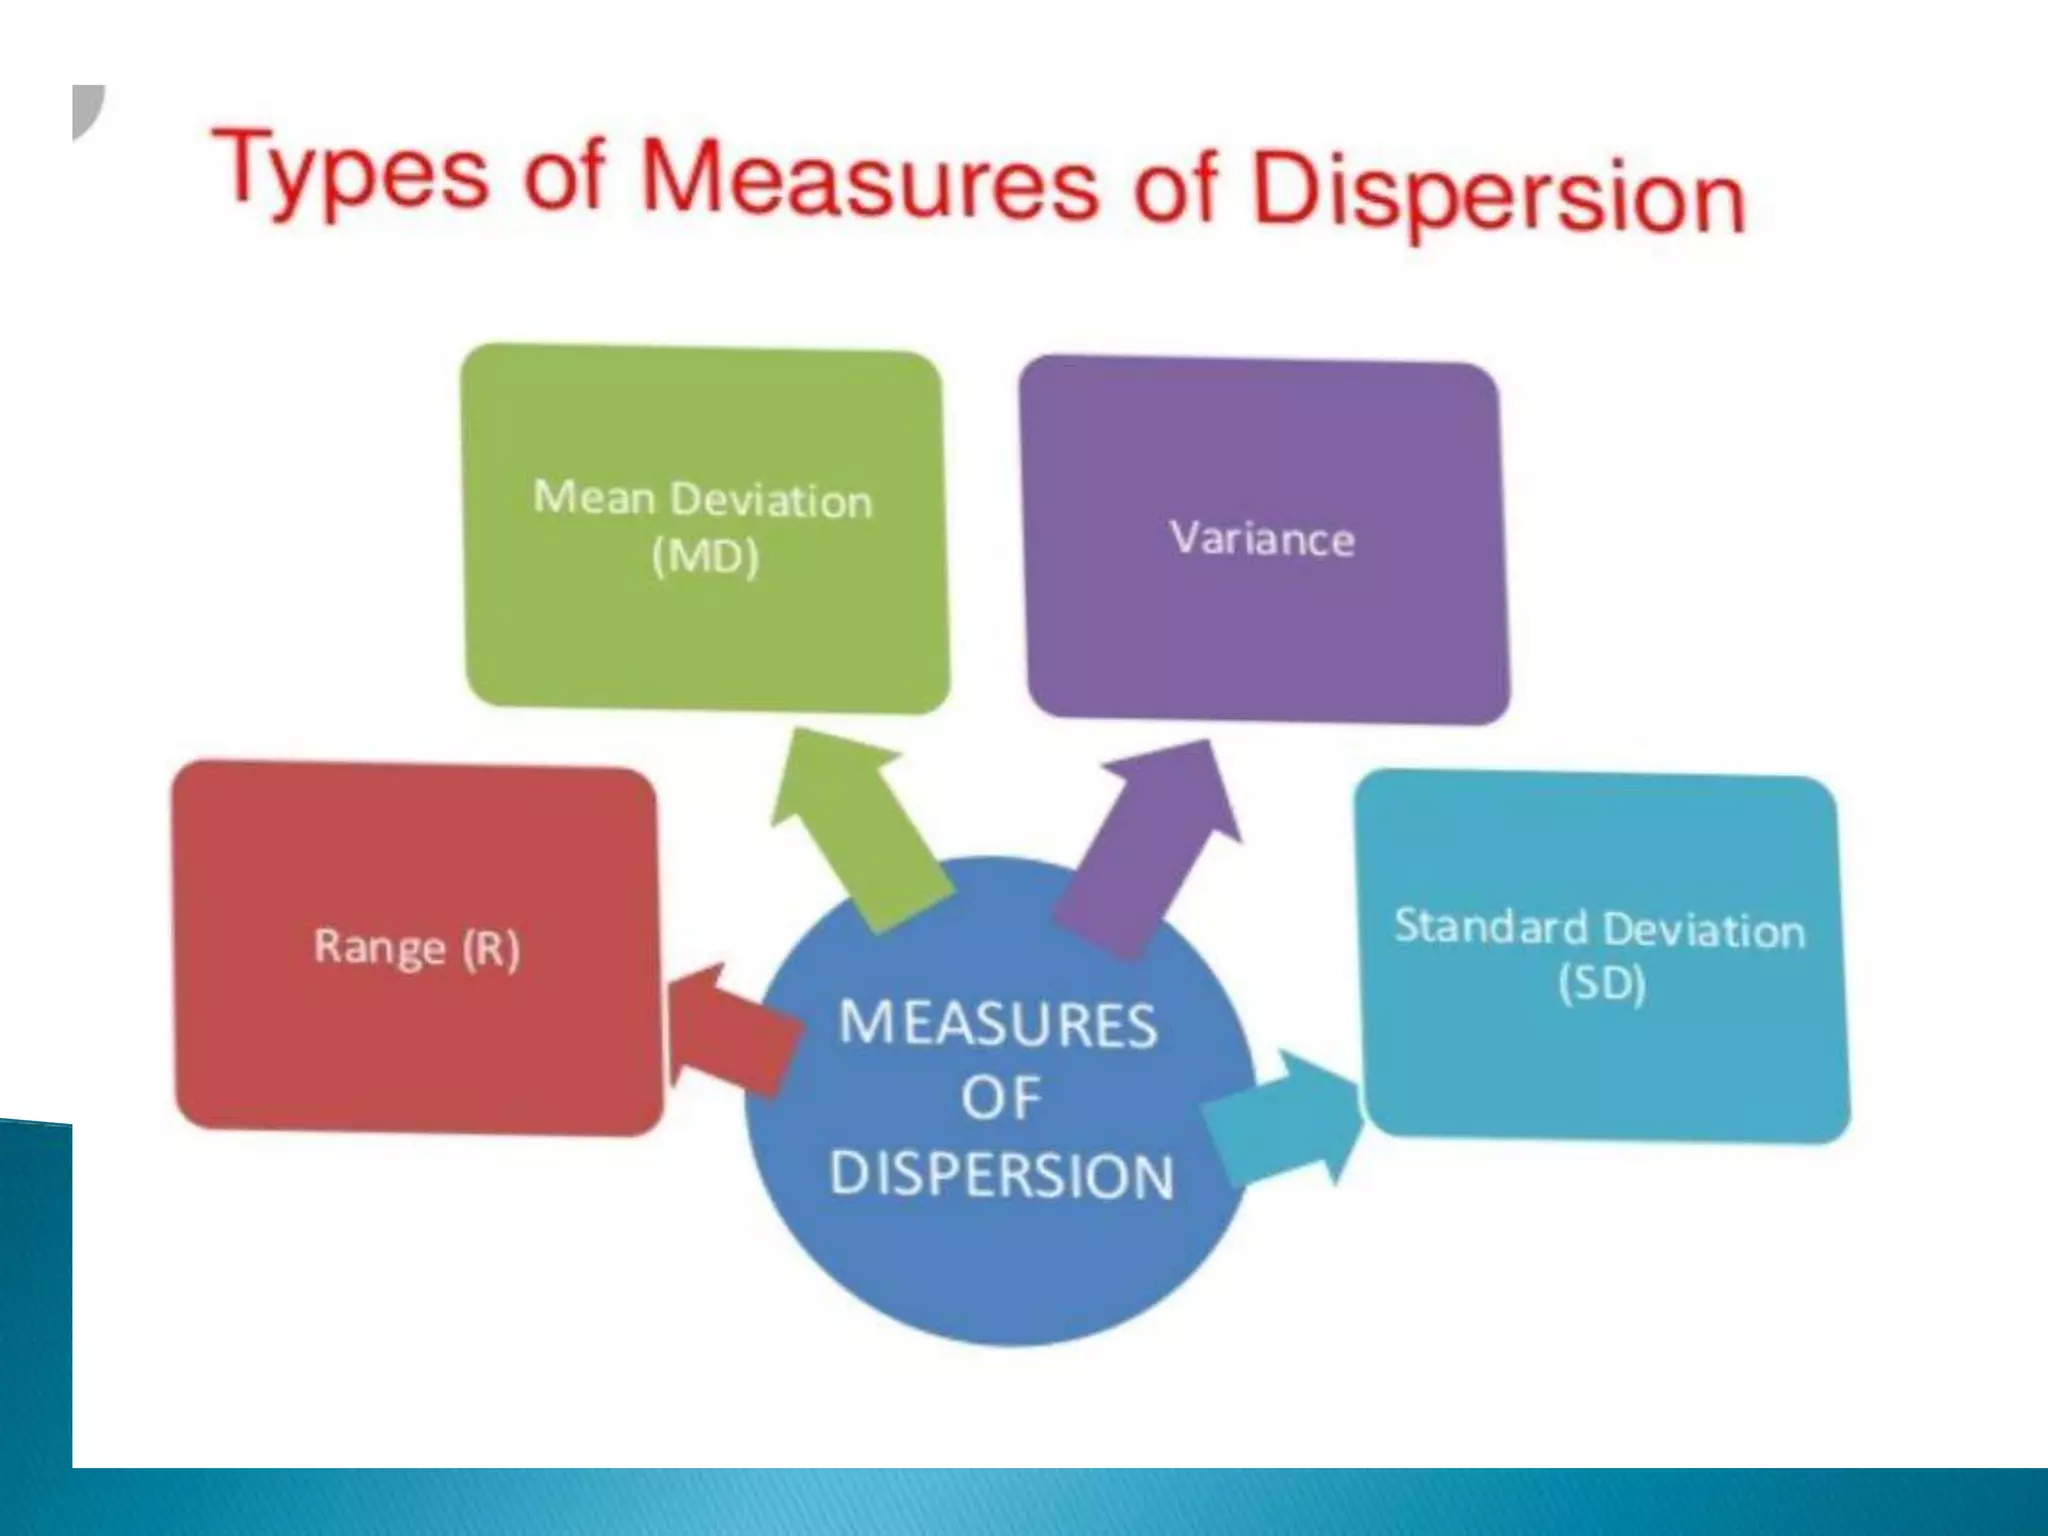
NAGESHA K
MANASA GANGOTHRI
1) Mathematical Method
2) Graphic Method
Average
Average is basically the part of
the group and it is going to
represent the group of avrage .
E.g: In a class marks out of 10 in
english sbuject of 5 students.
2,5,6,8,4
Dispersion
Dispersion is the measure of
extent to which individual
items can vary
Or which a distribution is
stretched .
Range : It is a simplest method of studing
dispersion.
Range is the difference between
the Largest value and the smallest value of a
series .
Range = L – S
example :
In a class marks out of 50 in maths subject
of 6 students
Maths = 15, 20, 30, 18, 50, 45.
where, L=50, S=15.
Range = 50 – 15 R = 35
Quartile Deviation :
It is based on the upper quartile and
the lower quartile .
The difference upper quartile and lower
quartile is called as “Inter Quartile
range”
The difference upper quartile and lower
quartile divided by 2 is called Semi Inter
Quartlie or the Quartile deviation.
Average Deviation
Average Deviation is the
distance between each
value in the data set that
data set’s are mean or
median or mode.
Standard Deviation
The Standard Deviation indicates S.D
and aslo represented by the greek
letter sigma .
S.D = It is a measure that is used to
quantify the amount of dispersion of
a set of data values
And how much the data is spread
out around the mean or average.
DISPERSION

DISPERSION

  • 1.
  • 2.
  • 3.
    Average Average is basicallythe part of the group and it is going to represent the group of avrage . E.g: In a class marks out of 10 in english sbuject of 5 students. 2,5,6,8,4
  • 4.
    Dispersion Dispersion is themeasure of extent to which individual items can vary Or which a distribution is stretched .
  • 6.
    Range : Itis a simplest method of studing dispersion. Range is the difference between the Largest value and the smallest value of a series . Range = L – S example : In a class marks out of 50 in maths subject of 6 students Maths = 15, 20, 30, 18, 50, 45. where, L=50, S=15. Range = 50 – 15 R = 35
  • 7.
    Quartile Deviation : Itis based on the upper quartile and the lower quartile . The difference upper quartile and lower quartile is called as “Inter Quartile range” The difference upper quartile and lower quartile divided by 2 is called Semi Inter Quartlie or the Quartile deviation.
  • 9.
    Average Deviation Average Deviationis the distance between each value in the data set that data set’s are mean or median or mode.
  • 11.
    Standard Deviation The StandardDeviation indicates S.D and aslo represented by the greek letter sigma . S.D = It is a measure that is used to quantify the amount of dispersion of a set of data values And how much the data is spread out around the mean or average.