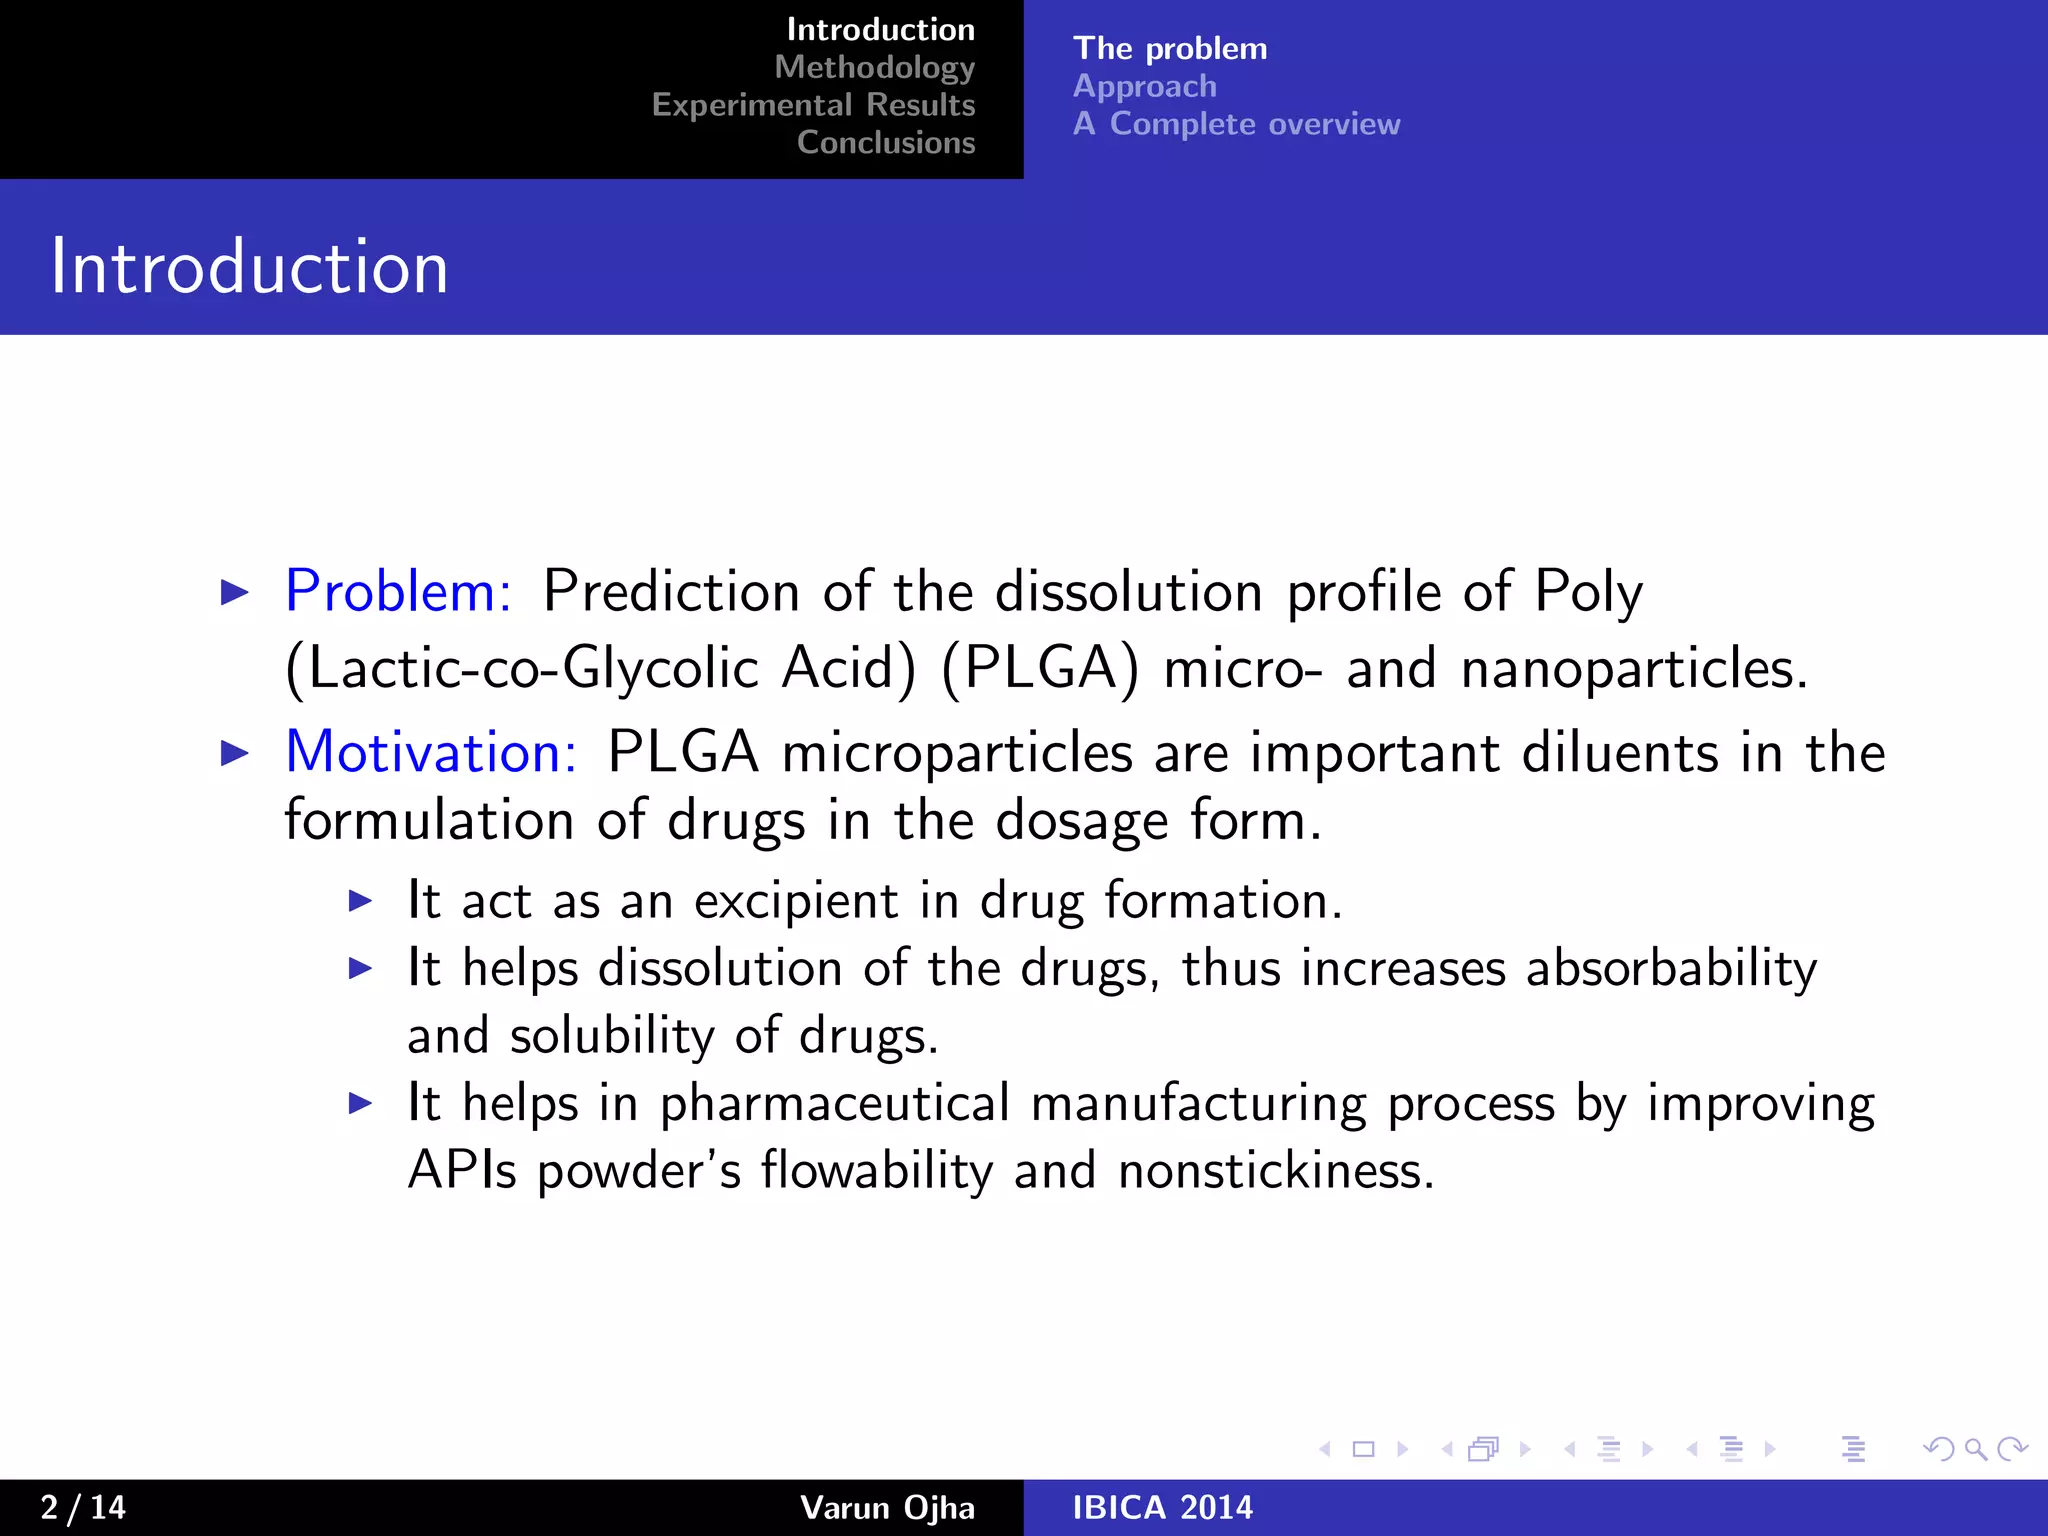
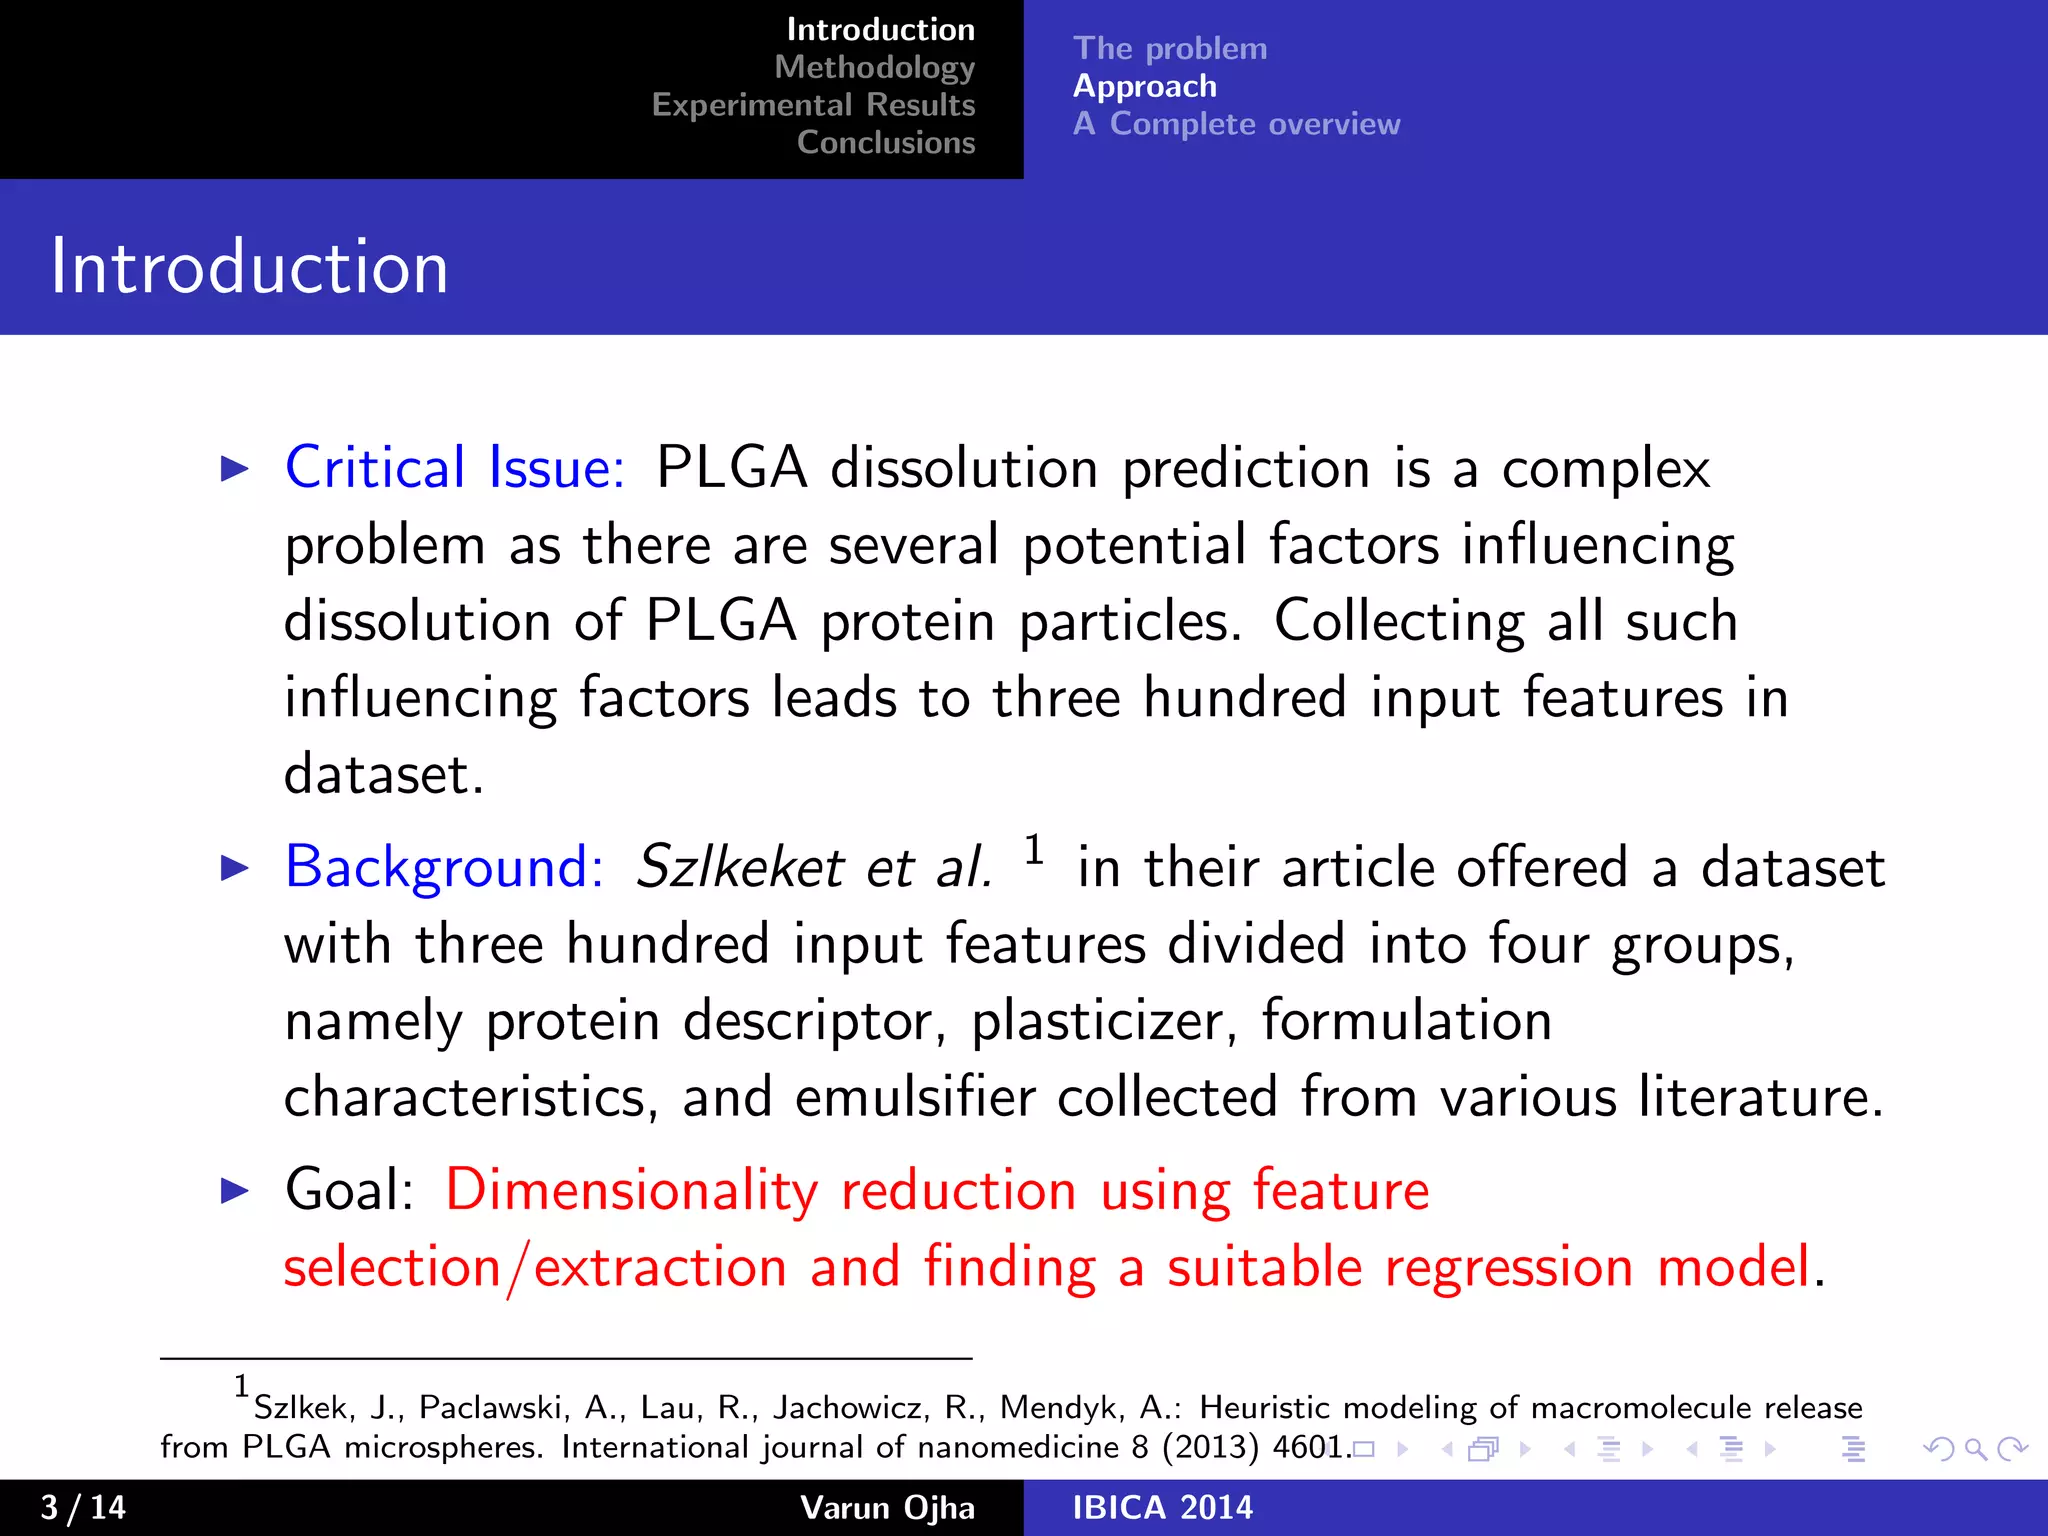
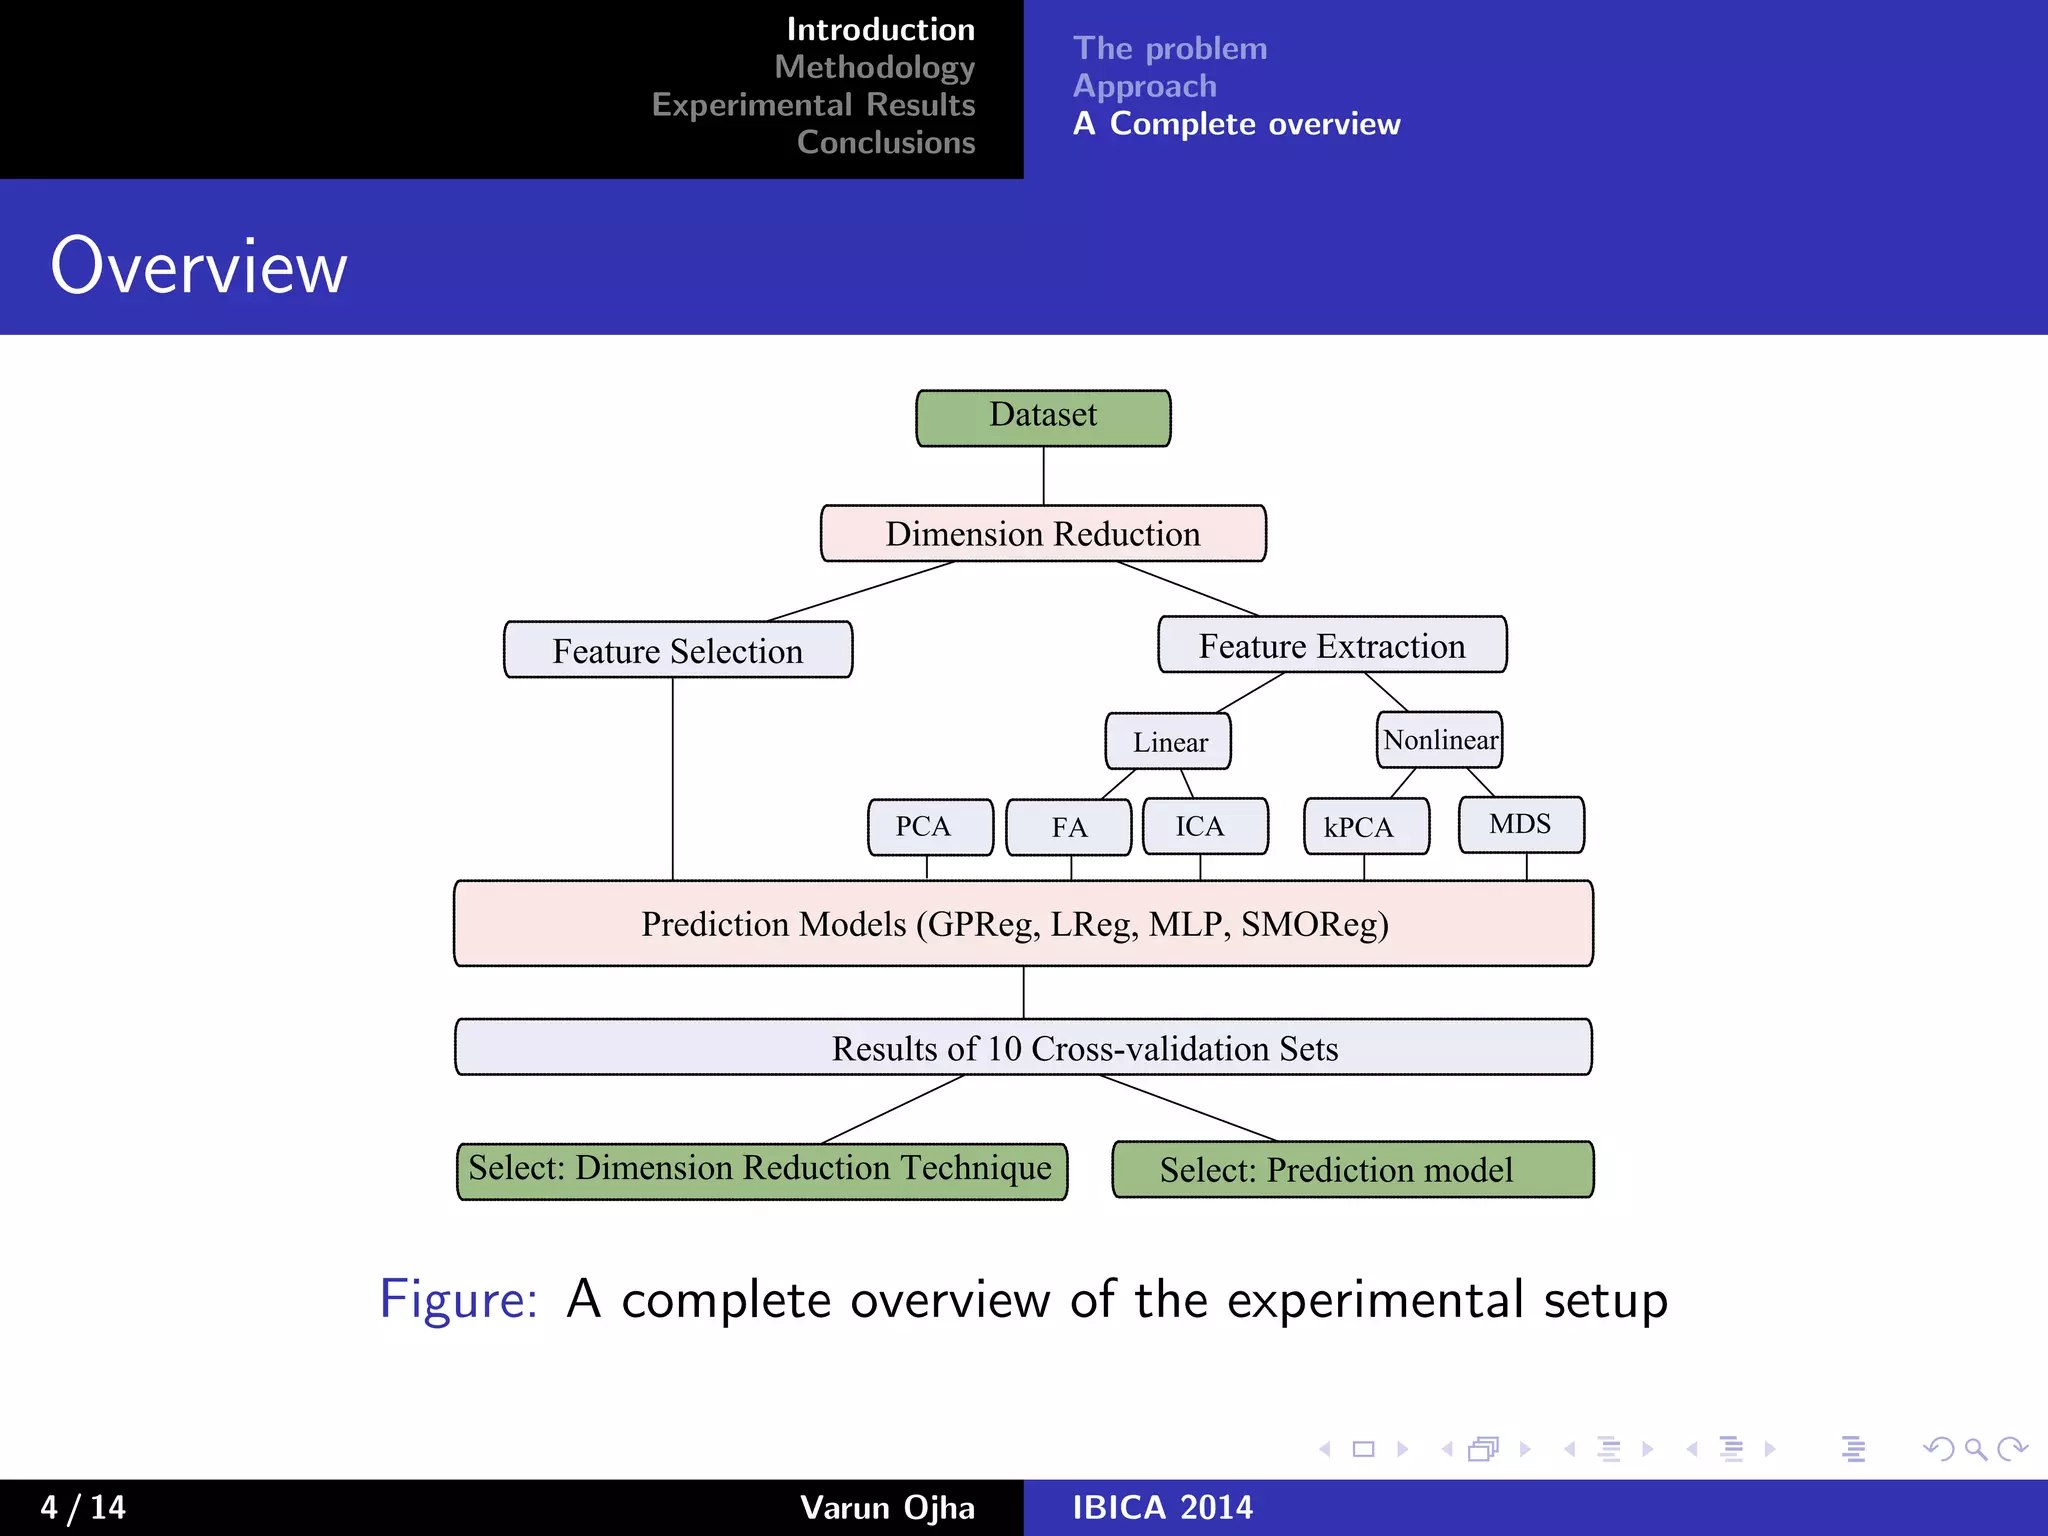
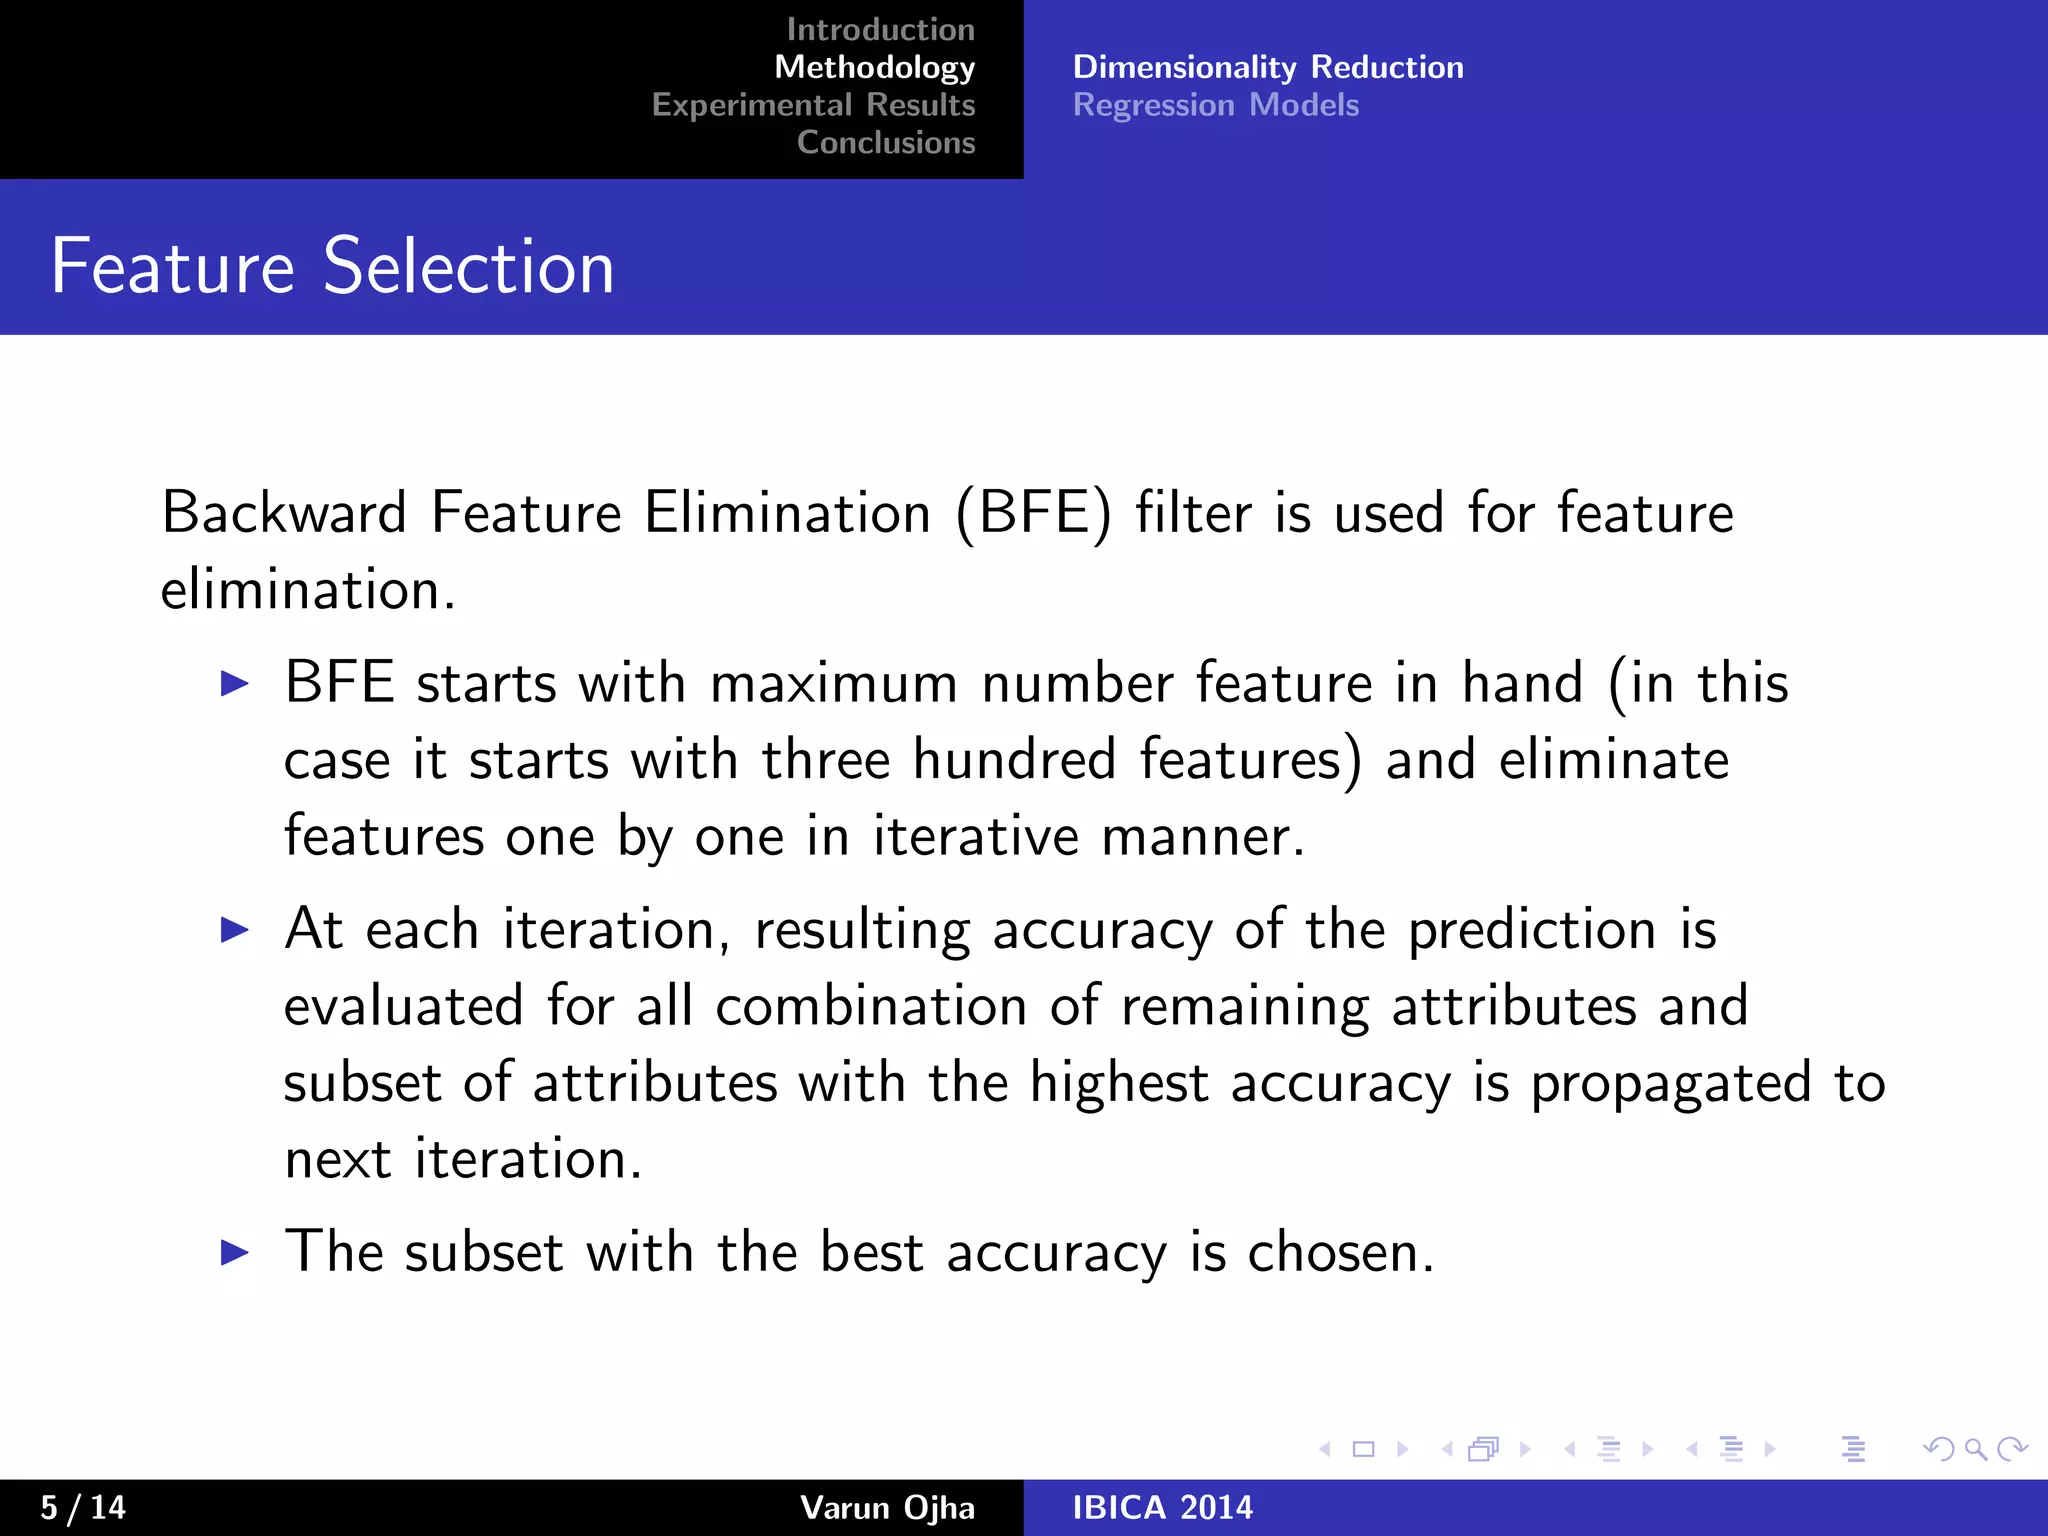
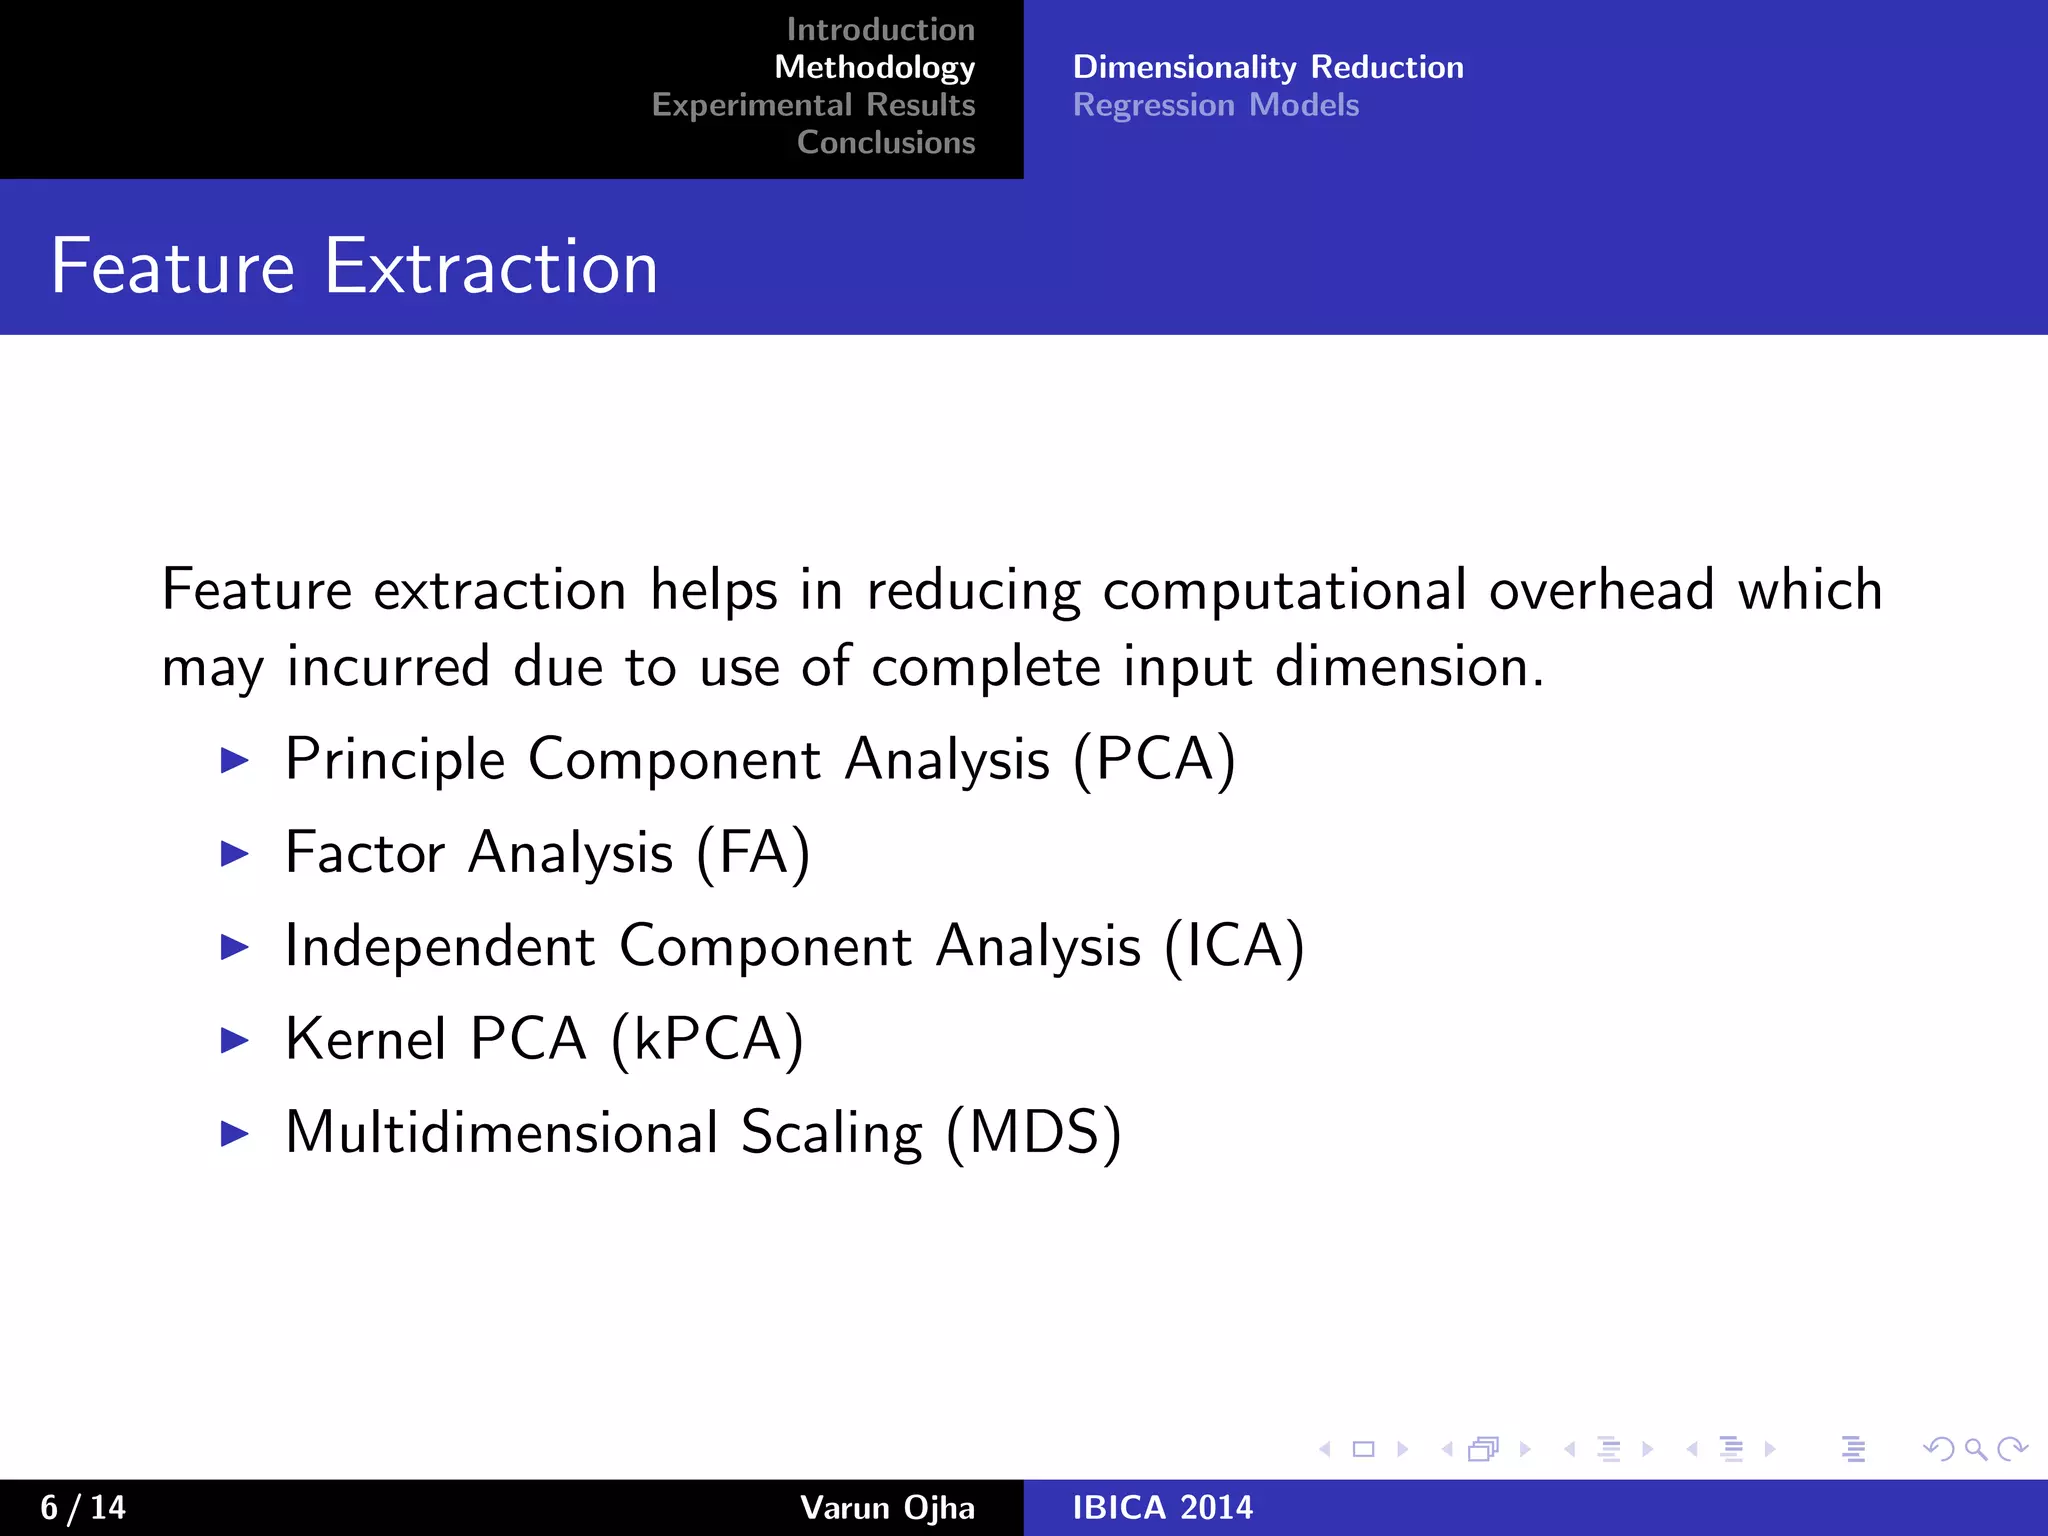
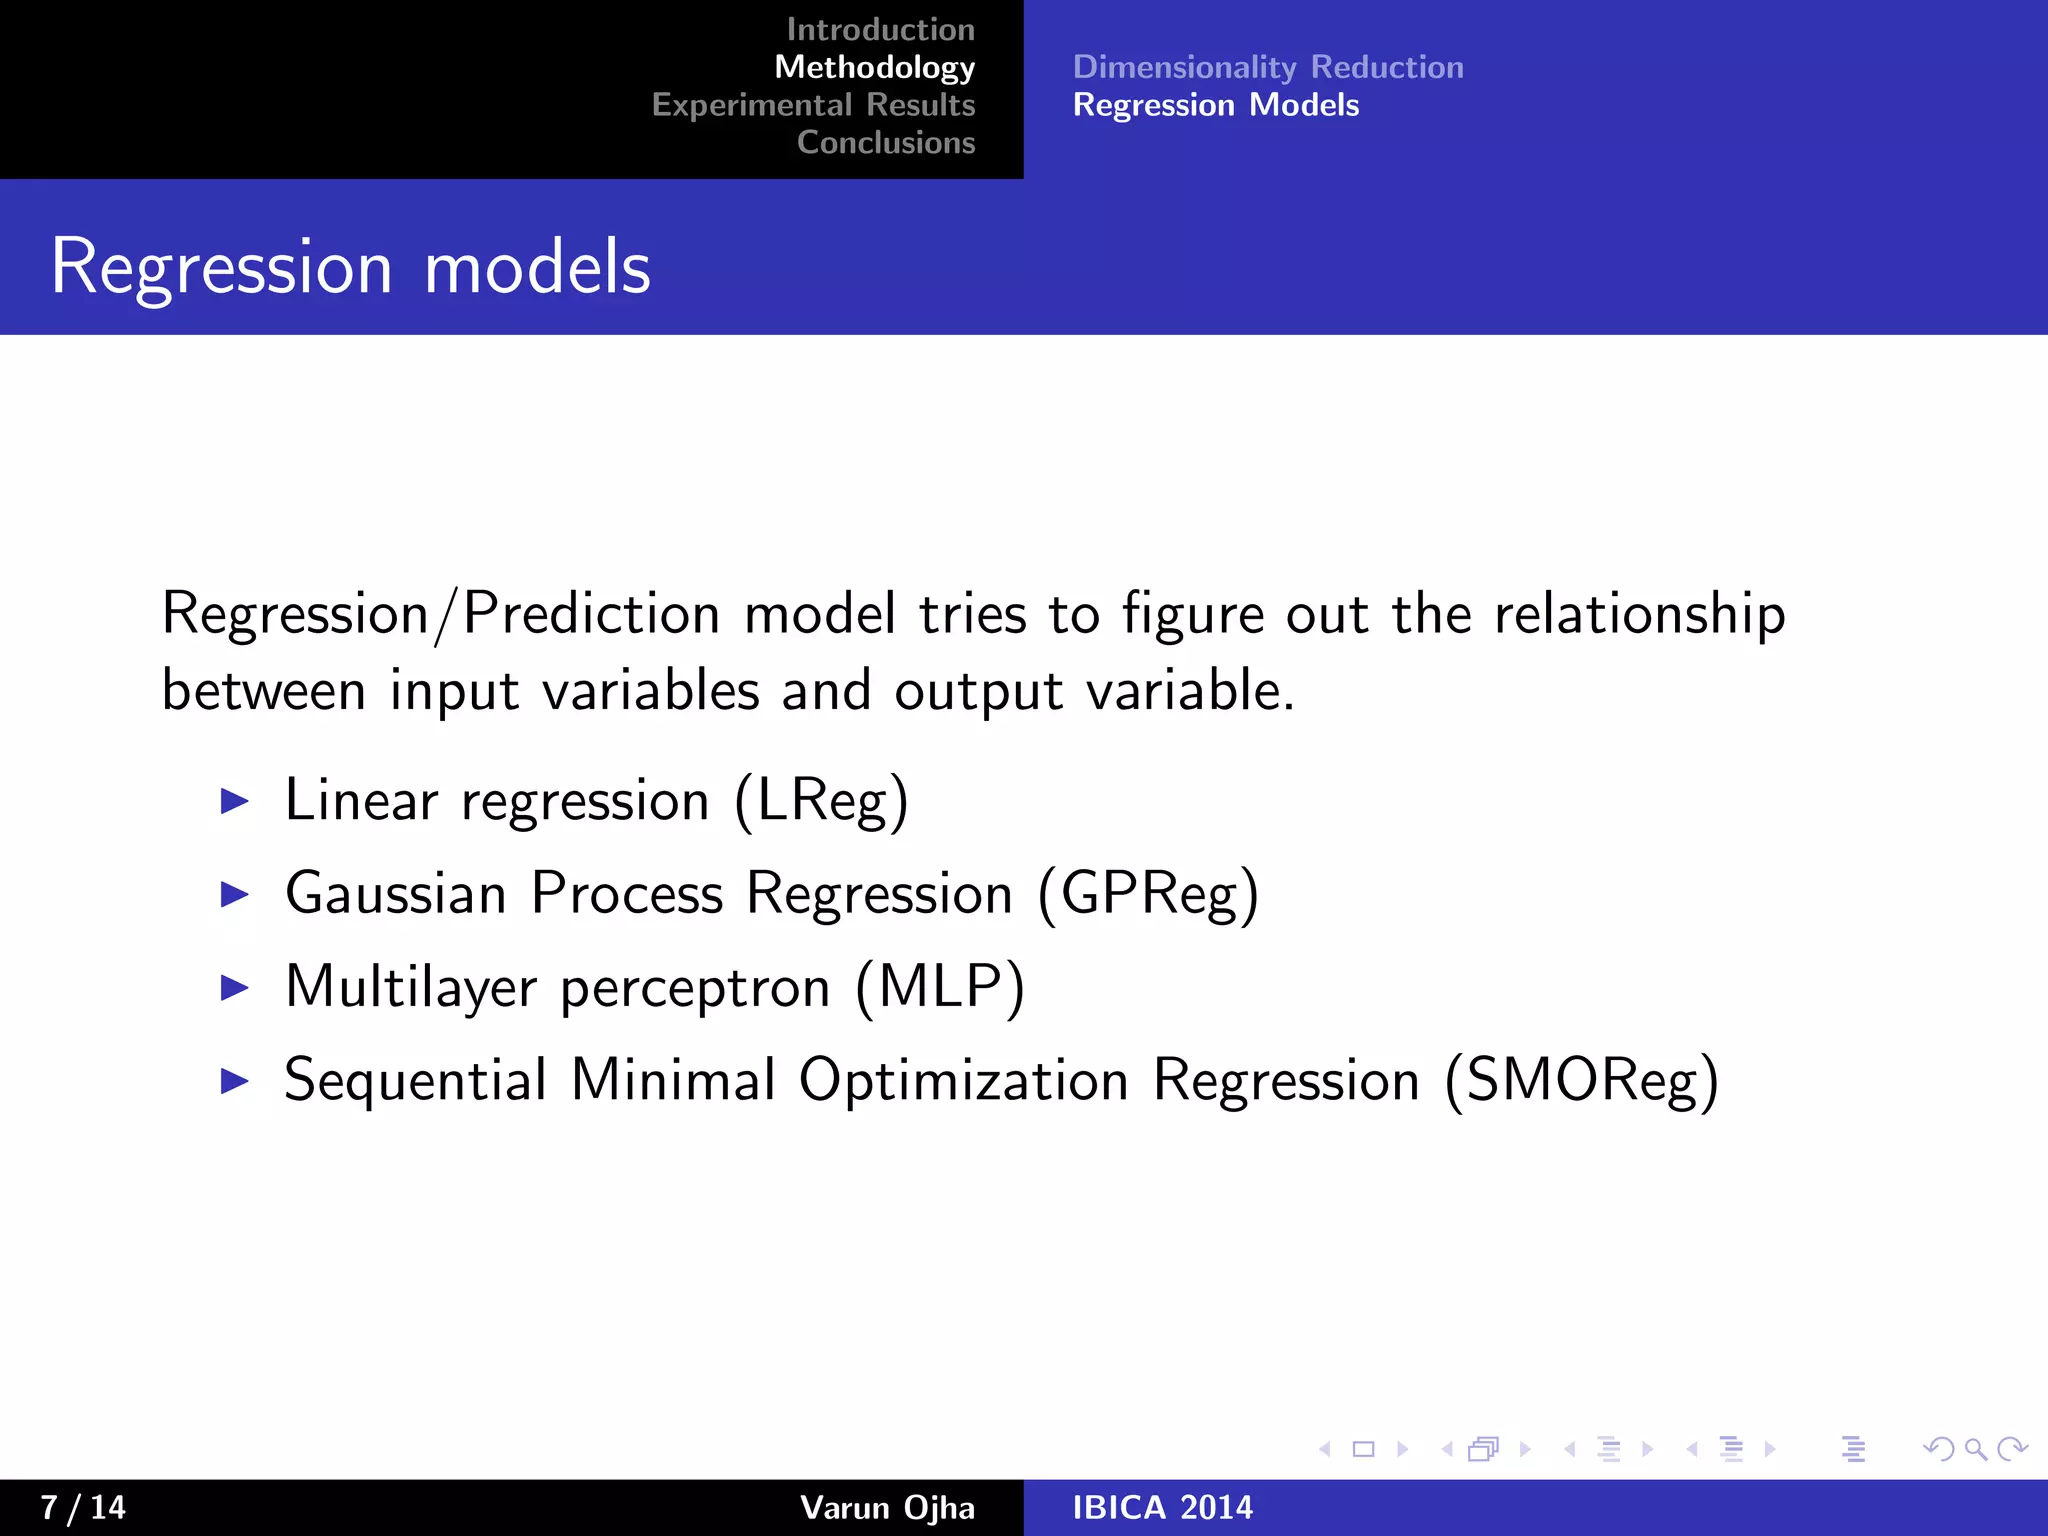
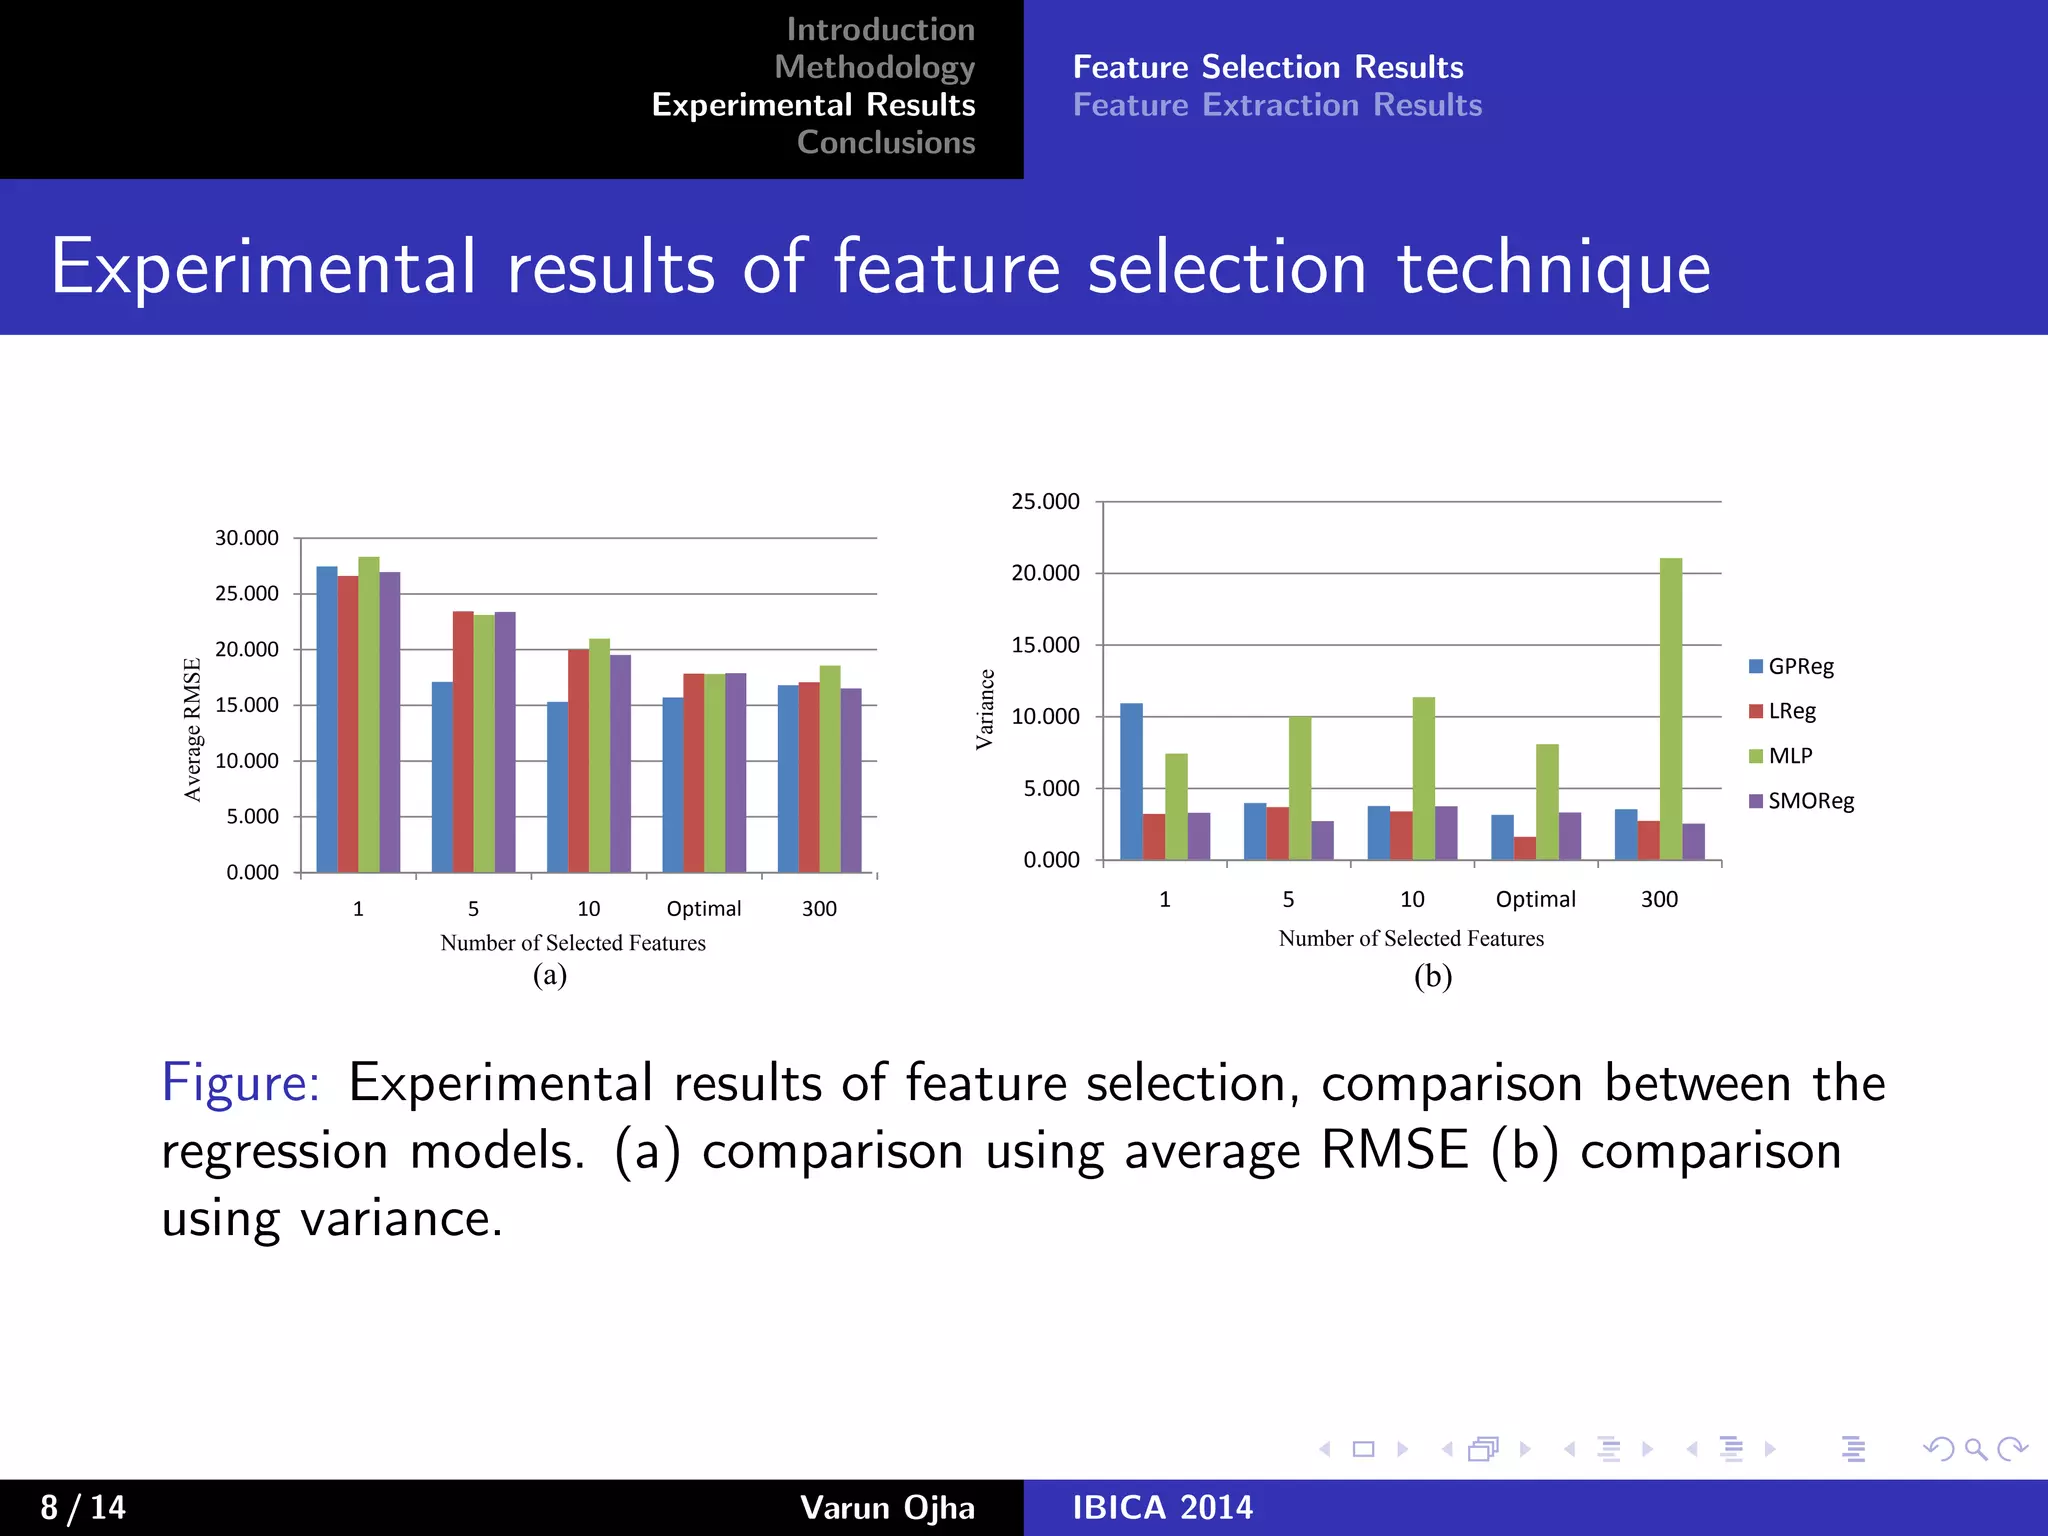
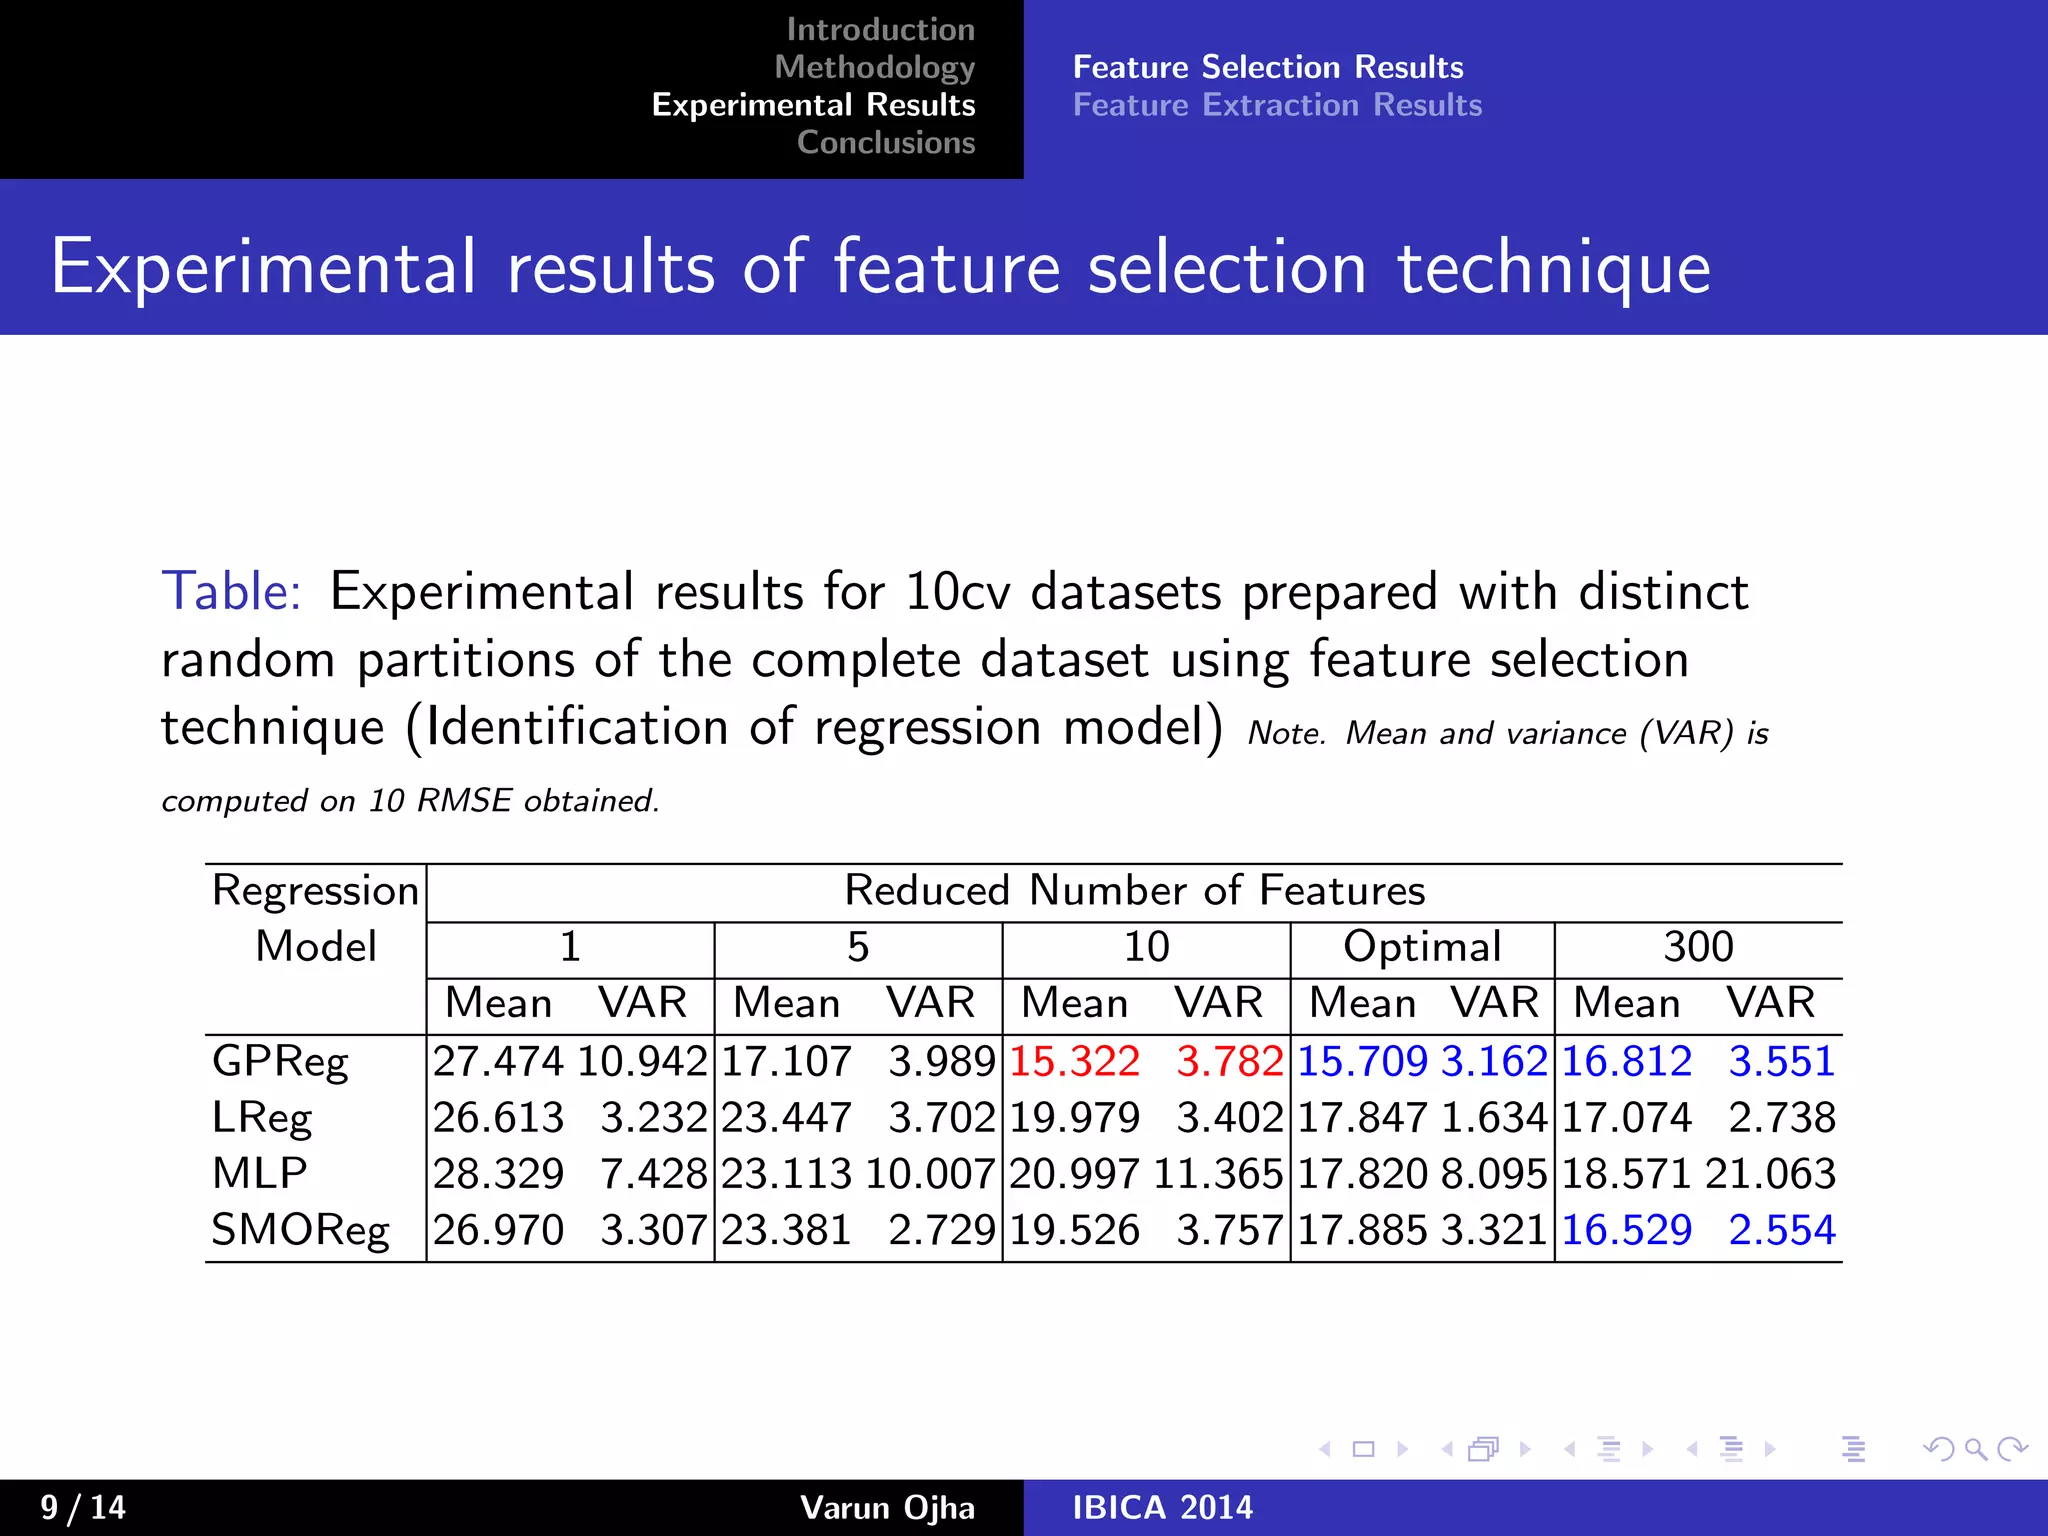
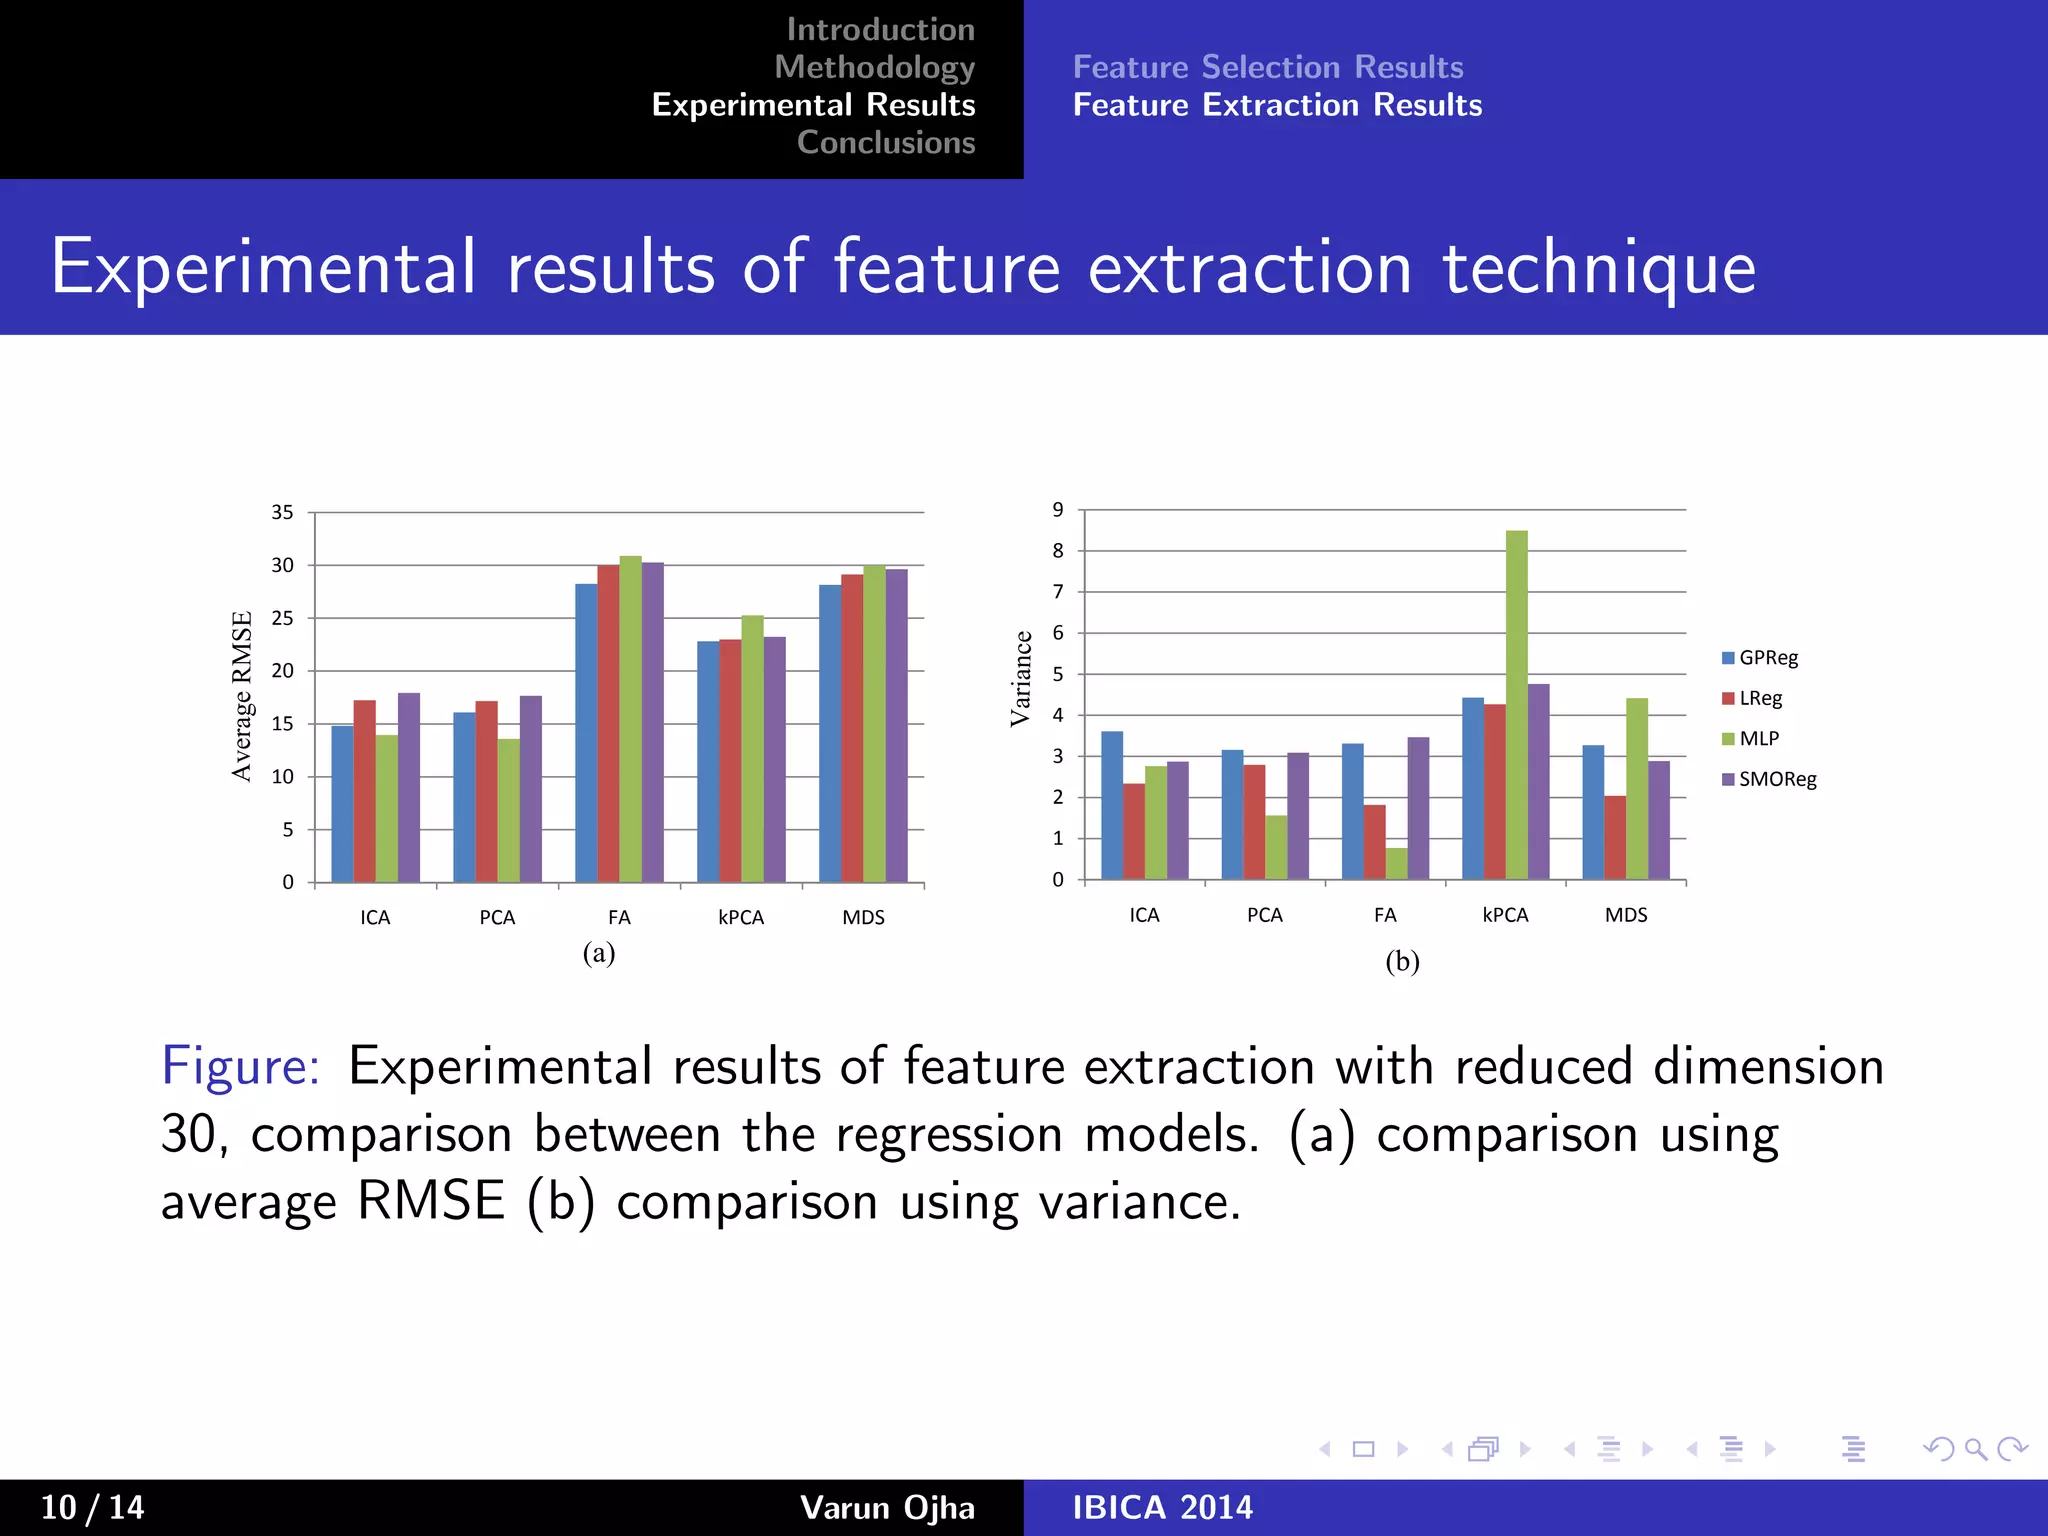
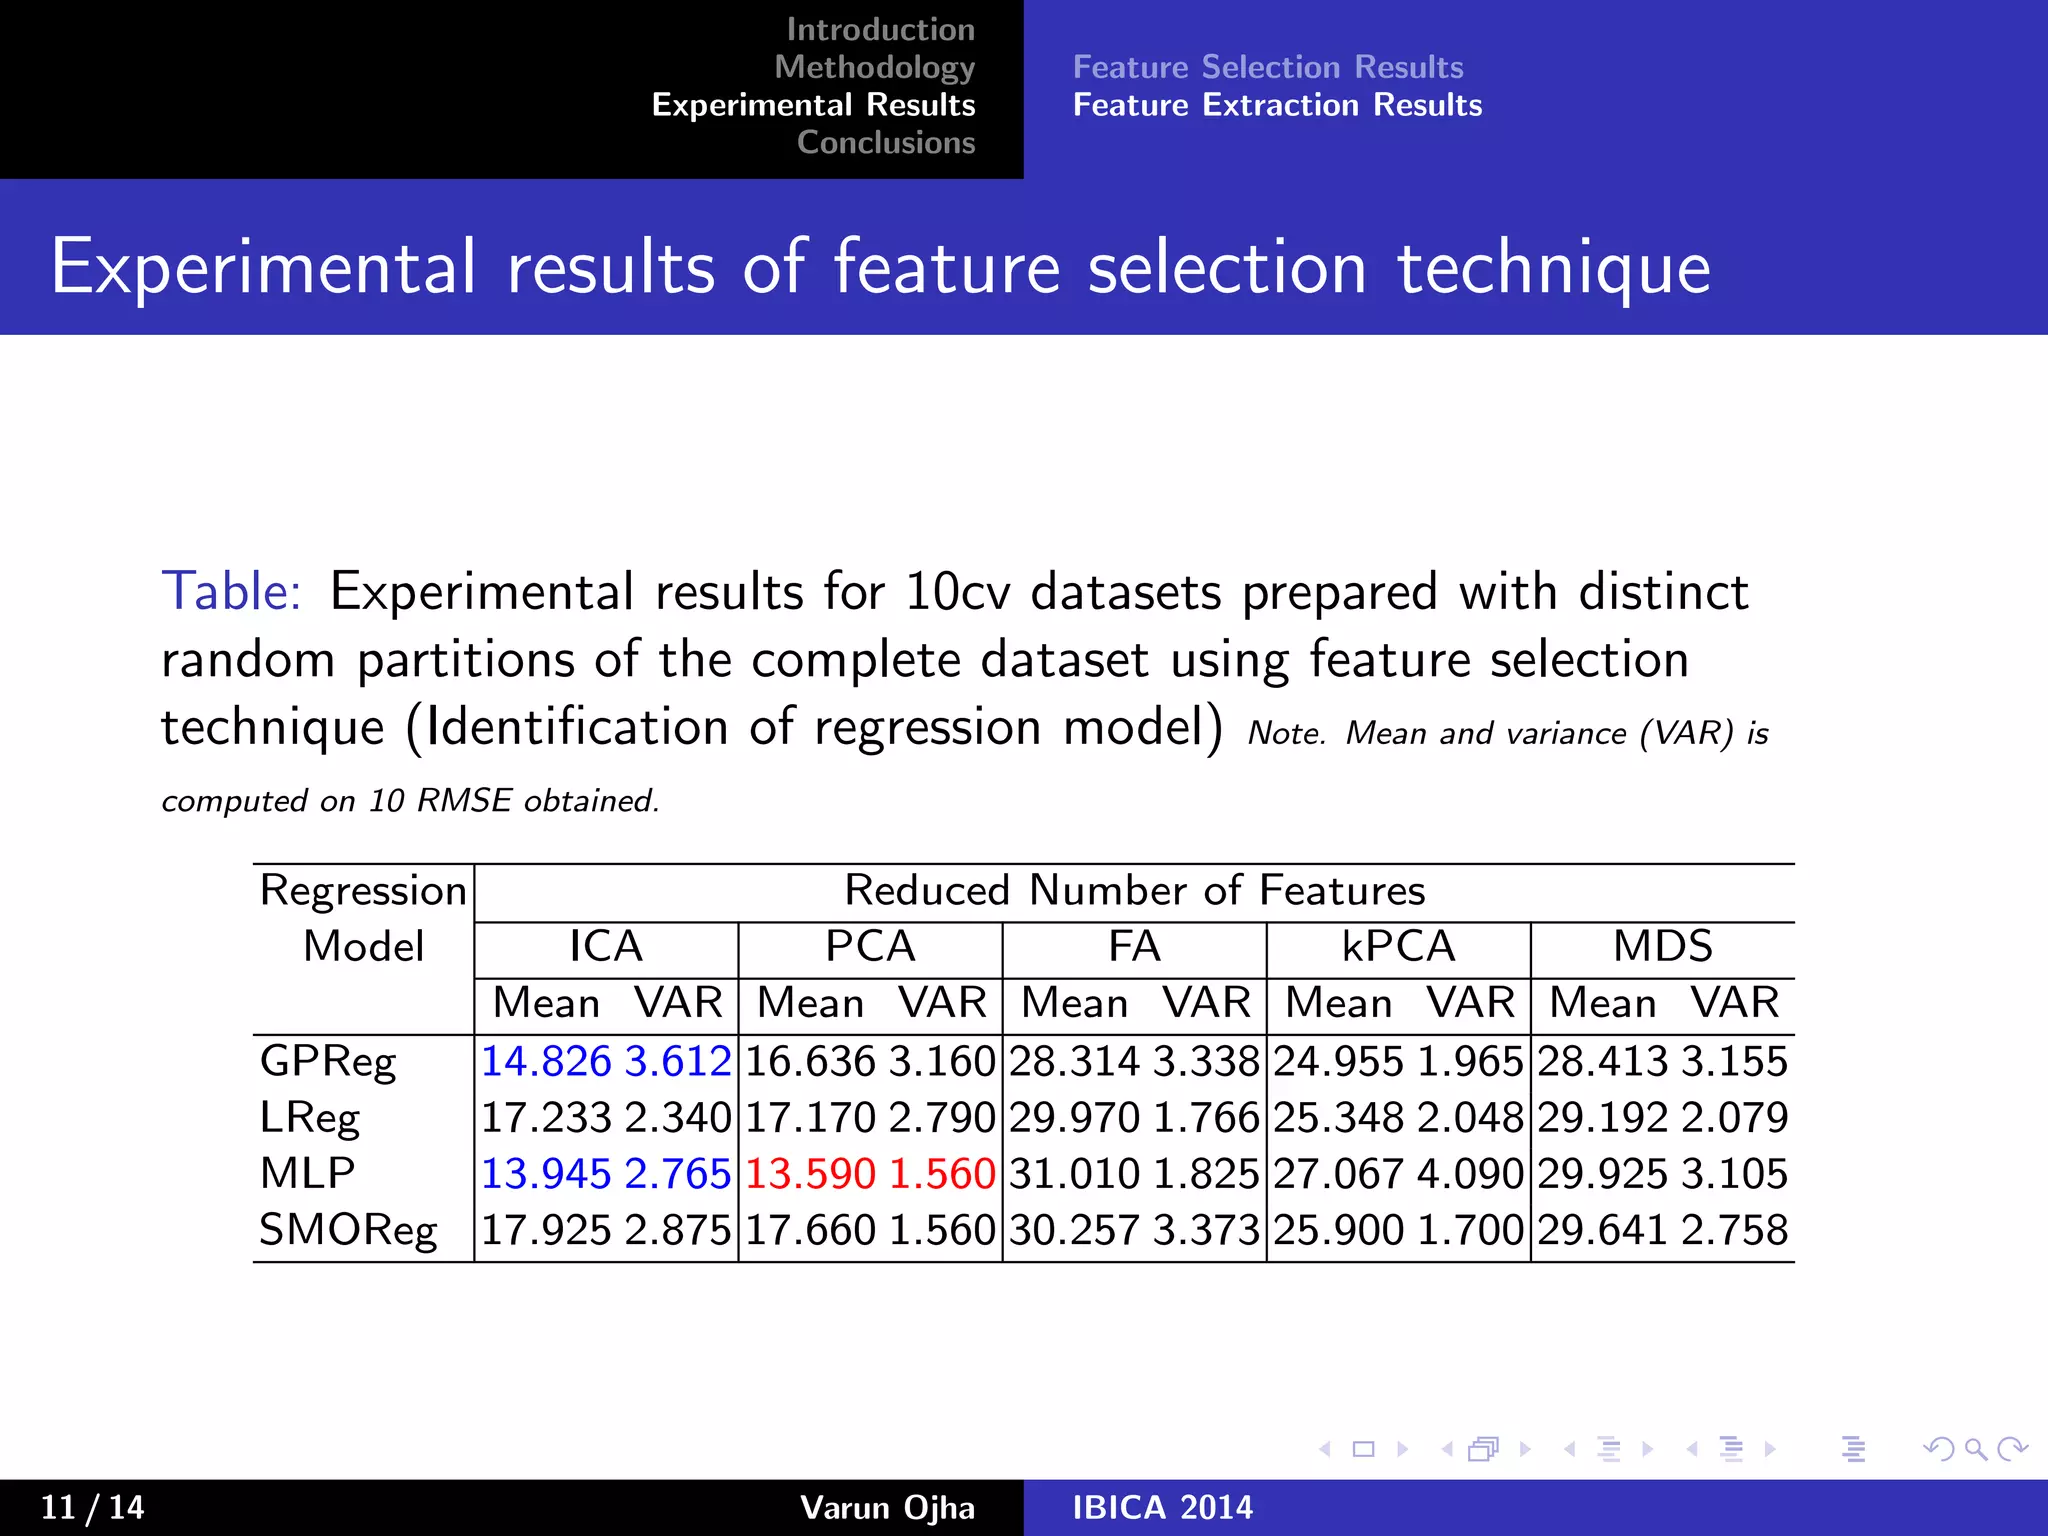
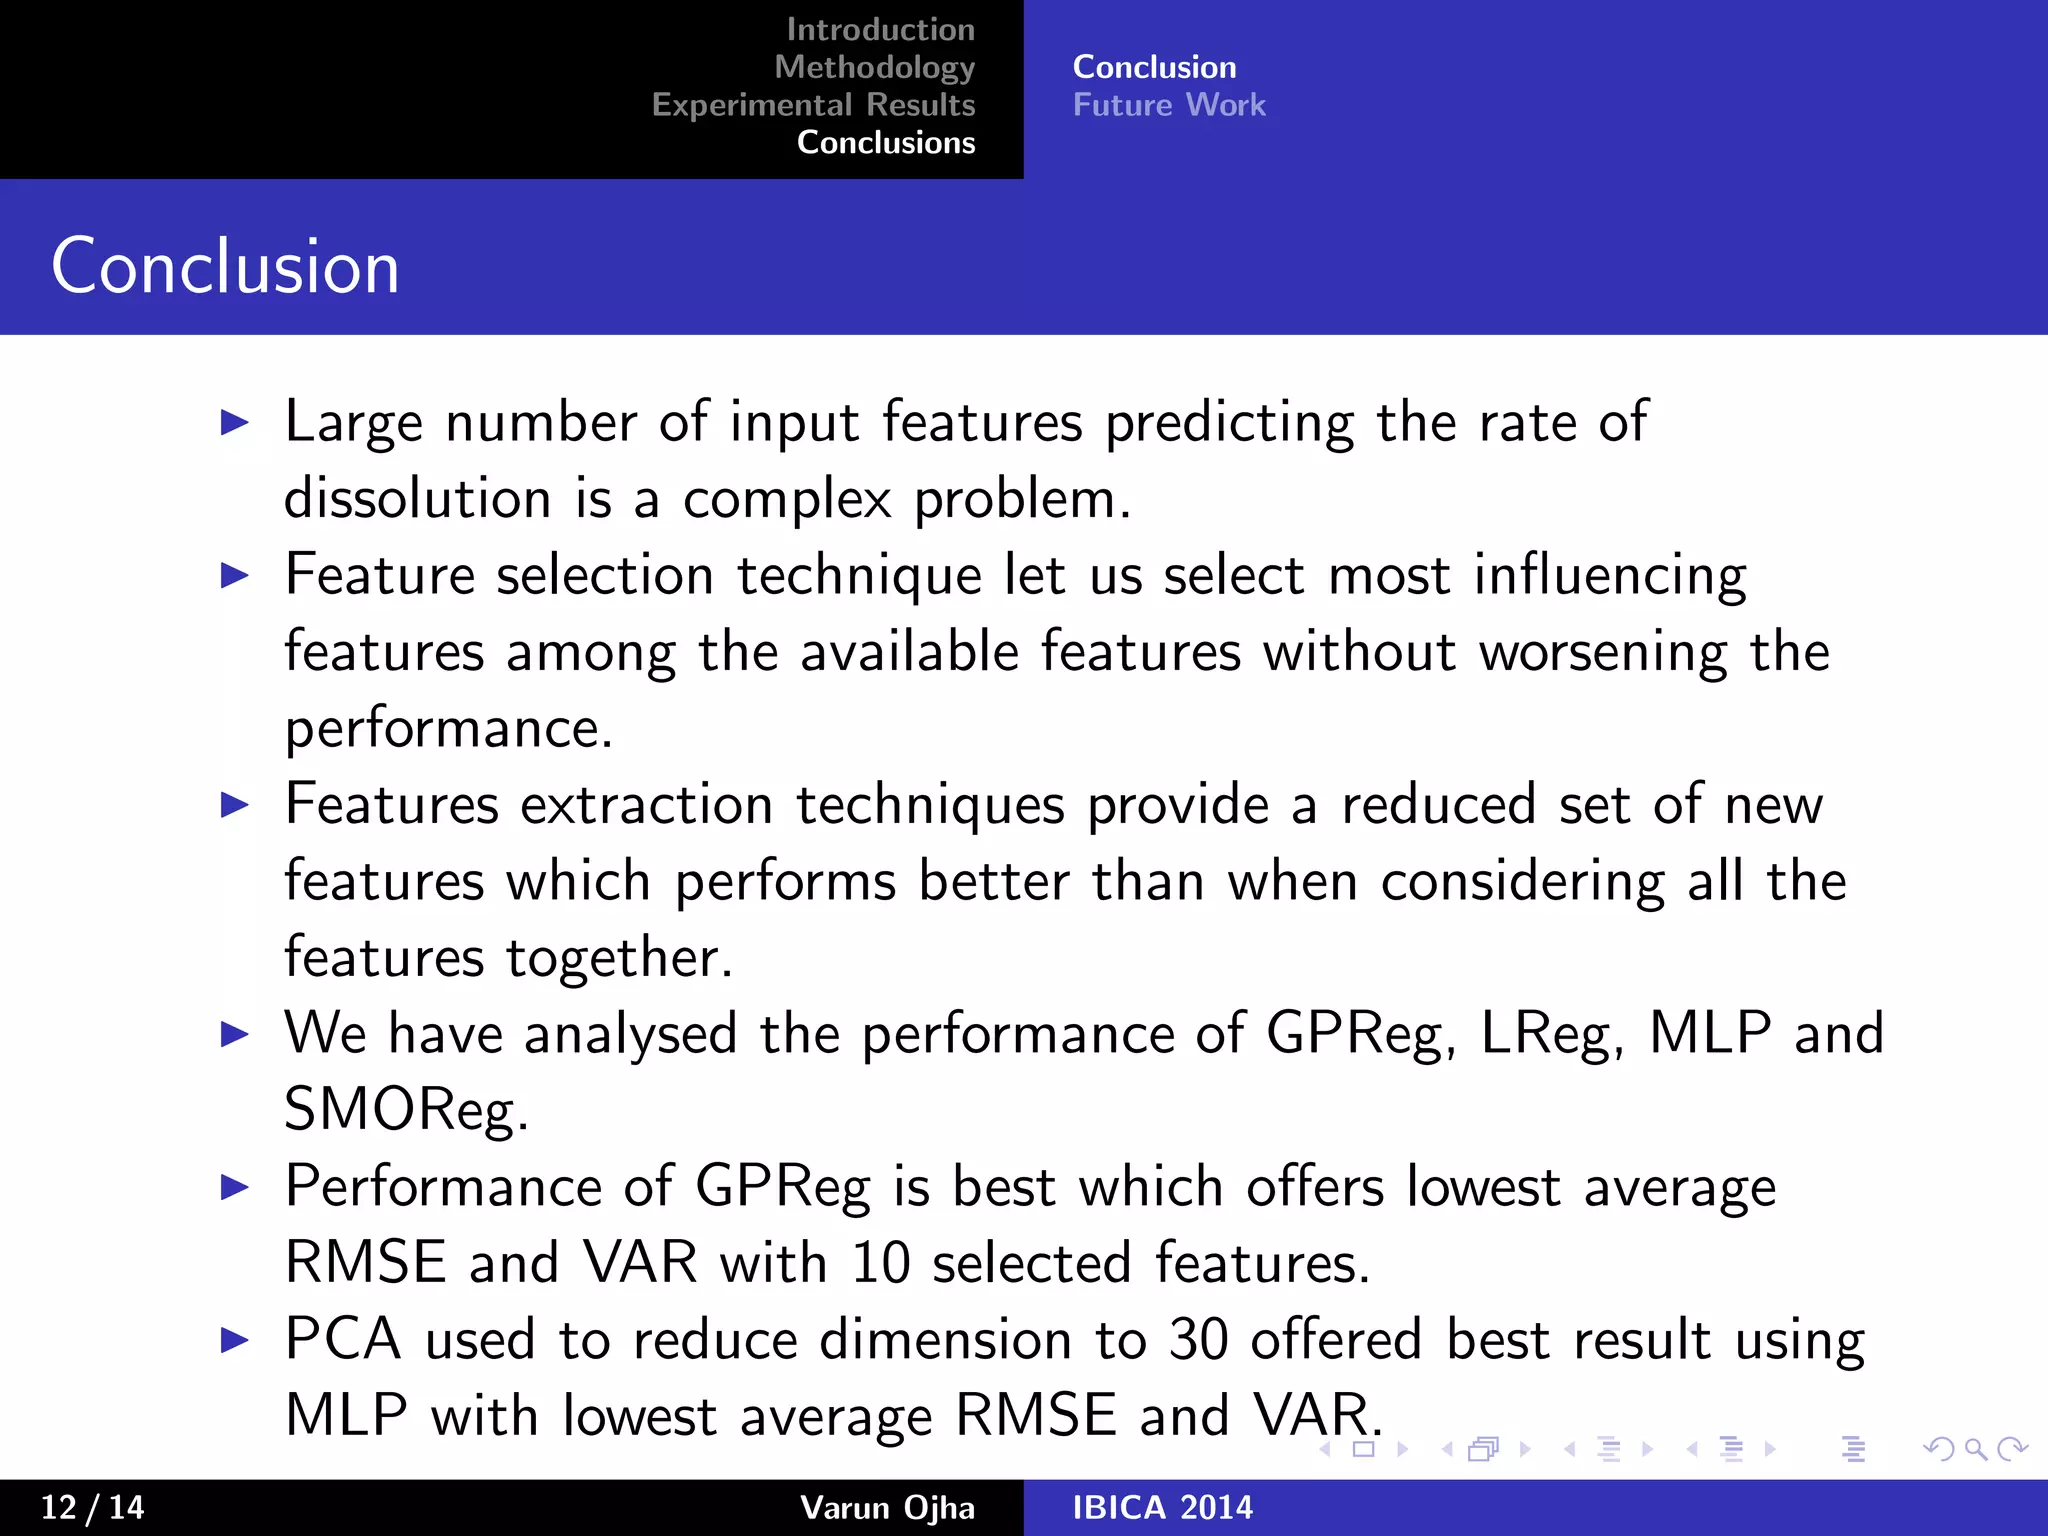
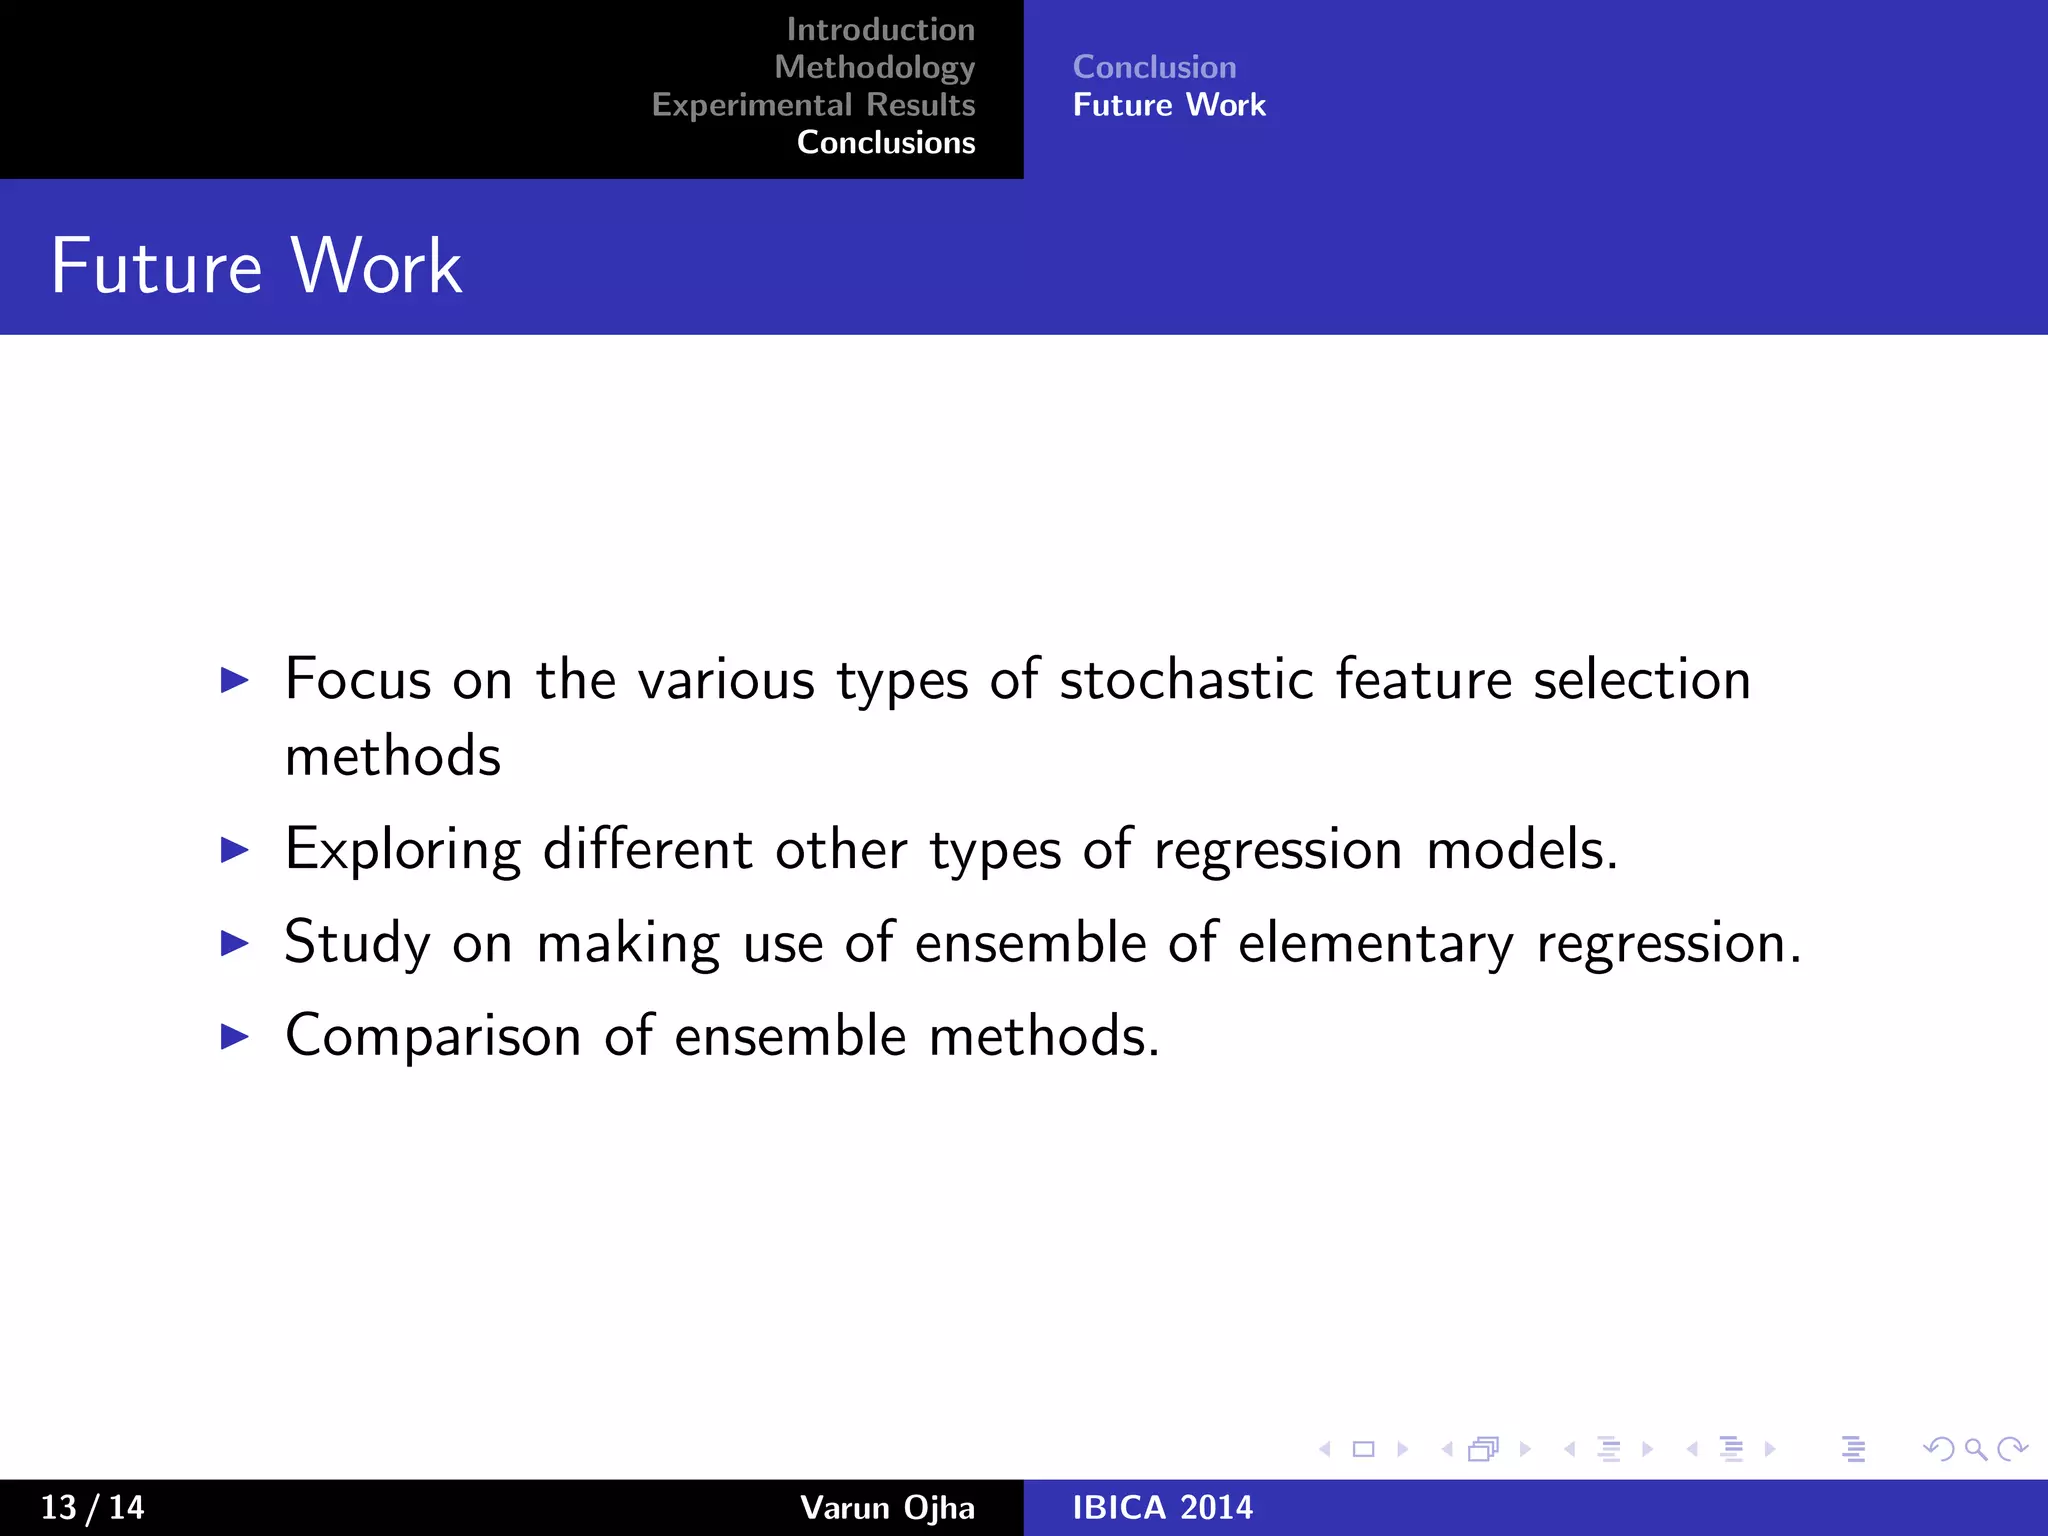
Introduction
Methodology
Experimental Results
Conclusions
Dimensionality Reduction and Prediction of the
Protein Macromolecule Dissolution Profile
V. K. Ojha, K. Jackowski, V. Sn´aˇsel and A. Abraham
IT4Innovations
VˇSB - Technical University of Ostrava
Czech Republic
24 June 2014
1 / 14 Varun Ojha IBICA 2014
Introduction
Methodology
Experimental Results
Conclusions
The problem
Approach
A Complete overview
Introduction
Problem: Prediction of the dissolution profile of Poly
(Lactic-co-Glycolic Acid) (PLGA) micro- and nanoparticles.
Motivation: PLGA microparticles are important diluents in the
formulation of drugs in the dosage form.
It act as an excipient in drug formation.
It helps dissolution of the drugs, thus increases absorbability
and solubility of drugs.
It helps in pharmaceutical manufacturing process by improving
APIs powder’s flowability and nonstickiness.
2 / 14 Varun Ojha IBICA 2014
Introduction
Methodology
Experimental Results
Conclusions
The problem
Approach
A Complete overview
Introduction
Critical Issue: PLGA dissolution prediction is a complex
problem as there are several potential factors influencing
dissolution of PLGA protein particles. Collecting all such
influencing factors leads to three hundred input features in
dataset.
Background: Szlkeket et al. 1 in their article offered a dataset
with three hundred input features divided into four groups,
namely protein descriptor, plasticizer, formulation
characteristics, and emulsifier collected from various literature.
Goal: Dimensionality reduction using feature
selection/extraction and finding a suitable regression model.
1
Szlkek, J., Paclawski, A., Lau, R., Jachowicz, R., Mendyk, A.: Heuristic modeling of macromolecule release
from PLGA microspheres. International journal of nanomedicine 8 (2013) 4601.
3 / 14 Varun Ojha IBICA 2014
Introduction
Methodology
Experimental Results
Conclusions
The problem
Approach
A Complete overview
Overview
Dataset
Dimension,Reduction
Feature,Selection Feature,Extraction
Linear Nonlinear
PCA FA ICA kPCA MDS
Prediction,Models,:GPReg,,LReg,,MLP,,SMORegT
Results,of,10,Cross-validation,Sets,
Select:,Dimension,Reduction,Technique Select:,Prediction,model
Figure: A complete overview of the experimental setup
4 / 14 Varun Ojha IBICA 2014
Introduction
Methodology
Experimental Results
Conclusions
Dimensionality Reduction
Regression Models
Feature Selection
Backward Feature Elimination (BFE) filter is used for feature
elimination.
BFE starts with maximum number feature in hand (in this
case it starts with three hundred features) and eliminate
features one by one in iterative manner.
At each iteration, resulting accuracy of the prediction is
evaluated for all combination of remaining attributes and
subset of attributes with the highest accuracy is propagated to
next iteration.
The subset with the best accuracy is chosen.
5 / 14 Varun Ojha IBICA 2014
Introduction
Methodology
Experimental Results
Conclusions
Dimensionality Reduction
Regression Models
Feature Extraction
Feature extraction helps in reducing computational overhead which
may incurred due to use of complete input dimension.
Principle Component Analysis (PCA)
Factor Analysis (FA)
Independent Component Analysis (ICA)
Kernel PCA (kPCA)
Multidimensional Scaling (MDS)
6 / 14 Varun Ojha IBICA 2014
Introduction
Methodology
Experimental Results
Conclusions
Dimensionality Reduction
Regression Models
Regression models
Regression/Prediction model tries to figure out the relationship
between input variables and output variable.
Linear regression (LReg)
Gaussian Process Regression (GPReg)
Multilayer perceptron (MLP)
Sequential Minimal Optimization Regression (SMOReg)
7 / 14 Varun Ojha IBICA 2014
Introduction
Methodology
Experimental Results
Conclusions
Feature Selection Results
Feature Extraction Results
Experimental results of feature selection technique
15.000
20.000
25.000
30.000
0.000
5.000
10.000
1 5 10 Optimal 300
Number of Selected Features
AverageRMSE
(a)
15.000
20.000
25.000
GPReg
LReg
0.000
5.000
10.000
1 5 10 Optimal 300
LReg
MLP
SMOReg
Number of Selected Features
Variance (b)
Figure: Experimental results of feature selection, comparison between the
regression models. (a) comparison using average RMSE (b) comparison
using variance.
8 / 14 Varun Ojha IBICA 2014
Introduction
Methodology
Experimental Results
Conclusions
Feature Selection Results
Feature Extraction Results
Experimental results of feature selection technique
Table: Experimental results for 10cv datasets prepared with distinct
random partitions of the complete dataset using feature selection
technique (Identification of regression model) Note. Mean and variance (VAR) is
computed on 10 RMSE obtained.
Regression Reduced Number of Features
Model 1 5 10 Optimal 300
Mean VAR Mean VAR Mean VAR Mean VAR Mean VAR
GPReg 27.474 10.942 17.107 3.989 15.322 3.782 15.709 3.162 16.812 3.551
LReg 26.613 3.232 23.447 3.702 19.979 3.402 17.847 1.634 17.074 2.738
MLP 28.329 7.428 23.113 10.007 20.997 11.365 17.820 8.095 18.571 21.063
SMOReg 26.970 3.307 23.381 2.729 19.526 3.757 17.885 3.321 16.529 2.554
9 / 14 Varun Ojha IBICA 2014
Introduction
Methodology
Experimental Results
Conclusions
Feature Selection Results
Feature Extraction Results
Experimental results of feature extraction technique
20
25
30
35
0
5
10
15
20
ICA PCA FA kPCA MDS
AverageRMSE
(a)
5
6
7
8
9
GPReg
0
1
2
3
4
5
ICA PCA FA kPCA MDS
LReg
MLP
SMOReg
(b)
Variance
Figure: Experimental results of feature extraction with reduced dimension
30, comparison between the regression models. (a) comparison using
average RMSE (b) comparison using variance.
10 / 14 Varun Ojha IBICA 2014
Introduction
Methodology
Experimental Results
Conclusions
Feature Selection Results
Feature Extraction Results
Experimental results of feature selection technique
Table: Experimental results for 10cv datasets prepared with distinct
random partitions of the complete dataset using feature selection
technique (Identification of regression model) Note. Mean and variance (VAR) is
computed on 10 RMSE obtained.
Regression Reduced Number of Features
Model ICA PCA FA kPCA MDS
Mean VAR Mean VAR Mean VAR Mean VAR Mean VAR
GPReg 14.826 3.612 16.636 3.160 28.314 3.338 24.955 1.965 28.413 3.155
LReg 17.233 2.340 17.170 2.790 29.970 1.766 25.348 2.048 29.192 2.079
MLP 13.945 2.765 13.590 1.560 31.010 1.825 27.067 4.090 29.925 3.105
SMOReg 17.925 2.875 17.660 1.560 30.257 3.373 25.900 1.700 29.641 2.758
11 / 14 Varun Ojha IBICA 2014
Introduction
Methodology
Experimental Results
Conclusions
Conclusion
Future Work
Conclusion
Large number of input features predicting the rate of
dissolution is a complex problem.
Feature selection technique let us select most influencing
features among the available features without worsening the
performance.
Features extraction techniques provide a reduced set of new
features which performs better than when considering all the
features together.
We have analysed the performance of GPReg, LReg, MLP and
SMOReg.
Performance of GPReg is best which offers lowest average
RMSE and VAR with 10 selected features.
PCA used to reduce dimension to 30 offered best result using
MLP with lowest average RMSE and VAR.
12 / 14 Varun Ojha IBICA 2014
Introduction
Methodology
Experimental Results
Conclusions
Conclusion
Future Work
Future Work
Focus on the various types of stochastic feature selection
methods
Exploring different other types of regression models.
Study on making use of ensemble of elementary regression.
Comparison of ensemble methods.
13 / 14 Varun Ojha IBICA 2014
Introduction
Methodology
Experimental Results
Conclusions
Thank You!
varun.kumar.ojha.@vsb.cz
14 / 14 Varun Ojha IBICA 2014

Dimensionality Reduction and Prediction of the Protein Macromolecule Dissolution Pro le

  • 1.
    Introduction Methodology Experimental Results Conclusions Dimensionality Reductionand Prediction of the Protein Macromolecule Dissolution Profile V. K. Ojha, K. Jackowski, V. Sn´aˇsel and A. Abraham IT4Innovations VˇSB - Technical University of Ostrava Czech Republic 24 June 2014 1 / 14 Varun Ojha IBICA 2014
  • 2.
    Introduction Methodology Experimental Results Conclusions The problem Approach AComplete overview Introduction Problem: Prediction of the dissolution profile of Poly (Lactic-co-Glycolic Acid) (PLGA) micro- and nanoparticles. Motivation: PLGA microparticles are important diluents in the formulation of drugs in the dosage form. It act as an excipient in drug formation. It helps dissolution of the drugs, thus increases absorbability and solubility of drugs. It helps in pharmaceutical manufacturing process by improving APIs powder’s flowability and nonstickiness. 2 / 14 Varun Ojha IBICA 2014
  • 3.
    Introduction Methodology Experimental Results Conclusions The problem Approach AComplete overview Introduction Critical Issue: PLGA dissolution prediction is a complex problem as there are several potential factors influencing dissolution of PLGA protein particles. Collecting all such influencing factors leads to three hundred input features in dataset. Background: Szlkeket et al. 1 in their article offered a dataset with three hundred input features divided into four groups, namely protein descriptor, plasticizer, formulation characteristics, and emulsifier collected from various literature. Goal: Dimensionality reduction using feature selection/extraction and finding a suitable regression model. 1 Szlkek, J., Paclawski, A., Lau, R., Jachowicz, R., Mendyk, A.: Heuristic modeling of macromolecule release from PLGA microspheres. International journal of nanomedicine 8 (2013) 4601. 3 / 14 Varun Ojha IBICA 2014
  • 4.
    Introduction Methodology Experimental Results Conclusions The problem Approach AComplete overview Overview Dataset Dimension,Reduction Feature,Selection Feature,Extraction Linear Nonlinear PCA FA ICA kPCA MDS Prediction,Models,:GPReg,,LReg,,MLP,,SMORegT Results,of,10,Cross-validation,Sets, Select:,Dimension,Reduction,Technique Select:,Prediction,model Figure: A complete overview of the experimental setup 4 / 14 Varun Ojha IBICA 2014
  • 5.
    Introduction Methodology Experimental Results Conclusions Dimensionality Reduction RegressionModels Feature Selection Backward Feature Elimination (BFE) filter is used for feature elimination. BFE starts with maximum number feature in hand (in this case it starts with three hundred features) and eliminate features one by one in iterative manner. At each iteration, resulting accuracy of the prediction is evaluated for all combination of remaining attributes and subset of attributes with the highest accuracy is propagated to next iteration. The subset with the best accuracy is chosen. 5 / 14 Varun Ojha IBICA 2014
  • 6.
    Introduction Methodology Experimental Results Conclusions Dimensionality Reduction RegressionModels Feature Extraction Feature extraction helps in reducing computational overhead which may incurred due to use of complete input dimension. Principle Component Analysis (PCA) Factor Analysis (FA) Independent Component Analysis (ICA) Kernel PCA (kPCA) Multidimensional Scaling (MDS) 6 / 14 Varun Ojha IBICA 2014
  • 7.
    Introduction Methodology Experimental Results Conclusions Dimensionality Reduction RegressionModels Regression models Regression/Prediction model tries to figure out the relationship between input variables and output variable. Linear regression (LReg) Gaussian Process Regression (GPReg) Multilayer perceptron (MLP) Sequential Minimal Optimization Regression (SMOReg) 7 / 14 Varun Ojha IBICA 2014
  • 8.
    Introduction Methodology Experimental Results Conclusions Feature SelectionResults Feature Extraction Results Experimental results of feature selection technique 15.000 20.000 25.000 30.000 0.000 5.000 10.000 1 5 10 Optimal 300 Number of Selected Features AverageRMSE (a) 15.000 20.000 25.000 GPReg LReg 0.000 5.000 10.000 1 5 10 Optimal 300 LReg MLP SMOReg Number of Selected Features Variance (b) Figure: Experimental results of feature selection, comparison between the regression models. (a) comparison using average RMSE (b) comparison using variance. 8 / 14 Varun Ojha IBICA 2014
  • 9.
    Introduction Methodology Experimental Results Conclusions Feature SelectionResults Feature Extraction Results Experimental results of feature selection technique Table: Experimental results for 10cv datasets prepared with distinct random partitions of the complete dataset using feature selection technique (Identification of regression model) Note. Mean and variance (VAR) is computed on 10 RMSE obtained. Regression Reduced Number of Features Model 1 5 10 Optimal 300 Mean VAR Mean VAR Mean VAR Mean VAR Mean VAR GPReg 27.474 10.942 17.107 3.989 15.322 3.782 15.709 3.162 16.812 3.551 LReg 26.613 3.232 23.447 3.702 19.979 3.402 17.847 1.634 17.074 2.738 MLP 28.329 7.428 23.113 10.007 20.997 11.365 17.820 8.095 18.571 21.063 SMOReg 26.970 3.307 23.381 2.729 19.526 3.757 17.885 3.321 16.529 2.554 9 / 14 Varun Ojha IBICA 2014
  • 10.
    Introduction Methodology Experimental Results Conclusions Feature SelectionResults Feature Extraction Results Experimental results of feature extraction technique 20 25 30 35 0 5 10 15 20 ICA PCA FA kPCA MDS AverageRMSE (a) 5 6 7 8 9 GPReg 0 1 2 3 4 5 ICA PCA FA kPCA MDS LReg MLP SMOReg (b) Variance Figure: Experimental results of feature extraction with reduced dimension 30, comparison between the regression models. (a) comparison using average RMSE (b) comparison using variance. 10 / 14 Varun Ojha IBICA 2014
  • 11.
    Introduction Methodology Experimental Results Conclusions Feature SelectionResults Feature Extraction Results Experimental results of feature selection technique Table: Experimental results for 10cv datasets prepared with distinct random partitions of the complete dataset using feature selection technique (Identification of regression model) Note. Mean and variance (VAR) is computed on 10 RMSE obtained. Regression Reduced Number of Features Model ICA PCA FA kPCA MDS Mean VAR Mean VAR Mean VAR Mean VAR Mean VAR GPReg 14.826 3.612 16.636 3.160 28.314 3.338 24.955 1.965 28.413 3.155 LReg 17.233 2.340 17.170 2.790 29.970 1.766 25.348 2.048 29.192 2.079 MLP 13.945 2.765 13.590 1.560 31.010 1.825 27.067 4.090 29.925 3.105 SMOReg 17.925 2.875 17.660 1.560 30.257 3.373 25.900 1.700 29.641 2.758 11 / 14 Varun Ojha IBICA 2014
  • 12.
    Introduction Methodology Experimental Results Conclusions Conclusion Future Work Conclusion Largenumber of input features predicting the rate of dissolution is a complex problem. Feature selection technique let us select most influencing features among the available features without worsening the performance. Features extraction techniques provide a reduced set of new features which performs better than when considering all the features together. We have analysed the performance of GPReg, LReg, MLP and SMOReg. Performance of GPReg is best which offers lowest average RMSE and VAR with 10 selected features. PCA used to reduce dimension to 30 offered best result using MLP with lowest average RMSE and VAR. 12 / 14 Varun Ojha IBICA 2014
  • 13.
    Introduction Methodology Experimental Results Conclusions Conclusion Future Work FutureWork Focus on the various types of stochastic feature selection methods Exploring different other types of regression models. Study on making use of ensemble of elementary regression. Comparison of ensemble methods. 13 / 14 Varun Ojha IBICA 2014
  • 14.