Download to read offline
![Biswajit Bera / International Journal of Engineering Research and Applications
(IJERA) ISSN: 2248-9622 www.ijera.com
Vol. 3, Issue 2, March -April 2013, pp.687-692
Coefficient of Static Friction of Elastic-Plastic Micromechanical
Surface Contact
Biswajit Bera
(Department of Mechanical Engineering, National Institute of Technology Durgapur, India)
ABSTRACT
has developed classical adhesion theory of friction
In this study, the effect of elastic and
for plastically deformed spherical contact. These
plastic adhesion index on deformation force and
theories are revisited for present study of
friction force of MEMS surface contact has
multiasperity contact of adhesive MEMS surfaces.
investigated in term of surface roughness. It is
However, Fuller and Tabor [6], and K L Johnson [7]
found that at low value of θ, i.e. for smooth
have developed elastic adhesion index and plastic
surfaces, the contact is mostly elastic in nature
adhesion index respectively for multiasperity contact.
and at high value of θ, i.e. for rough surfaces,
Elastic and plastic adhesion index is basically a
mostly plastic contact occurs. This supports the
number which is developed combination of
elastic-plastic concept of Greenwood and
mechanical and tribological parameters of a material.
Williamson for rough surface contact. Total
Here, effect of both the adhesion index on
deformation force and friction force are mainly
deformation force and friction force of MEMS
supported by plastically deformed asperities.
surface contact has investigated in term of surface
From the study of coefficient of static friction of
roughness. Value of both the indices has considered
elastic-plastic MEMS surface contact, it is found
in small range so that study is limited to soft MEMS
that COF is almost constant of the order of value
surface contact. It should be mentioned that adhesive
of 0.4
force effect within contact zone of asperity with
respect to deformation force has neglected to avoid
Keywords – Adhesion index, Deformation force,
complexity of the study.
Friction force, Coefficient of friction
2. Theoretical Formulation
1. Introduction 2.1 Single Asperity Contact
Combined study of load and friction of
2.1.1Single asperity deformation force
rough surface contact is an important study in the
2.1.1a Single asperity elastic deformation force
field of Tribology. Empirical correlation in between
Hertzian Elastic loading force for a single asperity
load and friction was developed by Leonardo da
contact is given by
Vanci as well as Amontos [1] which are stated as 3
Kae
laws of friction. When two rough surfaces comes in Pae KR 0.5 1.5
contact due to application of normal force, contact R
occurs at the tip of asperities and finite tangential 2.1.1b Single Asperity Plastic Deformation
force is required for sliding motion which is measure Force
of friction force. Under normal loading condition, CEB Plastic loading force for a single asperity
asperities of rough surface contact would deform contact on the basis of volume conservation principle
elastically and also, plastically after critical value of is given by
deformation. Correspondingly, adhesive bond would Pap Aap Y R 2 c 0.6H
be developed at the contact zone of elastically and
plastically deformed asperity due to cold welding by 2.1.2 Single asperity friction force
interatomic adhesion at contact zone [2]. So, finite 2.1.2a Single Asperity Elastic Friction Force
force is required for shearing of adhesive asperity CEB elastic friction force for a single asperity
junction at real area of contact which is measure of contact on the basis of Hamilton stress field is given
friction force. First, Hertz developed the expression by
of loading force for elastically deformed spherical
contact and thereafter, Chang, Etsion, and Bogy [3]
Tae
1
27 0.5 c1
4 2Y 2 a e4 9c 2 Pae
2 2 0.5
developed expression of loading force for plastically
deformed spherical contact considering volume
1
5.2c1
4 2 0.6 H ae4 9c 2 Pae
2 2 2
0. 5
conservation. Also, Chang, Etsion, and Bogy [4] where
developed expression of friction force for elastically
2
c1 1 tan 1 1
3
deformed spherical contact considering Hamilton
stress field. On the other hand, Bowden and Tabor [5] 2 2 1 2
687 | P a g e](https://image.slidesharecdn.com/di32687692-130409052943-phpapp02/85/Di32687692-1-320.jpg)
![Biswajit Bera / International Journal of Engineering Research and Applications
(IJERA) ISSN: 2248-9622 www.ijera.com
Vol. 3, Issue 2, March -April 2013, pp.687-692
d c
(Take |C1| value)
( z )dz ( z )dz
c2 1 tan 1 1 1
3 c ( z )dz
2 1 2 d
d d c
Elasticasperities Plasticasperities
where η is number of total asperity per unit cross-
2.1.2b Single Asperity Plastic Friction Force sectional area and φ(z) is the Gaussian asperity height
Bowden and Tabor plastic friction force for a distribution function.
single asperity contact is given by
Tap Aap 2.2.1 Multiasperity Deformation Force
2.2.1a Multiasperity Elastic Deformation Force
R 2 c
Elastic deformation force due to multiasperity
contact is given by
d c
2.2 Multiasperity Contact Pe KR
0.5
1.5 z dz
First of all, Greenwood and Williamson [8] d
developed statistical multiasperity contact theory of Dividing both side byR , we have
rough surface under very low loading condition and it C
h 2
1
was assumed that asperities are deformed elastically P e 1.5 exp d
according to Hertz theory. Same theory is extended 0 2 2
here in elastic and plastic rough surface contact and it
is based on following assumptions: 2.2.1b Multiasperity Plastic Deformation Force
a) The rough surface is isotropic. Plastic deformation force due to multi asperity
b) Asperities are spherical near their contact is given by
summits.
Pp R 2 c H ( z )dz
c) All asperity summits have the same d c
radius R but their heights very randomly. Dividing both side by ηRγ, we have
d) Asperities are far apart and there is no
1 h 2
interaction between them. Pp 2.19 0.5 0.25 2 c exp d
e) Asperities are deformed elastically as c 2 2
well as plastically. Total deformation force due to all asperities is
f) There is no bulk deformation and only, given by
d c
the asperities deform during contact. c
P KR 0.5 1.5 z dz 0.6R 2 H z dz
d d
Flat plane c
Dividing both side by ηRγ, we have
δ C
1 h 2
0.5 0.25 c 1 h 2
P 1.5 exp d 2.19 2 exp d
Z 0 2 2 c 2 2
d
Mean 2.2.2 Multiasperity Friction Force
2.2.2a Multiasperity Elastic Friction Force
Rough surface
Elastic friction force for multiasprity is given by
d c
Te
1
5.2c1
4 2 0.6 H R 2 2 9c 2 K 2 R 3
2 2
0.5
z dz
d
Fig. 1 Rough surfaces contact
Multiasperity contact of elastic and plastic rough Dividing both side byR , we have
c
5.2c 19.2 2 9c 2 2 3 d
surface has shown in Fig.1. Two rough surface 1 0.5
Te 0.5 2
contact could be considered equivalently, contact 0 1
between rough surface and smooth rigid surface. Let z
and d represents the asperity height and separation of 2.2.2b Multiasperity Plastic Friction Force
the surfaces respectively, measured from the reference Plastic friction force for multiasprity is given by
plane defined by the mean of the asperity height. δ
Tp R 2 z dz
c
denotes deformation of asperity by flat surface.
Number of contacting asperity per unit cross-sectional d c
area is Dividing both side by ηRγ, we have
T p 3.65 0.25 0.5 2 c d
c H
688 | P a g e](https://image.slidesharecdn.com/di32687692-130409052943-phpapp02/85/Di32687692-2-320.jpg)
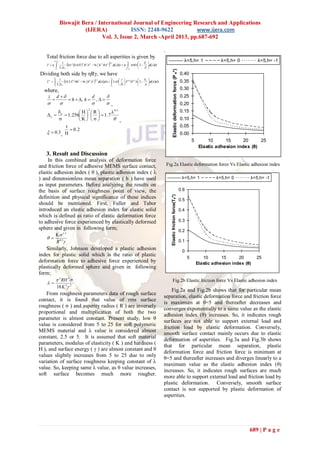

The study investigates the static friction of elastic-plastic micromechanical surface contact, focusing on the effects of elastic and plastic deformation forces on friction forces in microelectromechanical systems (MEMS) surfaces. It combines classical adhesion theory with multiasperity contact mechanics and is limited to soft MEMS surfaces, finding that the coefficient of friction remains around 0.4 within a certain range of parameters. Key findings highlight that for low surface roughness, contact is primarily elastic, while rough surfaces lead to predominantly plastic contact.