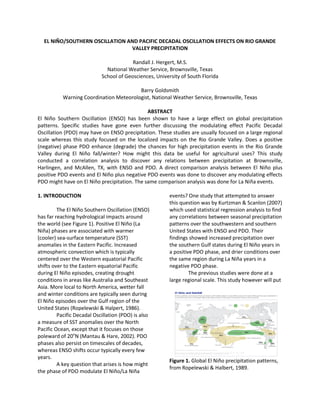
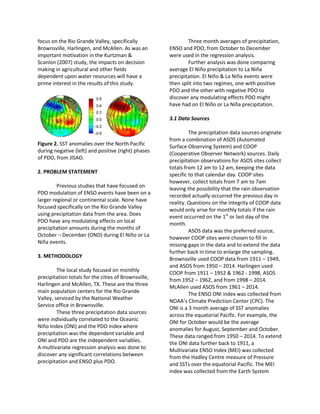
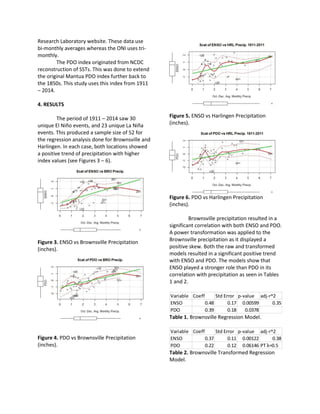
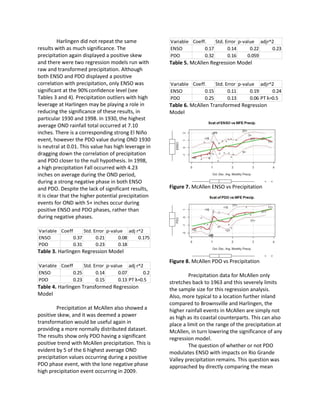
SlideShare a Scribd company logo
1 of 7
Download to read offline
EL NIÑO/SOUTHERN OSCILLATION AND PACIFIC DECADAL OSCILLATION EFFECTS ON RIO GRANDE
VALLEY PRECIPITATION
Randall J. Hergert, M.S.
National Weather Service, Brownsville, Texas
School of Geosciences, University of South Florida
Barry Goldsmith
Warning Coordination Meteorologist, National Weather Service, Brownsville, Texas
ABSTRACT
El Niño Southern Oscillation (ENSO) has been shown to have a large effect on global precipitation
patterns. Specific studies have gone even further discussing the modulating effect Pacific Decadal
Oscillation (PDO) may have on ENSO precipitation. These studies are usually focused on a large regional
scale whereas this study focused on the localized impacts on the Rio Grande Valley. Does a positive
(negative) phase PDO enhance (degrade) the chances for high precipitation events in the Rio Grande
Valley during El Niño fall/winter? How might this data be useful for agricultural uses? This study
conducted a correlation analysis to discover any relations between precipitation at Brownsville,
Harlingen, and McAllen, TX, with ENSO and PDO. A direct comparison analysis between El Niño plus
positive PDO events and El Niño plus negative PDO events was done to discover any modulating effects
PDO might have on El Niño precipitation. The same comparison analysis was done for La Niña events.
1. INTRODUCTION
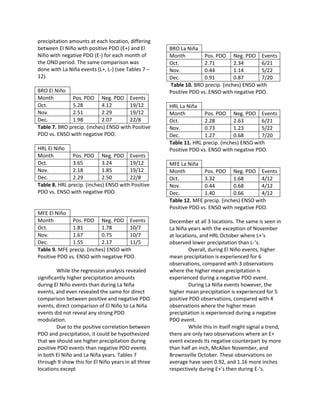
The El Niño Southern Oscillation (ENSO)
has far reaching hydrological impacts around
the world (see Figure 1). Positive El Niño (La
Niña) phases are associated with warmer
(cooler) sea-surface temperature (SST)
anomalies in the Eastern Pacific. Increased
atmospheric convection which is typically
centered over the Western equatorial Pacific
shifts over to the Eastern equatorial Pacific
during El Niño episodes, creating drought
conditions in areas like Australia and Southeast
Asia. More local to North America, wetter fall
and winter conditions are typically seen during
El Niño episodes over the Gulf region of the
United States (Ropelewski & Halpert, 1986).
Pacific Decadal Oscillation (PDO) is also
a measure of SST anomalies over the North
Pacific Ocean, except that it focuses on those
poleward of 20o
N (Mantau & Hare, 2002). PDO
phases also persist on timescales of decades,
whereas ENSO shifts occur typically every few
years.
A key question that arises is how might
the phase of PDO modulate El Niño/La Niña
events? One study that attempted to answer
this question was by Kurtzman & Scanlon (2007)
which used statistical regression analysis to find
any correlations between seasonal precipitation
patterns over the southwestern and southern
United States with ENSO and PDO. Their
findings showed increased precipitation over
the southern Gulf states during El Niño years in
a positive PDO phase, and drier conditions over
the same region during La Niña years in a
negative PDO phase.
The previous studies were done at a
large regional scale. This study however will put
Figure 1. Global El Niño precipitation patterns,
from Ropelewski & Halbert, 1989.
focus on the Rio Grande Valley, specifically
Brownsville, Harlingen, and McAllen. As was an
important motivation in the Kurtzman &
Scanlon (2007) study, the impacts on decision
making in agricultural and other fields
dependent upon water resources will have a
prime interest in the results of this study.
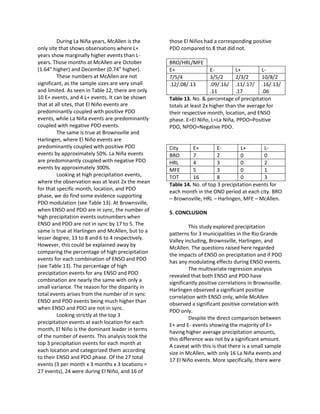
Figure 2. SST anomalies over the North Pacific
during negative (left) and positive (right) phases
of PDO, from JISAO.
2. PROBLEM STATEMENT
Previous studies that have focused on
PDO modulation of ENSO events have been on a
larger regional or continental scale. None have
focused specifically on the Rio Grande Valley
using precipitation data from the area. Does
PDO have any modulating effects on local
precipitation amounts during the months of
October – December (OND) during El Niño or La
Niña events.
3. METHODOLOGY
The local study focused on monthly
precipitation totals for the cities of Brownsville,
Harlingen and McAllen, TX. These are the three
main population centers for the Rio Grande
Valley, serviced by the National Weather
Service office in Brownsville.
These three precipitation data sources
were individually correlated to the Oceanic
Niño Index (ONI) and the PDO Index where
precipitation was the dependent variable and
ONI and PDO are the independent variables.
A multivariate regression analysis was done to
discover any significant correlations between
precipitation and ENSO plus PDO.
Three month averages of precipitation,
ENSO and PDO, from October to December
were used in the regression analysis.
Further analysis was done comparing
average El Niño precipitation to La Niña
precipitation. El Niño & La Niña events were
then split into two regimes, one with positive
PDO and the other with negative PDO to
discover any modulating effects PDO might
have had on El Niño or La Niña precipitation.
3.1 Data Sources
The precipitation data sources originate
from a combination of ASOS (Automated
Surface Observing System) and COOP
(Cooperative Observer Network) sources. Daily
precipitation observations for ASOS sites collect
totals from 12 am to 12 am, keeping the data
specific to that calendar day. COOP sites
however, collect totals from 7 am to 7am
leaving the possibility that the rain observation
recorded actually occurred the previous day in
reality. Questions on the integrity of COOP data
would only arise for monthly totals if the rain
event occurred on the 1st
or last day of the
month.
ASOS data was the preferred source,
however COOP sites were chosen to fill in
missing gaps in the data and to extend the data
further back in time to enlarge the sampling.
Brownsville used COOP data from 1911 – 1949,
and ASOS from 1950 – 2014. Harlingen used
COOP from 1911 – 1952 & 1962 - 1998, ASOS
from 1952 – 1962, and from 1998 – 2014.
McAllen used ASOS from 1961 – 2014.
The ENSO ONI index was collected from
NOAA’s Climate Prediction Center (CPC). The
ONI is a 3 month average of SST anomalies
across the equatorial Pacific. For example, the
ONI for October would be the average
anomalies for August, September and October.
These data ranged from 1950 – 2014. To extend
the ONI data further back to 1911, a
Multivariate ENSO Index (MEI) was collected
from the Hadley Centre measure of Pressure
and SSTs over the equatorial Pacific. The MEI
index was collected from the Earth System
Research Laboratory website. These data use
bi-monthly averages whereas the ONI uses tri-
monthly.
The PDO index originated from NCDC
reconstruction of SSTs. This was done to extend
the original Mantua PDO index further back to
the 1850s. This study uses this index from 1911
– 2014.
4. RESULTS
The period of 1911 – 2014 saw 30
unique El Niño events, and 23 unique La Niña
events. This produced a sample size of 52 for
the regression analysis done for Brownsville and
Harlingen. In each case, both locations showed
a positive trend of precipitation with higher
index values (see Figures 3 – 6).
Figure 3. ENSO vs Brownsville Precipitation
(inches).
Figure 4. PDO vs Brownsville Precipitation
(inches).
Figure 5. ENSO vs Harlingen Precipitation
(inches).
Figure 6. PDO vs Harlingen Precipitation
(inches).
Brownsville precipitation resulted in a
significant correlation with both ENSO and PDO.
A power transformation was applied to the
Brownsville precipitation as it displayed a
positive skew. Both the raw and transformed
models resulted in a significant positive trend
with ENSO and PDO. The models show that
ENSO played a stronger role than PDO in its
correlation with precipitation as seen in Tables
1 and 2.
Table 1. Brownsville Regression Model.
Table 2. Brownsville Transformed Regression
Model.
Variable Coeff Std Error p-value adj-r^2
ENSO 0.48 0.17 0.00599 0.35
PDO 0.39 0.18 0.0378
Variable Coeff Std Error p-value adj-r^2
ENSO 0.37 0.11 0.00122 0.38
PDO 0.22 0.12 0.06146 PT λ=0.5
Harlingen did not repeat the same
results with as much significance. The
precipitation again displayed a positive skew
and there were two regression models run with
raw and transformed precipitation. Although
both ENSO and PDO displayed a positive
correlation with precipitation, only ENSO was
significant at the 90%confidence level (see
Tables 3 and 4). Precipitation outliers with high
leverage at Harlingen may be playing a role in
reducing the significance of these results, in
particular 1930 and 1998. In 1930, the highest
average OND rainfall total occurred at 7.10
inches. There is a corresponding strong El Niño
event, however the PDO value during OND 1930
is neutral at 0.01. This value has high leverage in
dragging down the correlation of precipitation
and PDO closer to the null hypothesis. In 1998,
a high precipitation Fall occurred with 4.23
inches on average during the OND period,
during a strong negative phase in both ENSO
and PDO. Despite the lack of significant results,
it is clear that the higher potential precipitation
events for OND with 5+ inches occur during
positive ENSO and PDO phases, rather than
during negative phases.
Table 3. Harlingen Regression Model
Table 4. Harlingen Transformed Regression
Model
Precipitation at McAllen also showed a
positive skew, and it was deemed a power
transformation would be useful again in
providing a more normally distributed dataset.
The results show only PDO having a significant
positive trend with McAllen precipitation. This is
evident by 5 of the 6 highest average OND
precipitation values occurring during a positive
PDO phase event, with the lone negative phase
high precipitation event occurring in 2009.
Table 5. McAllen Regression Model
Table 6. McAllen Transformed Regression
Model
Figure 7. McAllen ENSO vs Precipitation
Figure 8. McAllen PDO vs Precipitation
Precipitation data for McAllen only
stretches back to 1963 and this severely limits
the sample size for this regression analysis.
Also, more typical to a location further inland
compared to Brownsville and Harlingen, the
higher rainfall events in McAllen are simply not
as high as its coastal counterparts. This can also
place a limit on the range of the precipitation at
McAllen, in turn lowering the significance of any
regression model.
The question of whether or not PDO
modulates ENSO with impacts on Rio Grande
Valley precipitation remains. This question was
approached by directly comparing the mean
Variable Coeff Std. Error p-value adj r^2
ENSO 0.37 0.21 0.08 0.175
PDO 0.31 0.23 0.18
Variable Coeff Std. Error p-value adj r^2
ENSO 0.25 0.14 0.07 0.2
PDO 0.23 0.15 0.13 PT λ=0.5
Variable Coeff. Std. Error p-value adjr^2
ENSO 0.17 0.14 0.22 0.23
PDO 0.32 0.16 0.059
Variable Coeff. Std. Error p-value adjr^2
ENSO 0.15 0.11 0.19 0.24
PDO 0.25 0.13 0.06 PT λ=0.5
precipitation amounts at each location, differing
between El Niño with positive PDO (E+) and El
Niño with negative PDO (E-) for each month of
the OND period. The same comparison was
done with La Niña events (L+, L-) (see Tables 7 –
12).
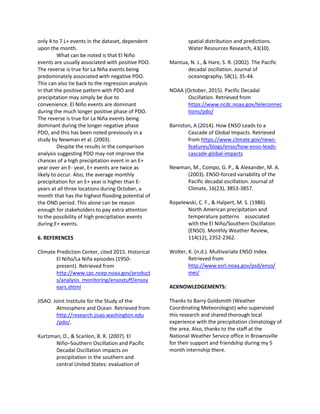
BRO El Niño
Month Pos. PDO Neg. PDO Events
Oct. 5.28 4.12 19/12
Nov. 2.51 2.29 19/12
Dec. 1.98 2.07 22/8
Table 7. BRO precip. (inches) ENSO with Positive
PDO vs. ENSO with negative PDO.
HRL El Niño
Month Pos. PDO Neg. PDO Events
Oct. 3.65 3.24 19/12
Nov. 2.18 1.85 19/12
Dec. 2.29 2.50 22/8
Table 8. HRL precip. (inches) ENSO with Positive
PDO vs. ENSO with negative PDO.
MFE El Niño
Month Pos. PDO Neg. PDO Events
Oct. 1.81 1.78 10/7
Nov. 1.67 0.75 10/7
Dec. 1.55 2.17 11/5
Table 9. MFE precip. (inches) ENSO with
Positive PDO vs. ENSO with negative PDO.
While the regression analysis revealed
significantly higher precipitation amounts
during El Niño events than during La Niña
events, and even revealed the same for direct
comparison between positive and negative PDO
events, direct comparison of El Niño to La Niña
events did not reveal any strong PDO
modulation.
Due to the positive correlation between
PDO and precipitation, it could be hypothesized
that we should see higher precipitation during
positive PDO events than negative PDO events
in both El Niño and La Niña years. Tables 7
through 9 show this for El Niño years in all three
locations except
BRO La Niña
Month Pos. PDO Neg. PDO Events
Oct. 2.71 2.34 6/21
Nov. 0.44 1.14 5/22
Dec. 0.91 0.87 7/20
Table 10. BRO precip. (inches) ENSO with
Positive PDO vs. ENSO with negative PDO.
HRL La Niña
Month Pos. PDO Neg. PDO Events
Oct. 2.28 2.63 6/21
Nov. 0.73 1.23 5/22
Dec. 1.27 0.68 7/20
Table 11. HRL precip. (inches) ENSO with
Positive PDO vs. ENSO with negative PDO.
MFE La Niña
Month Pos. PDO Neg. PDO Events
Oct. 3.32 1.68 4/12
Nov. 0.44 0.68 4/12
Dec. 1.40 0.66 4/12
Table 12. MFE precip. (inches) ENSO with
Positive PDO vs. ENSO with negative PDO.
December at all 3 locations. The same is seen in
La Niña years with the exception of November
at locations, and HRL October where L+‘s
observed lower precipitation than L-’s.
Overall, during El Niño events, higher
mean precipitation is experienced for 6
observations, compared with 3 observations
where the higher mean precipitation is
experienced during a negative PDO event.
During La Niña events however, the
higher mean precipitation is experienced for 5
positive PDO observations, compared with 4
observations where the higher mean
precipitation is experienced during a negative
PDO event.
While this in itself might signal a trend,
there are only two observations where an E+
event exceeds its negative counterpart by more
than half an inch, McAllen November, and
Brownsville October. These observations on
average have seen 0.92, and 1.16 more inches
respectively during E+’s then during E-‘s.
During La Niña years, McAllen is the
only site that shows observations where L+
years show marginally higher events than L-
years. Those months at McAllen are October
(1.64” higher) and December (0.74” higher).
These numbers at McAllen are not
significant, as the sample sizes are very small
and limited. As seen in Table 12, there are only
10 E+ events, and 4 L+ events. It can be shown
that at all sites, that El Niño events are
predominantly coupled with positive PDO
events, while La Niña events are predominantly
coupled with negative PDO events.
The same is true at Brownsville and
Harlingen, where El Niño events are
predominantly coupled with positive PDO
events by approximately 50%. La Niña events
are predominantly coupled with negative PDO
events by approximately 300%.
Looking at high precipitation events,
where the observation was at least 2x the mean
for that specific month, location, and PDO
phase, we do find some evidence supporting
PDO modulation (see Table 13). At Brownsville,
when ENSO and PDO are in sync, the number of
high precipitation events outnumbers when
ENSO and PDO are not in sync by 17 to 5. The
same is true at Harlingen and McAllen, but to a
lesser degree, 13 to 8 and 6 to 4 respectively.
However, this could be explained away by
comparing the percentage of high precipitation
events for each combination of ENSO and PDO
(see Table 13). The percentage of high
precipitation events for any ENSO and PDO
combination are nearly the same with only a
small variance. The reason for the disparity in
total events arises from the number of in sync
ENSO and PDO events being much higher than
when ENSO and PDO are not in sync.
Looking strictly at the top 3
precipitation events at each location for each
month, El Niño is the dominant leader in terms
of the number of events. This analysis took the
top 3 precipitation events for each month at
each location and categorized them according
to their ENSO and PDO phase. Of the 27 total
events (3 per month x 3 months x 3 locations =
27 events), 24 were during El Niño, and 16 of
those El Niños had a corresponding positive
PDO compared to 8 that did not.
BRO/HRL/MFE
E+ E- L+ L-
7/5/4 3/5/2 2/3/2 10/8/2
.12/.08/.13 .09/.16/
.11
.11/.17/
.17
.16/.13/
.06
Table 13. No. & percentage of precipitation
totals at least 2x higher than the average for
their respective month, location, and ENSO
phase. E=El Niño, L=La Niña, PPDO=Positive
PDO, NPDO=Negative PDO.
City E+ E- L+ L-
BRO 7 2 0 0
HRL 4 3 0 2
MFE 5 3 0 1
TOT 16 8 0 3
Table 14. No. of top 3 precipitation events for
each month in the OND period at each city. BRO
– Brownsville, HRL – Harlingen, MFE – McAllen.
5. CONCLUSION
This study explored precipitation
patterns for 3 municipalities in the Rio Grande
Valley including, Brownsville, Harlingen, and
McAllen. The questions raised here regarded
the impacts of ENSO on precipitation and if PDO
has any modulating effects during ENSO events.
The multivariate regression analysis
revealed that both ENSO and PDO have
significantly positive correlations in Brownsville.
Harlingen observed a significant positive
correlation with ENSO only, while McAllen
observed a significant positive correlation with
PDO only.
Despite the direct comparison between
E+ and E- events showing the majority of E+
having higher average precipitation amounts,
this difference was not by a significant amount.
A caveat with this is that there is a small sample
size in McAllen, with only 16 La Niña events and
17 El Niño events. More specifically, there were
only 4 to 7 L+ events in the dataset, dependent
upon the month.
What can be noted is that El Niño
events are usually associated with positive PDO.
The reverse is true for La Niña events being
predominately associated with negative PDO.
This can also tie back to the regression analysis
in that the positive pattern with PDO and
precipitation may simply be due to
convenience. El Niño events are dominant
during the much longer positive phase of PDO.
The reverse is true for La Niña events being
dominant during the longer negative phase
PDO, and this has been noted previously in a
study by Newman et al. (2003).
Despite the results in the comparison
analysis suggesting PDO may not improve the
chances of a high precipitation event in an E+
year over an E- year, E+ events are twice as
likely to occur. Also, the average monthly
precipitation for an E+ year is higher than E-
years at all three locations during October, a
month that has the highest flooding potential of
the OND period. This alone can be reason
enough for stakeholders to pay extra attention
to the possibility of high precipitation events
during E+ events.
6. REFERENCES
Climate Prediction Center, cited 2015. Historical
El Niño/La Niña episodes (1950-
present). Retrieved from
http://www.cpc.ncep.noaa.gov/product
s/analysis_monitoring/ensostuff/ensoy
ears.shtml
JISAO. Joint Institute for the Study of the
Atmosphere and Ocean. Retrieved from
http://research.jisao.washington.edu
/pdo/.
Kurtzman, D., & Scanlon, B. R. (2007). El
Niño–Southern Oscillation and Pacific
Decadal Oscillation impacts on
precipitation in the southern and
central United States: evaluation of
spatial distribution and predictions.
Water Resources Research, 43(10).
Mantua, N. J., & Hare, S. R. (2002). The Pacific
decadal oscillation. Journal of
oceanography, 58(1), 35-44.
NOAA (October, 2015). Pacific Decadal
Oscillation. Retrieved from
https://www.ncdc.noaa.gov/teleconnec
tions/pdo/
Barnston, A (2014). How ENSO Leads to a
Cascade of Global Impacts. Retrieved
from https://www.climate.gov/news-
features/blogs/enso/how-enso-leads-
cascade-global-impacts
Newman, M., Compo, G. P., & Alexander, M. A.
(2003). ENSO-forced variability of the
Pacific decadal oscillation. Journal of
Climate, 16(23), 3853-3857.
Ropelewski, C. F., & Halpert, M. S. (1986).
North American precipitation and
temperature patterns associated
with the El Niño/Southern Oscillation
(ENSO). Monthly Weather Review,
114(12), 2352-2362.
Wolter, K. (n.d.). Multivariate ENSO Index.
Retrieved from
http://www.esrl.noaa.gov/psd/enso/
mei/
ACKNOWLEDGEMENTS:
Thanks to Barry Goldsmith (Weather
Coordinating Meteorologist) who supervised
this research and shared thorough local
experience with the precipitation climatology of
the area. Also, thanks to the staff at the
National Weather Service office in Brownsville
for their support and friendship during my 5
month internship there.

More Related Content

What's hot

IonE Frontiers, Through The Trees
IonE Frontiers, Through The TreesIonE Frontiers, Through The Trees
IonE Frontiers, Through The TreesScott St. George
 
Öncel Akademi: İstatistiksel Sismoloji
Öncel Akademi: İstatistiksel SismolojiÖncel Akademi: İstatistiksel Sismoloji
Öncel Akademi: İstatistiksel SismolojiAli Osman Öncel
 
Climate Change Scenarios for Tourist Destinations in the Bahamas: Eluthrea
Climate Change Scenarios for Tourist Destinations in the Bahamas: EluthreaClimate Change Scenarios for Tourist Destinations in the Bahamas: Eluthrea
Climate Change Scenarios for Tourist Destinations in the Bahamas: Eluthreaintasave-caribsavegroup
 
Eops 2016 04_06
Eops 2016 04_06Eops 2016 04_06
Eops 2016 04_06EOPS EOPS
 
The "Year Without A Summer" was not a year without a ring
The "Year Without A Summer" was not a year without a ringThe "Year Without A Summer" was not a year without a ring
The "Year Without A Summer" was not a year without a ringScott St. George
 
Seeing the Forest for the Tree(Ring)s
Seeing the Forest for the Tree(Ring)sSeeing the Forest for the Tree(Ring)s
Seeing the Forest for the Tree(Ring)sScott St. George
 
Water Supply Assessments in Arid Environments, A GIS Solution
Water Supply Assessments in Arid Environments, A GIS SolutionWater Supply Assessments in Arid Environments, A GIS Solution
Water Supply Assessments in Arid Environments, A GIS SolutionJoe Zilles
 
A rank reduced analysis of runoff components and their response patterns to ...
A rank  reduced analysis of runoff components and their response patterns to ...A rank  reduced analysis of runoff components and their response patterns to ...
A rank reduced analysis of runoff components and their response patterns to ...Alexander Decker
 
Lheureux ensooperations
Lheureux ensooperationsLheureux ensooperations
Lheureux ensooperationsESTHHUB
 
Relation between Ground-based Soil Moisture and Satellite Image-based NDVI
Relation between Ground-based Soil Moisture and Satellite Image-based NDVIRelation between Ground-based Soil Moisture and Satellite Image-based NDVI
Relation between Ground-based Soil Moisture and Satellite Image-based NDVISumant Diwakar
 
Larsen ice shelf has progressively thinned
Larsen ice shelf has progressively thinnedLarsen ice shelf has progressively thinned
Larsen ice shelf has progressively thinnedSimoneBoccuccia
 
Projections of Future Tropical Cyclone Activity
Projections of Future Tropical Cyclone ActivityProjections of Future Tropical Cyclone Activity
Projections of Future Tropical Cyclone Activityriseagrant
 

What's hot (20)

IonE Frontiers, Through The Trees
IonE Frontiers, Through The TreesIonE Frontiers, Through The Trees
IonE Frontiers, Through The Trees
 
Öncel Akademi: İstatistiksel Sismoloji
Öncel Akademi: İstatistiksel SismolojiÖncel Akademi: İstatistiksel Sismoloji
Öncel Akademi: İstatistiksel Sismoloji
 
Climate Change Scenarios for Tourist Destinations in the Bahamas: Eluthrea
Climate Change Scenarios for Tourist Destinations in the Bahamas: EluthreaClimate Change Scenarios for Tourist Destinations in the Bahamas: Eluthrea
Climate Change Scenarios for Tourist Destinations in the Bahamas: Eluthrea
 
Eops 2016 04_06
Eops 2016 04_06Eops 2016 04_06
Eops 2016 04_06
 
The "Year Without A Summer" was not a year without a ring
The "Year Without A Summer" was not a year without a ringThe "Year Without A Summer" was not a year without a ring
The "Year Without A Summer" was not a year without a ring
 
Seeing the Forest for the Tree(Ring)s
Seeing the Forest for the Tree(Ring)sSeeing the Forest for the Tree(Ring)s
Seeing the Forest for the Tree(Ring)s
 
Making Climate Data Sing
Making Climate Data SingMaking Climate Data Sing
Making Climate Data Sing
 
2003_NEXRAD_Negley
2003_NEXRAD_Negley2003_NEXRAD_Negley
2003_NEXRAD_Negley
 
Water Supply Assessments in Arid Environments, A GIS Solution
Water Supply Assessments in Arid Environments, A GIS SolutionWater Supply Assessments in Arid Environments, A GIS Solution
Water Supply Assessments in Arid Environments, A GIS Solution
 
An Expanded Critique of Some Climate Conclusions
An Expanded Critique of Some Climate ConclusionsAn Expanded Critique of Some Climate Conclusions
An Expanded Critique of Some Climate Conclusions
 
A rank reduced analysis of runoff components and their response patterns to ...
A rank  reduced analysis of runoff components and their response patterns to ...A rank  reduced analysis of runoff components and their response patterns to ...
A rank reduced analysis of runoff components and their response patterns to ...
 
A Defense of Jim Hansen's Climate Conclusions
A Defense of Jim Hansen's Climate ConclusionsA Defense of Jim Hansen's Climate Conclusions
A Defense of Jim Hansen's Climate Conclusions
 
You Liangzhi — Delayed impact of the north atlantic oscillation on biosphere ...
You Liangzhi — Delayed impact of the north atlantic oscillation on biosphere ...You Liangzhi — Delayed impact of the north atlantic oscillation on biosphere ...
You Liangzhi — Delayed impact of the north atlantic oscillation on biosphere ...
 
Lheureux ensooperations
Lheureux ensooperationsLheureux ensooperations
Lheureux ensooperations
 
Relation between Ground-based Soil Moisture and Satellite Image-based NDVI
Relation between Ground-based Soil Moisture and Satellite Image-based NDVIRelation between Ground-based Soil Moisture and Satellite Image-based NDVI
Relation between Ground-based Soil Moisture and Satellite Image-based NDVI
 
Climate changes in Central Asia (agriculture activity impact)
Climate changes in Central Asia (agriculture activity impact)Climate changes in Central Asia (agriculture activity impact)
Climate changes in Central Asia (agriculture activity impact)
 
#1
#1#1
#1
 
Larsen ice shelf has progressively thinned
Larsen ice shelf has progressively thinnedLarsen ice shelf has progressively thinned
Larsen ice shelf has progressively thinned
 
Shrestha_Hopkin'sLaw
Shrestha_Hopkin'sLawShrestha_Hopkin'sLaw
Shrestha_Hopkin'sLaw
 
Projections of Future Tropical Cyclone Activity
Projections of Future Tropical Cyclone ActivityProjections of Future Tropical Cyclone Activity
Projections of Future Tropical Cyclone Activity
 

Similar to ENSO and PDO Effects on Rio Grande Valley Precipitation

Impact of Climate Modes such as El Nino on Australian Rainfall
Impact of Climate Modes such as El Nino on Australian RainfallImpact of Climate Modes such as El Nino on Australian Rainfall
Impact of Climate Modes such as El Nino on Australian RainfallAlexander Pui
 
Responding to Climate Change: Impacts, Uncertainty and Adaptation - lecture 1...
Responding to Climate Change: Impacts, Uncertainty and Adaptation - lecture 1...Responding to Climate Change: Impacts, Uncertainty and Adaptation - lecture 1...
Responding to Climate Change: Impacts, Uncertainty and Adaptation - lecture 1...Jose M. Molina
 
diurnal temperature range trend over North Carolina and the associated mechan...
diurnal temperature range trend over North Carolina and the associated mechan...diurnal temperature range trend over North Carolina and the associated mechan...
diurnal temperature range trend over North Carolina and the associated mechan...Sayem Zaman, Ph.D, PE.
 
Accounting for Wetlands Loss in a Changing Climate in the Estimation of Long...
Accounting for Wetlands Loss in a  Changing Climate in the Estimation of Long...Accounting for Wetlands Loss in a  Changing Climate in the Estimation of Long...
Accounting for Wetlands Loss in a Changing Climate in the Estimation of Long...Sergey Gulbin
 
Islam Intel poster FINAL
Islam Intel poster FINALIslam Intel poster FINAL
Islam Intel poster FINALTahsina Islam
 
Abstract Master Thesis
Abstract Master ThesisAbstract Master Thesis
Abstract Master ThesisTracy Drey
 
UCLA THESIS_Vrsalovich_condensed
UCLA THESIS_Vrsalovich_condensedUCLA THESIS_Vrsalovich_condensed
UCLA THESIS_Vrsalovich_condensedJohn Vrsalovich
 
Tesfaye Samuel Presentation- MERGED.pptx
Tesfaye Samuel Presentation- MERGED.pptxTesfaye Samuel Presentation- MERGED.pptx
Tesfaye Samuel Presentation- MERGED.pptxTesfaye Samuel
 
PROJECT OF THE TITLE PROPOSAL FINL FOR COFFE
PROJECT OF THE TITLE PROPOSAL FINL FOR COFFEPROJECT OF THE TITLE PROPOSAL FINL FOR COFFE
PROJECT OF THE TITLE PROPOSAL FINL FOR COFFEterefa1234
 
Climate Change and Vegetation
Climate Change and VegetationClimate Change and Vegetation
Climate Change and VegetationGDCKUL
 
Effects of climate change on the emmission of n2o
Effects of climate change on the emmission of n2oEffects of climate change on the emmission of n2o
Effects of climate change on the emmission of n2oaparmar85
 
DoD Poster Howell 2010
DoD Poster Howell 2010DoD Poster Howell 2010
DoD Poster Howell 2010kehowell
 
Identification of three_dominant_rainfall_regions_
Identification of three_dominant_rainfall_regions_Identification of three_dominant_rainfall_regions_
Identification of three_dominant_rainfall_regions_Lasriama Siahaan
 
Contributors to the frequency of intense climate disasters in asia pacific co...
Contributors to the frequency of intense climate disasters in asia pacific co...Contributors to the frequency of intense climate disasters in asia pacific co...
Contributors to the frequency of intense climate disasters in asia pacific co...Mario Robusti
 

Similar to ENSO and PDO Effects on Rio Grande Valley Precipitation (20)

huber_2011_RSE
huber_2011_RSEhuber_2011_RSE
huber_2011_RSE
 
RDG-ENSO-Final (1)
RDG-ENSO-Final (1)RDG-ENSO-Final (1)
RDG-ENSO-Final (1)
 
B1060612
B1060612B1060612
B1060612
 
Impact of Climate Modes such as El Nino on Australian Rainfall
Impact of Climate Modes such as El Nino on Australian RainfallImpact of Climate Modes such as El Nino on Australian Rainfall
Impact of Climate Modes such as El Nino on Australian Rainfall
 
Responding to Climate Change: Impacts, Uncertainty and Adaptation - lecture 1...
Responding to Climate Change: Impacts, Uncertainty and Adaptation - lecture 1...Responding to Climate Change: Impacts, Uncertainty and Adaptation - lecture 1...
Responding to Climate Change: Impacts, Uncertainty and Adaptation - lecture 1...
 
Usgs Phen Drought Sheet
Usgs Phen Drought SheetUsgs Phen Drought Sheet
Usgs Phen Drought Sheet
 
diurnal temperature range trend over North Carolina and the associated mechan...
diurnal temperature range trend over North Carolina and the associated mechan...diurnal temperature range trend over North Carolina and the associated mechan...
diurnal temperature range trend over North Carolina and the associated mechan...
 
Accounting for Wetlands Loss in a Changing Climate in the Estimation of Long...
Accounting for Wetlands Loss in a  Changing Climate in the Estimation of Long...Accounting for Wetlands Loss in a  Changing Climate in the Estimation of Long...
Accounting for Wetlands Loss in a Changing Climate in the Estimation of Long...
 
Islam Intel poster FINAL
Islam Intel poster FINALIslam Intel poster FINAL
Islam Intel poster FINAL
 
Abstract Master Thesis
Abstract Master ThesisAbstract Master Thesis
Abstract Master Thesis
 
UCLA THESIS_Vrsalovich_condensed
UCLA THESIS_Vrsalovich_condensedUCLA THESIS_Vrsalovich_condensed
UCLA THESIS_Vrsalovich_condensed
 
Tesfaye Samuel Presentation- MERGED.pptx
Tesfaye Samuel Presentation- MERGED.pptxTesfaye Samuel Presentation- MERGED.pptx
Tesfaye Samuel Presentation- MERGED.pptx
 
PROJECT OF THE TITLE PROPOSAL FINL FOR COFFE
PROJECT OF THE TITLE PROPOSAL FINL FOR COFFEPROJECT OF THE TITLE PROPOSAL FINL FOR COFFE
PROJECT OF THE TITLE PROPOSAL FINL FOR COFFE
 
Nwp final paper
Nwp final paperNwp final paper
Nwp final paper
 
Climate Change and Vegetation
Climate Change and VegetationClimate Change and Vegetation
Climate Change and Vegetation
 
129
129129
129
 
Effects of climate change on the emmission of n2o
Effects of climate change on the emmission of n2oEffects of climate change on the emmission of n2o
Effects of climate change on the emmission of n2o
 
DoD Poster Howell 2010
DoD Poster Howell 2010DoD Poster Howell 2010
DoD Poster Howell 2010
 
Identification of three_dominant_rainfall_regions_
Identification of three_dominant_rainfall_regions_Identification of three_dominant_rainfall_regions_
Identification of three_dominant_rainfall_regions_
 
Contributors to the frequency of intense climate disasters in asia pacific co...
Contributors to the frequency of intense climate disasters in asia pacific co...Contributors to the frequency of intense climate disasters in asia pacific co...
Contributors to the frequency of intense climate disasters in asia pacific co...
 

ENSO and PDO Effects on Rio Grande Valley Precipitation

  • 1. EL NIÑO/SOUTHERN OSCILLATION AND PACIFIC DECADAL OSCILLATION EFFECTS ON RIO GRANDE VALLEY PRECIPITATION Randall J. Hergert, M.S. National Weather Service, Brownsville, Texas School of Geosciences, University of South Florida Barry Goldsmith Warning Coordination Meteorologist, National Weather Service, Brownsville, Texas ABSTRACT El Niño Southern Oscillation (ENSO) has been shown to have a large effect on global precipitation patterns. Specific studies have gone even further discussing the modulating effect Pacific Decadal Oscillation (PDO) may have on ENSO precipitation. These studies are usually focused on a large regional scale whereas this study focused on the localized impacts on the Rio Grande Valley. Does a positive (negative) phase PDO enhance (degrade) the chances for high precipitation events in the Rio Grande Valley during El Niño fall/winter? How might this data be useful for agricultural uses? This study conducted a correlation analysis to discover any relations between precipitation at Brownsville, Harlingen, and McAllen, TX, with ENSO and PDO. A direct comparison analysis between El Niño plus positive PDO events and El Niño plus negative PDO events was done to discover any modulating effects PDO might have on El Niño precipitation. The same comparison analysis was done for La Niña events. 1. INTRODUCTION The El Niño Southern Oscillation (ENSO) has far reaching hydrological impacts around the world (see Figure 1). Positive El Niño (La Niña) phases are associated with warmer (cooler) sea-surface temperature (SST) anomalies in the Eastern Pacific. Increased atmospheric convection which is typically centered over the Western equatorial Pacific shifts over to the Eastern equatorial Pacific during El Niño episodes, creating drought conditions in areas like Australia and Southeast Asia. More local to North America, wetter fall and winter conditions are typically seen during El Niño episodes over the Gulf region of the United States (Ropelewski & Halpert, 1986). Pacific Decadal Oscillation (PDO) is also a measure of SST anomalies over the North Pacific Ocean, except that it focuses on those poleward of 20o N (Mantau & Hare, 2002). PDO phases also persist on timescales of decades, whereas ENSO shifts occur typically every few years. A key question that arises is how might the phase of PDO modulate El Niño/La Niña events? One study that attempted to answer this question was by Kurtzman & Scanlon (2007) which used statistical regression analysis to find any correlations between seasonal precipitation patterns over the southwestern and southern United States with ENSO and PDO. Their findings showed increased precipitation over the southern Gulf states during El Niño years in a positive PDO phase, and drier conditions over the same region during La Niña years in a negative PDO phase. The previous studies were done at a large regional scale. This study however will put Figure 1. Global El Niño precipitation patterns, from Ropelewski & Halbert, 1989.
  • 2. focus on the Rio Grande Valley, specifically Brownsville, Harlingen, and McAllen. As was an important motivation in the Kurtzman & Scanlon (2007) study, the impacts on decision making in agricultural and other fields dependent upon water resources will have a prime interest in the results of this study. Figure 2. SST anomalies over the North Pacific during negative (left) and positive (right) phases of PDO, from JISAO. 2. PROBLEM STATEMENT Previous studies that have focused on PDO modulation of ENSO events have been on a larger regional or continental scale. None have focused specifically on the Rio Grande Valley using precipitation data from the area. Does PDO have any modulating effects on local precipitation amounts during the months of October – December (OND) during El Niño or La Niña events. 3. METHODOLOGY The local study focused on monthly precipitation totals for the cities of Brownsville, Harlingen and McAllen, TX. These are the three main population centers for the Rio Grande Valley, serviced by the National Weather Service office in Brownsville. These three precipitation data sources were individually correlated to the Oceanic Niño Index (ONI) and the PDO Index where precipitation was the dependent variable and ONI and PDO are the independent variables. A multivariate regression analysis was done to discover any significant correlations between precipitation and ENSO plus PDO. Three month averages of precipitation, ENSO and PDO, from October to December were used in the regression analysis. Further analysis was done comparing average El Niño precipitation to La Niña precipitation. El Niño & La Niña events were then split into two regimes, one with positive PDO and the other with negative PDO to discover any modulating effects PDO might have had on El Niño or La Niña precipitation. 3.1 Data Sources The precipitation data sources originate from a combination of ASOS (Automated Surface Observing System) and COOP (Cooperative Observer Network) sources. Daily precipitation observations for ASOS sites collect totals from 12 am to 12 am, keeping the data specific to that calendar day. COOP sites however, collect totals from 7 am to 7am leaving the possibility that the rain observation recorded actually occurred the previous day in reality. Questions on the integrity of COOP data would only arise for monthly totals if the rain event occurred on the 1st or last day of the month. ASOS data was the preferred source, however COOP sites were chosen to fill in missing gaps in the data and to extend the data further back in time to enlarge the sampling. Brownsville used COOP data from 1911 – 1949, and ASOS from 1950 – 2014. Harlingen used COOP from 1911 – 1952 & 1962 - 1998, ASOS from 1952 – 1962, and from 1998 – 2014. McAllen used ASOS from 1961 – 2014. The ENSO ONI index was collected from NOAA’s Climate Prediction Center (CPC). The ONI is a 3 month average of SST anomalies across the equatorial Pacific. For example, the ONI for October would be the average anomalies for August, September and October. These data ranged from 1950 – 2014. To extend the ONI data further back to 1911, a Multivariate ENSO Index (MEI) was collected from the Hadley Centre measure of Pressure and SSTs over the equatorial Pacific. The MEI index was collected from the Earth System
  • 3. Research Laboratory website. These data use bi-monthly averages whereas the ONI uses tri- monthly. The PDO index originated from NCDC reconstruction of SSTs. This was done to extend the original Mantua PDO index further back to the 1850s. This study uses this index from 1911 – 2014. 4. RESULTS The period of 1911 – 2014 saw 30 unique El Niño events, and 23 unique La Niña events. This produced a sample size of 52 for the regression analysis done for Brownsville and Harlingen. In each case, both locations showed a positive trend of precipitation with higher index values (see Figures 3 – 6). Figure 3. ENSO vs Brownsville Precipitation (inches). Figure 4. PDO vs Brownsville Precipitation (inches). Figure 5. ENSO vs Harlingen Precipitation (inches). Figure 6. PDO vs Harlingen Precipitation (inches). Brownsville precipitation resulted in a significant correlation with both ENSO and PDO. A power transformation was applied to the Brownsville precipitation as it displayed a positive skew. Both the raw and transformed models resulted in a significant positive trend with ENSO and PDO. The models show that ENSO played a stronger role than PDO in its correlation with precipitation as seen in Tables 1 and 2. Table 1. Brownsville Regression Model. Table 2. Brownsville Transformed Regression Model. Variable Coeff Std Error p-value adj-r^2 ENSO 0.48 0.17 0.00599 0.35 PDO 0.39 0.18 0.0378 Variable Coeff Std Error p-value adj-r^2 ENSO 0.37 0.11 0.00122 0.38 PDO 0.22 0.12 0.06146 PT λ=0.5
  • 4. Harlingen did not repeat the same results with as much significance. The precipitation again displayed a positive skew and there were two regression models run with raw and transformed precipitation. Although both ENSO and PDO displayed a positive correlation with precipitation, only ENSO was significant at the 90%confidence level (see Tables 3 and 4). Precipitation outliers with high leverage at Harlingen may be playing a role in reducing the significance of these results, in particular 1930 and 1998. In 1930, the highest average OND rainfall total occurred at 7.10 inches. There is a corresponding strong El Niño event, however the PDO value during OND 1930 is neutral at 0.01. This value has high leverage in dragging down the correlation of precipitation and PDO closer to the null hypothesis. In 1998, a high precipitation Fall occurred with 4.23 inches on average during the OND period, during a strong negative phase in both ENSO and PDO. Despite the lack of significant results, it is clear that the higher potential precipitation events for OND with 5+ inches occur during positive ENSO and PDO phases, rather than during negative phases. Table 3. Harlingen Regression Model Table 4. Harlingen Transformed Regression Model Precipitation at McAllen also showed a positive skew, and it was deemed a power transformation would be useful again in providing a more normally distributed dataset. The results show only PDO having a significant positive trend with McAllen precipitation. This is evident by 5 of the 6 highest average OND precipitation values occurring during a positive PDO phase event, with the lone negative phase high precipitation event occurring in 2009. Table 5. McAllen Regression Model Table 6. McAllen Transformed Regression Model Figure 7. McAllen ENSO vs Precipitation Figure 8. McAllen PDO vs Precipitation Precipitation data for McAllen only stretches back to 1963 and this severely limits the sample size for this regression analysis. Also, more typical to a location further inland compared to Brownsville and Harlingen, the higher rainfall events in McAllen are simply not as high as its coastal counterparts. This can also place a limit on the range of the precipitation at McAllen, in turn lowering the significance of any regression model. The question of whether or not PDO modulates ENSO with impacts on Rio Grande Valley precipitation remains. This question was approached by directly comparing the mean Variable Coeff Std. Error p-value adj r^2 ENSO 0.37 0.21 0.08 0.175 PDO 0.31 0.23 0.18 Variable Coeff Std. Error p-value adj r^2 ENSO 0.25 0.14 0.07 0.2 PDO 0.23 0.15 0.13 PT λ=0.5 Variable Coeff. Std. Error p-value adjr^2 ENSO 0.17 0.14 0.22 0.23 PDO 0.32 0.16 0.059 Variable Coeff. Std. Error p-value adjr^2 ENSO 0.15 0.11 0.19 0.24 PDO 0.25 0.13 0.06 PT λ=0.5
  • 5. precipitation amounts at each location, differing between El Niño with positive PDO (E+) and El Niño with negative PDO (E-) for each month of the OND period. The same comparison was done with La Niña events (L+, L-) (see Tables 7 – 12). BRO El Niño Month Pos. PDO Neg. PDO Events Oct. 5.28 4.12 19/12 Nov. 2.51 2.29 19/12 Dec. 1.98 2.07 22/8 Table 7. BRO precip. (inches) ENSO with Positive PDO vs. ENSO with negative PDO. HRL El Niño Month Pos. PDO Neg. PDO Events Oct. 3.65 3.24 19/12 Nov. 2.18 1.85 19/12 Dec. 2.29 2.50 22/8 Table 8. HRL precip. (inches) ENSO with Positive PDO vs. ENSO with negative PDO. MFE El Niño Month Pos. PDO Neg. PDO Events Oct. 1.81 1.78 10/7 Nov. 1.67 0.75 10/7 Dec. 1.55 2.17 11/5 Table 9. MFE precip. (inches) ENSO with Positive PDO vs. ENSO with negative PDO. While the regression analysis revealed significantly higher precipitation amounts during El Niño events than during La Niña events, and even revealed the same for direct comparison between positive and negative PDO events, direct comparison of El Niño to La Niña events did not reveal any strong PDO modulation. Due to the positive correlation between PDO and precipitation, it could be hypothesized that we should see higher precipitation during positive PDO events than negative PDO events in both El Niño and La Niña years. Tables 7 through 9 show this for El Niño years in all three locations except BRO La Niña Month Pos. PDO Neg. PDO Events Oct. 2.71 2.34 6/21 Nov. 0.44 1.14 5/22 Dec. 0.91 0.87 7/20 Table 10. BRO precip. (inches) ENSO with Positive PDO vs. ENSO with negative PDO. HRL La Niña Month Pos. PDO Neg. PDO Events Oct. 2.28 2.63 6/21 Nov. 0.73 1.23 5/22 Dec. 1.27 0.68 7/20 Table 11. HRL precip. (inches) ENSO with Positive PDO vs. ENSO with negative PDO. MFE La Niña Month Pos. PDO Neg. PDO Events Oct. 3.32 1.68 4/12 Nov. 0.44 0.68 4/12 Dec. 1.40 0.66 4/12 Table 12. MFE precip. (inches) ENSO with Positive PDO vs. ENSO with negative PDO. December at all 3 locations. The same is seen in La Niña years with the exception of November at locations, and HRL October where L+‘s observed lower precipitation than L-’s. Overall, during El Niño events, higher mean precipitation is experienced for 6 observations, compared with 3 observations where the higher mean precipitation is experienced during a negative PDO event. During La Niña events however, the higher mean precipitation is experienced for 5 positive PDO observations, compared with 4 observations where the higher mean precipitation is experienced during a negative PDO event. While this in itself might signal a trend, there are only two observations where an E+ event exceeds its negative counterpart by more than half an inch, McAllen November, and Brownsville October. These observations on average have seen 0.92, and 1.16 more inches respectively during E+’s then during E-‘s.
  • 6. During La Niña years, McAllen is the only site that shows observations where L+ years show marginally higher events than L- years. Those months at McAllen are October (1.64” higher) and December (0.74” higher). These numbers at McAllen are not significant, as the sample sizes are very small and limited. As seen in Table 12, there are only 10 E+ events, and 4 L+ events. It can be shown that at all sites, that El Niño events are predominantly coupled with positive PDO events, while La Niña events are predominantly coupled with negative PDO events. The same is true at Brownsville and Harlingen, where El Niño events are predominantly coupled with positive PDO events by approximately 50%. La Niña events are predominantly coupled with negative PDO events by approximately 300%. Looking at high precipitation events, where the observation was at least 2x the mean for that specific month, location, and PDO phase, we do find some evidence supporting PDO modulation (see Table 13). At Brownsville, when ENSO and PDO are in sync, the number of high precipitation events outnumbers when ENSO and PDO are not in sync by 17 to 5. The same is true at Harlingen and McAllen, but to a lesser degree, 13 to 8 and 6 to 4 respectively. However, this could be explained away by comparing the percentage of high precipitation events for each combination of ENSO and PDO (see Table 13). The percentage of high precipitation events for any ENSO and PDO combination are nearly the same with only a small variance. The reason for the disparity in total events arises from the number of in sync ENSO and PDO events being much higher than when ENSO and PDO are not in sync. Looking strictly at the top 3 precipitation events at each location for each month, El Niño is the dominant leader in terms of the number of events. This analysis took the top 3 precipitation events for each month at each location and categorized them according to their ENSO and PDO phase. Of the 27 total events (3 per month x 3 months x 3 locations = 27 events), 24 were during El Niño, and 16 of those El Niños had a corresponding positive PDO compared to 8 that did not. BRO/HRL/MFE E+ E- L+ L- 7/5/4 3/5/2 2/3/2 10/8/2 .12/.08/.13 .09/.16/ .11 .11/.17/ .17 .16/.13/ .06 Table 13. No. & percentage of precipitation totals at least 2x higher than the average for their respective month, location, and ENSO phase. E=El Niño, L=La Niña, PPDO=Positive PDO, NPDO=Negative PDO. City E+ E- L+ L- BRO 7 2 0 0 HRL 4 3 0 2 MFE 5 3 0 1 TOT 16 8 0 3 Table 14. No. of top 3 precipitation events for each month in the OND period at each city. BRO – Brownsville, HRL – Harlingen, MFE – McAllen. 5. CONCLUSION This study explored precipitation patterns for 3 municipalities in the Rio Grande Valley including, Brownsville, Harlingen, and McAllen. The questions raised here regarded the impacts of ENSO on precipitation and if PDO has any modulating effects during ENSO events. The multivariate regression analysis revealed that both ENSO and PDO have significantly positive correlations in Brownsville. Harlingen observed a significant positive correlation with ENSO only, while McAllen observed a significant positive correlation with PDO only. Despite the direct comparison between E+ and E- events showing the majority of E+ having higher average precipitation amounts, this difference was not by a significant amount. A caveat with this is that there is a small sample size in McAllen, with only 16 La Niña events and 17 El Niño events. More specifically, there were
  • 7. only 4 to 7 L+ events in the dataset, dependent upon the month. What can be noted is that El Niño events are usually associated with positive PDO. The reverse is true for La Niña events being predominately associated with negative PDO. This can also tie back to the regression analysis in that the positive pattern with PDO and precipitation may simply be due to convenience. El Niño events are dominant during the much longer positive phase of PDO. The reverse is true for La Niña events being dominant during the longer negative phase PDO, and this has been noted previously in a study by Newman et al. (2003). Despite the results in the comparison analysis suggesting PDO may not improve the chances of a high precipitation event in an E+ year over an E- year, E+ events are twice as likely to occur. Also, the average monthly precipitation for an E+ year is higher than E- years at all three locations during October, a month that has the highest flooding potential of the OND period. This alone can be reason enough for stakeholders to pay extra attention to the possibility of high precipitation events during E+ events. 6. REFERENCES Climate Prediction Center, cited 2015. Historical El Niño/La Niña episodes (1950- present). Retrieved from http://www.cpc.ncep.noaa.gov/product s/analysis_monitoring/ensostuff/ensoy ears.shtml JISAO. Joint Institute for the Study of the Atmosphere and Ocean. Retrieved from http://research.jisao.washington.edu /pdo/. Kurtzman, D., & Scanlon, B. R. (2007). El Niño–Southern Oscillation and Pacific Decadal Oscillation impacts on precipitation in the southern and central United States: evaluation of spatial distribution and predictions. Water Resources Research, 43(10). Mantua, N. J., & Hare, S. R. (2002). The Pacific decadal oscillation. Journal of oceanography, 58(1), 35-44. NOAA (October, 2015). Pacific Decadal Oscillation. Retrieved from https://www.ncdc.noaa.gov/teleconnec tions/pdo/ Barnston, A (2014). How ENSO Leads to a Cascade of Global Impacts. Retrieved from https://www.climate.gov/news- features/blogs/enso/how-enso-leads- cascade-global-impacts Newman, M., Compo, G. P., & Alexander, M. A. (2003). ENSO-forced variability of the Pacific decadal oscillation. Journal of Climate, 16(23), 3853-3857. Ropelewski, C. F., & Halpert, M. S. (1986). North American precipitation and temperature patterns associated with the El Niño/Southern Oscillation (ENSO). Monthly Weather Review, 114(12), 2352-2362. Wolter, K. (n.d.). Multivariate ENSO Index. Retrieved from http://www.esrl.noaa.gov/psd/enso/ mei/ ACKNOWLEDGEMENTS: Thanks to Barry Goldsmith (Weather Coordinating Meteorologist) who supervised this research and shared thorough local experience with the precipitation climatology of the area. Also, thanks to the staff at the National Weather Service office in Brownsville for their support and friendship during my 5 month internship there.