Download as POTX, PPTX
![[Survey Data] Investment vs. Interest
Across Emerging Technologies
Q1, 2014
Altimeter Group
@altimetergroup](https://image.slidesharecdn.com/detectingdisruptioninterestvs-140206153406-phpapp01/85/Survey-Data-Detecting-Disruption-Interest-vs-Investment-across-Emerging-Technologies-in-the-Enterprise-1-320.jpg)
![[Survey Data] Investment vs. Interest
Across Emerging Technologies
Q1, 2014
Altimeter Group
@altimetergroup](https://image.slidesharecdn.com/detectingdisruptioninterestvs-140206153406-phpapp01/75/Survey-Data-Detecting-Disruption-Interest-vs-Investment-across-Emerging-Technologies-in-the-Enterprise-1-2048.jpg)
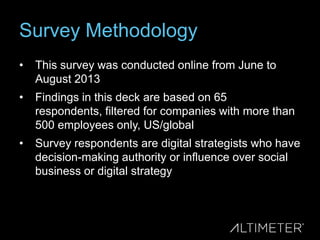
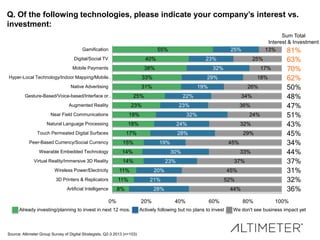
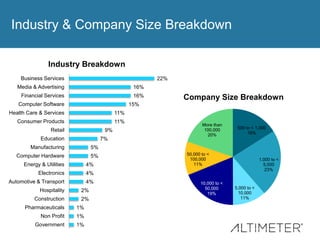
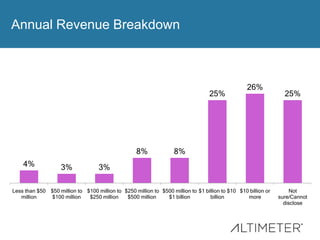

The document presents findings from a survey conducted by the Altimeter Group, analyzing investments versus interests in emerging technologies among digital strategists at large companies. Key technologies include gamification, artificial intelligence, and virtual reality, with varied interest and investment levels reported. The survey emphasizes the lack of perceived business impact among many technologies, as well as the demographic breakdown of respondents by industry and company size.
![[Report] The Rise of Digital Influence, by Brian Solis](https://cdn.slidesharecdn.com/ss_thumbnails/theriseofdigitalinfluence-120320132857-phpapp02-thumbnail.jpg?width=640&height=640&fit=bounds)
![[Report] A Framework for Social Analytics: Including 6 Use Cases for Social M...](https://cdn.slidesharecdn.com/ss_thumbnails/reportsocialanalytics080911finalv3-110810133414-phpapp02-thumbnail.jpg?width=640&height=640&fit=bounds)

![[Report] Guarding the Social Gates: The Imperative for Social Media Risk Mana...](https://cdn.slidesharecdn.com/ss_thumbnails/guardingthesocialgates080812-120808160138-phpapp01-thumbnail.jpg?width=640&height=640&fit=bounds)
![[Report] Power to the People: Identify and Empower Your Mobile Workforce, by ...](https://cdn.slidesharecdn.com/ss_thumbnails/powertothepeople-identifyandempoweryourmobileworkforce-120606174523-phpapp02-thumbnail.jpg?width=640&height=640&fit=bounds)


![[REPORT PREVIEW] Employee Adoption of Collaboration Tools in 2018](https://cdn.slidesharecdn.com/ss_thumbnails/slideshare-previewemployee-adoption-collaboration-tools-180824010708-thumbnail.jpg?width=640&height=640&fit=bounds)


![[REPORT PREVIEW] AI in the Enterprise](https://cdn.slidesharecdn.com/ss_thumbnails/altimeteraiintheenterpriseslideshare-180612153634-thumbnail.jpg?width=640&height=640&fit=bounds)

![[Slides] Social Data Intelligence Webinar, By Susan Etlinger](https://cdn.slidesharecdn.com/ss_thumbnails/sdiwebinar090513vf-130905155053--thumbnail.jpg?width=640&height=640&fit=bounds)
![[Slides] The State of Social Business 2013: The Maturing of Social Media into...](https://cdn.slidesharecdn.com/ss_thumbnails/stateofsocialbusiness2013datachartsv3-131108133412-phpapp01-thumbnail.jpg?width=640&height=640&fit=bounds)
![[REPORT PREVIEW] The Transformation of Selling](https://cdn.slidesharecdn.com/ss_thumbnails/the-transformation-of-sellingpreviewaltimeter-170221161515-thumbnail.jpg?width=640&height=640&fit=bounds)


![[REPORT PREVIEW] The AI Maturity Playbook: Five Pillars of Enterprise Success](https://cdn.slidesharecdn.com/ss_thumbnails/ai-maturity-playbook-altimeter-preview-181211202659-thumbnail.jpg?width=640&height=640&fit=bounds)
![[REPORT PREVIEW] Smart Places: The Digital Transformation of Location](https://cdn.slidesharecdn.com/ss_thumbnails/slideshare-previewaltimeter-reportsmart-placesdt-of-location-180813224639-thumbnail.jpg?width=640&height=640&fit=bounds)
![[REPORT PREVIEW] GDPR Beyond May 25, 2018](https://cdn.slidesharecdn.com/ss_thumbnails/altimeter-gdpr-strategies-preview-180212222226-thumbnail.jpg?width=640&height=640&fit=bounds)
![[REPORT PREVIEW] The Customer Experience of AI](https://cdn.slidesharecdn.com/ss_thumbnails/slideshare-cx-of-ai-171116034109-thumbnail.jpg?width=640&height=640&fit=bounds)

![The Conversational Business [REPORT PREVIEW]](https://cdn.slidesharecdn.com/ss_thumbnails/altimeter-conversationl-businessslideshare-170626230759-thumbnail.jpg?width=640&height=640&fit=bounds)
![[RESEARCH REPORT PREVIEW] Creating a Customer-First Web Experience](https://cdn.slidesharecdn.com/ss_thumbnails/creatingacusotmerfirstwebexperience8-170516182845-thumbnail.jpg?width=640&height=640&fit=bounds)
![[REPORT PREVIEW] The Age of AI](https://cdn.slidesharecdn.com/ss_thumbnails/artificialintelligencefinalpreview-170131170747-thumbnail.jpg?width=640&height=640&fit=bounds)


![[RESEARCH REPORT] The 2016 State of Digital Transformation](https://cdn.slidesharecdn.com/ss_thumbnails/2016stateofdtpreview-160916184533-thumbnail.jpg?width=640&height=640&fit=bounds)
![[NEW RESEARCH] Crafting A Digital Strategy](https://cdn.slidesharecdn.com/ss_thumbnails/digitalstrategy10-160815192542-thumbnail.jpg?width=640&height=640&fit=bounds)


![[NEW RESEARCH] Social Media Employee Advocacy](https://cdn.slidesharecdn.com/ss_thumbnails/socialmediaemployeeadvocacyv01-160309203619-thumbnail.jpg?width=640&height=640&fit=bounds)


![[INFOGRAPHIC] 2015 State of Social Business](https://cdn.slidesharecdn.com/ss_thumbnails/2015stateofsocialbusinessfinal3-150807194800-lva1-app6892-thumbnail.jpg?width=640&height=640&fit=bounds)


