THE DESIGN ANDPLANNING PHASE
Research Design is the
BLUEPRINT (outline/draft) of
the conduct of the study
3.
THE DESIGN ANDPLANNING PHASE
Refers to the researcher’s
overall plan of obtaining
answers to the research
questions and for testing the
research hypothesis.
4.
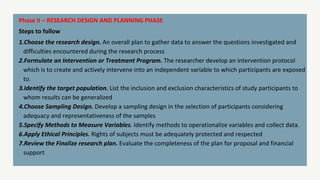
Phase II –RESEARCH DESIGN AND PLANNING PHASE
Steps to follow
1.Choose the research design. An overall plan to gather data to answer the questions investigated and
difficulties encountered during the research process
2.Formulate an Intervention or Treatment Program. The researcher develop an intervention protocol
which is to create and actively intervene into an independent variable to which participants are exposed
to.
3.Identify the target population. List the inclusion and exclusion characteristics of study participants to
whom results can be generalized
4.Choose Sampling Design. Develop a sampling design in the selection of participants considering
adequacy and representativeness of the samples
5.Specify Methods to Measure Variables. Identify methods to operationalize variables and collect data.
6.Apply Ethical Principles. Rights of subjects must be adequately protected and respected
7.Review the Finalize research plan. Evaluate the completeness of the plan for proposal and financial
support
5.
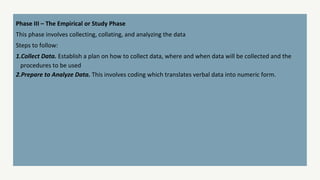
Phase III –The Empirical or Study Phase
This phase involves collecting, collating, and analyzing the data
Steps to follow:
1.Collect Data. Establish a plan on how to collect data, where and when data will be collected and the
procedures to be used
2.Prepare to Analyze Data. This involves coding which translates verbal data into numeric form.
6.
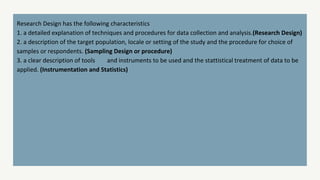
Research Design hasthe following characteristics
1. a detailed explanation of techniques and procedures for data collection and analysis.(Research Design)
2. a description of the target population, locale or setting of the study and the procedure for choice of
samples or respondents. (Sampling Design or procedure)
3. a clear description of tools and instruments to be used and the stattistical treatment of data to be
applied. (Instrumentation and Statistics)
7.
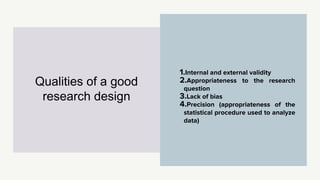
1.Internal and externalvalidity
2.Appropriateness to the research
question
3.Lack of bias
4.Precision (appropriateness of the
statistical procedure used to analyze
data)
Qualities of a good
research design
8.
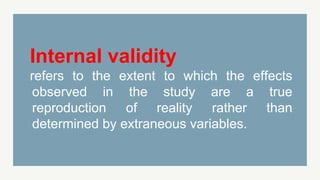
Internal validity
refers tothe extent to which the effects
observed in the study are a true
reproduction of reality rather than
determined by extraneous variables.
9.
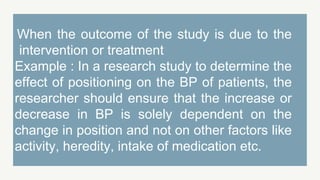
When the outcomeof the study is due to the
intervention or treatment
Example : In a research study to determine the
effect of positioning on the BP of patients, the
researcher should ensure that the increase or
decrease in BP is solely dependent on the
change in position and not on other factors like
activity, heredity, intake of medication etc.
10.
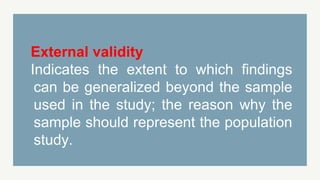
External validity
Indicates theextent to which findings
can be generalized beyond the sample
used in the study; the reason why the
sample should represent the population
study.
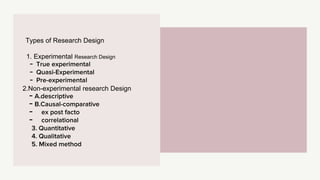
Types of ResearchDesign
1. Experimental Research Design
- True experimental
- Quasi-Experimental
- Pre-experimental
2.Non-experimental research Design
- A.descriptive
- B.Causal-comparative
- ex post facto
- correlational
3. Quantitative
4. Qualitative
5. Mixed method
13.
TRUE EXPERIMENTAL DESIGN
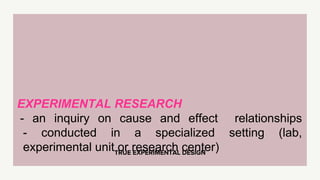
EXPERIMENTALRESEARCH
- an inquiry on cause and effect relationships
- conducted in a specialized setting (lab,
experimental unit or research center)
14.
TRUE EXPERIMENTAL DESIGN
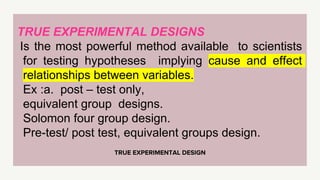
TRUEEXPERIMENTAL DESIGNS
Is the most powerful method available to scientists
for testing hypotheses implying cause and effect
relationships between variables.
Ex :a. post – test only,
equivalent group designs.
Solomon four group design.
Pre-test/ post test, equivalent groups design.
TRUE EXPERIMENTAL DESIGN
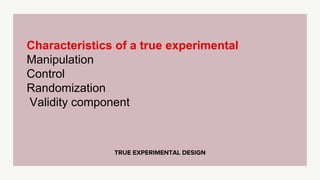
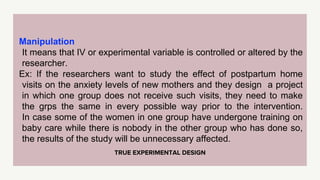
Manipulation
Itmeans that IV or experimental variable is controlled or altered by the
researcher.
Ex: If the researchers want to study the effect of postpartum home
visits on the anxiety levels of new mothers and they design a project
in which one group does not receive such visits, they need to make
the grps the same in every possible way prior to the intervention.
In case some of the women in one group have undergone training on
baby care while there is nobody in the other group who has done so,
the results of the study will be unnecessary affected.
17.
TRUE EXPERIMENTAL DESIGN
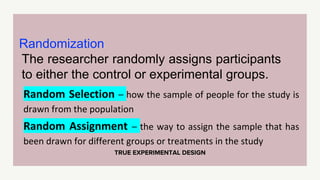
Randomization
Theresearcher randomly assigns participants
to either the control or experimental groups.
Random Selection – how the sample of people for the study is
drawn from the population
Random Assignment – the way to assign the sample that has
been drawn for different groups or treatments in the study
18.
TRUE EXPERIMENTAL DESIGN
Control
Thereis at least one experimental and one comparison
group in the study.
Control group- refers to a grp of participants whose
performance in relation to the independent variable is
used as a basis for evaluating the performance of the
experimental group.
19.
TRUE EXPERIMENTAL DESIGN
Comparisonof the different experimental design
True experimental – manipulation of IV, control
group, randomization
Quasi-experimental – manipulation of IV, no
randomization, no control group
Pre-experimental – no manipulation of IV
20.
When true experimentsand quasi-experiments are not possible, researchers may turn
to a pre-experimental design (Campbell & Stanley, 1963). [4] Pre-experimental designs
are called such because they often happen before a true experiment is conducted.
Often, researchers want to see if their interventions will have an effect on a small group
of people before they seek funding and dedicate time to conduct a true experiment.
Pre-experimental designs, thus, are usually conducted as a first step towards
establishing the evidence for or against an intervention. However, this type of design
comes with some unique disadvantages, which we’ll describe as we review the pre-
experimental designs available.
If we wished to measure the impact of a natural disaster like Hurricane Katrina, then we
might conduct a pre-experiment by identifying an experimental group from a
community that experienced the hurricane and a control group from a similar
community that had not been hit by the hurricane. This study design, called a static
group comparison, has the advantage of including a comparison group that did not
experience the stimulus (in this case, the hurricane). Unfortunately, it is difficult to be
sure that the groups are truly comparable because the experimental and control groups
were determined by factors other than random assignment. Additionally, the design
would only allow for posttests, unless one were lucky enough to be gathering the data
already before Katrina. As you might have guessed from our example, static group
comparisons are useful in cases where a researcher cannot control or predict whether,
when, or how the stimulus is administered, as in the case of natural disasters.
21.
TRUE EXPERIMENTAL DESIGN
Limitationof experimental design
1. there are variables that are simply not amenable to
experimental manipulation
Ex. Health history, age, blood type etc
2. Ethical considerations prohibit the manipulation of some
variables
3. It can be difficult to seek the cooperation of some healthcare
facility administrators for the conduct of an experiment.
22.
QUASI EXPERIMENTAL DESIGN
QUASI-EXPERIMENTALDESIGNS
Purposes :
to identify causal relationships
to determine the significance of causal
relationship
To clarify why certain events happen
23.
NON- EXPERIMENTAL DESIGN
NON-EXPERIMENTALDESIGNS ( Quantitative Research)
Non- experimental Research Design (Quantitative)
generally present–oriented.
It attempts to describe what exists
Research design which has less control over the study subjects
and often known as surveys
Variables are not deliberately manipulated, nor is the setting
controlled.
The analysis often leads to the formation of hypothesis that can
be tested experimentally.
24.
QUANTITATIVE
●Is a formal,objective and systematic, process in which the numerical data are used to
obtain observation.
●Used to describe variables, examine relationships among variables and determine the
cause and effect interactions between variables.
25.
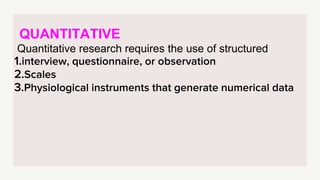
QUANTITATIVE
Quantitative research requiresthe use of structured
1.interview, questionnaire, or observation
2.Scales
3.Physiological instruments that generate numerical data
26.
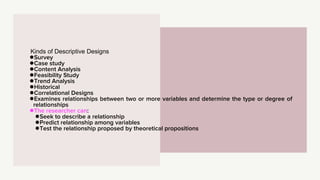
Kinds of DescriptiveDesigns
●Survey
●Case study
●Content Analysis
●Feasibility Study
●Trend Analysis
●Historical
●Correlational Designs
●Examines relationships between two or more variables and determine the type or degree of
relationships
●The researcher can:
●Seek to describe a relationship
●Predict relationship among variables
●Test the relationship proposed by theoretical propositions
27.
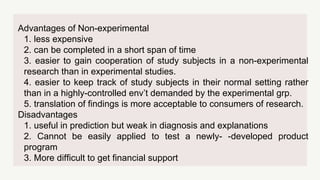
Advantages of Non-experimental
1.less expensive
2. can be completed in a short span of time
3. easier to gain cooperation of study subjects in a non-experimental
research than in experimental studies.
4. easier to keep track of study subjects in their normal setting rather
than in a highly-controlled env’t demanded by the experimental grp.
5. translation of findings is more acceptable to consumers of research.
Disadvantages
1. useful in prediction but weak in diagnosis and explanations
2. Cannot be easily applied to test a newly- -developed product
program
3. More difficult to get financial support
28.
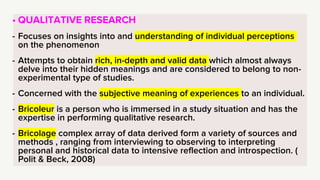
• QUALITATIVE RESEARCH
-Focuses on insights into and understanding of individual perceptions
on the phenomenon
- Attempts to obtain rich, in-depth and valid data which almost always
delve into their hidden meanings and are considered to belong to non-
experimental type of studies.
- Concerned with the subjective meaning of experiences to an individual.
- Bricoleur is a person who is immersed in a study situation and has the
expertise in performing qualitative research.
- Bricolage complex array of data derived form a variety of sources and
methods , ranging from interviewing to observing to interpreting
personal and historical data to intensive reflection and introspection. (
Polit & Beck, 2008)
29.
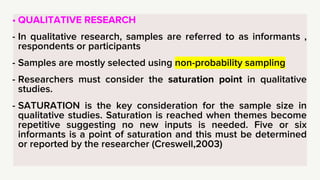
• QUALITATIVE RESEARCH
-In qualitative research, samples are referred to as informants ,
respondents or participants
- Samples are mostly selected using non-probability sampling
- Researchers must consider the saturation point in qualitative
studies.
- SATURATION is the key consideration for the sample size in
qualitative studies. Saturation is reached when themes become
repetitive suggesting no new inputs is needed. Five or six
informants is a point of saturation and this must be determined
or reported by the researcher (Creswell,2003)
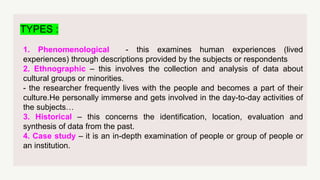
TYPES :
1. Phenomenological- this examines human experiences (lived
experiences) through descriptions provided by the subjects or respondents
2. Ethnographic – this involves the collection and analysis of data about
cultural groups or minorities.
- the researcher frequently lives with the people and becomes a part of their
culture.He personally immerse and gets involved in the day-to-day activities of
the subjects…
3. Historical – this concerns the identification, location, evaluation and
synthesis of data from the past.
4. Case study – it is an in-depth examination of people or group of people or
an institution.
32.
Replication Studies areconducted to challenge findings and
interpretations of the original researchers and to determine when
results of the original study were in error.
33.
The term “mixedmethods” refers to an emergent
methodology of research that advances the
systematic integration, or “mixing,” of quantitative
and qualitative data within a single investigation or
sustained program of inquiry.
Mixed Methods Research Design
34.
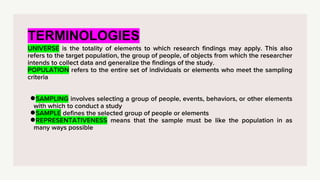
TERMINOLOGIES
UNIVERSE is thetotality of elements to which research findings may apply. This also
refers to the target population, the group of people, of objects from which the researcher
intends to collect data and generalize the findings of the study.
POPULATION refers to the entire set of individuals or elements who meet the sampling
criteria
●SAMPLING involves selecting a group of people, events, behaviors, or other elements
with which to conduct a study
●SAMPLE defines the selected group of people or elements
●REPRESENTATIVENESS means that the sample must be like the population in as
many ways possible
35.
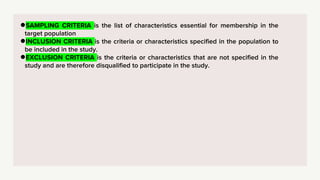
●SAMPLING CRITERIA isthe list of characteristics essential for membership in the
target population
●INCLUSION CRITERIA is the criteria or characteristics specified in the population to
be included in the study.
●EXCLUSION CRITERIA is the criteria or characteristics that are not specified in the
study and are therefore disqualified to participate in the study.
36.
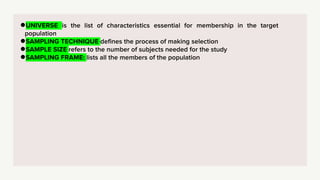
●UNIVERSE is thelist of characteristics essential for membership in the target
population
●SAMPLING TECHNIQUE defines the process of making selection
●SAMPLE SIZE refers to the number of subjects needed for the study
●SAMPLING FRAME: lists all the members of the population
37.
SAMPLE SIZE
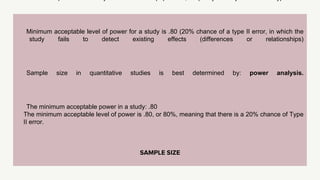
Minimum acceptablelevel of power for a study is .80 (20% chance of a type II error, in which the
study fails to detect existing effects (differences or relationships)
Sample size in quantitative studies is best determined by: power analysis.
The minimum acceptable power in a study: .80
The minimum acceptable level of power is .80, or 80%, meaning that there is a 20% chance of Type
II error.
38.
SLOVIN’S FORMULA
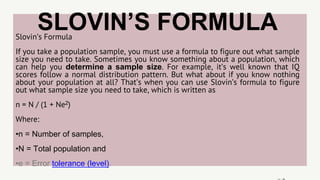
Slovin’s Formula
Ifyou take a population sample, you must use a formula to figure out what sample
size you need to take. Sometimes you know something about a population, which
can help you determine a sample size. For example, it’s well known that IQ
scores follow a normal distribution pattern. But what about if you know nothing
about your population at all? That’s when you can use Slovin’s formula to figure
out what sample size you need to take, which is written as
n = N / (1 + Ne2)
Where:
•n = Number of samples,
•N = Total population and
•e = Error tolerance (level).
39.
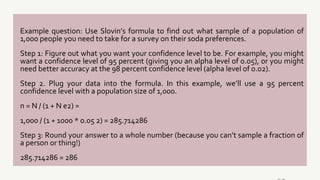
Example question: UseSlovin’s formula to find out what sample of a population of
1,000 people you need to take for a survey on their soda preferences.
Step 1: Figure out what you want your confidence level to be. For example, you might
want a confidence level of 95 percent (giving you an alpha level of 0.05), or you might
need better accuracy at the 98 percent confidence level (alpha level of 0.02).
Step 2. Plug your data into the formula. In this example, we’ll use a 95 percent
confidence level with a population size of 1,000.
n = N / (1 + N e2) =
1,000 / (1 + 1000 * 0.05 2) = 285.714286
Step 3: Round your answer to a whole number (because you can’t sample a fraction of
a person or thing!)
285.714286 = 286
40.
12 -
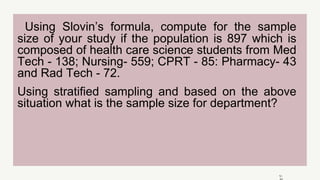
Using Slovin’sformula, compute for the sample
size of your study if the population is 897 which is
composed of health care science students from Med
Tech - 138; Nursing- 559; CPRT - 85: Pharmacy- 43
and Rad Tech - 72.
Using stratified sampling and based on the above
situation what is the sample size for department?
41.
12 -
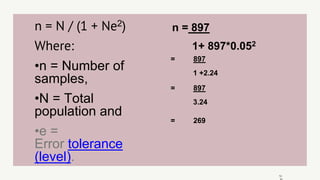
n =N / (1 + Ne2)
Where:
•n = Number of
samples,
•N = Total
population and
•e =
Error tolerance
(level).
n = 897
1+ 897*0.052
= 897
1 +2.24
= 897
3.24
= 269
42.
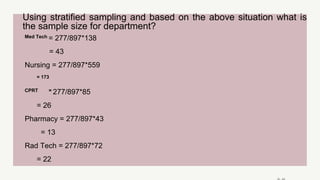
Using stratified samplingand based on the above situation what is
the sample size for department?
Med Tech = 277/897*138
= 43
Nursing = 277/897*559
= 173
CPRT = 277/897*85
= 26
Pharmacy = 277/897*43
= 13
Rad Tech = 277/897*72
= 22
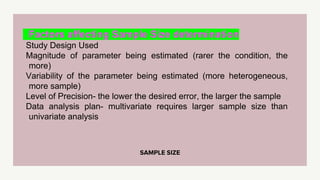
SAMPLE SIZE
Factors affectingSample Size determination
Study Design Used
Magnitude of parameter being estimated (rarer the condition, the
more)
Variability of the parameter being estimated (more heterogeneous,
more sample)
Level of Precision- the lower the desired error, the larger the sample
Data analysis plan- multivariate requires larger sample size than
univariate analysis
45.
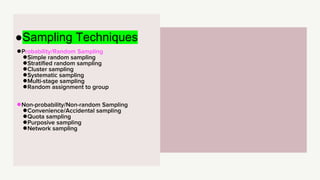
●Probability/Random Sampling
●Simple randomsampling
●Stratified random sampling
●Cluster sampling
●Systematic sampling
●Multi-stage sampling
●Random assignment to group
●Non-probability/Non-random Sampling
●Convenience/Accidental sampling
●Quota sampling
●Purposive sampling
●Network sampling
●Sampling Techniques
46.
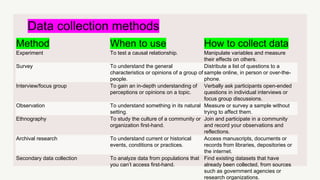
Data collection methods
MethodWhen to use How to collect data
Experiment To test a causal relationship. Manipulate variables and measure
their effects on others.
Survey To understand the general
characteristics or opinions of a group of
people.
Distribute a list of questions to a
sample online, in person or over-the-
phone.
Interview/focus group To gain an in-depth understanding of
perceptions or opinions on a topic.
Verbally ask participants open-ended
questions in individual interviews or
focus group discussions.
Observation To understand something in its natural
setting.
Measure or survey a sample without
trying to affect them.
Ethnography To study the culture of a community or
organization first-hand.
Join and participate in a community
and record your observations and
reflections.
Archival research To understand current or historical
events, conditions or practices.
Access manuscripts, documents or
records from libraries, depositories or
the internet.
Secondary data collection To analyze data from populations that
you can’t access first-hand.
Find existing datasets that have
already been collected, from sources
such as government agencies or
research organizations.
47.
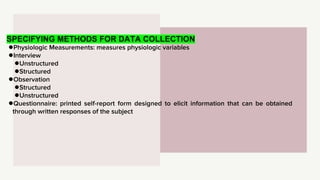
SPECIFYING METHODS FORDATA COLLECTION
●Physiologic Measurements: measures physiologic variables
●Interview
●Unstructured
●Structured
●Observation
●Structured
●Unstructured
●Questionnaire: printed self-report form designed to elicit information that can be obtained
through written responses of the subject
48.
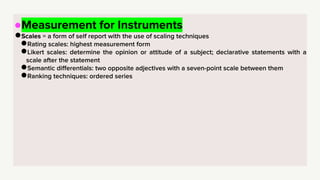
●Measurement for Instruments
●Scales= a form of self report with the use of scaling techniques
●Rating scales: highest measurement form
●Likert scales: determine the opinion or attitude of a subject; declarative statements with a
scale after the statement
●Semantic differentials: two opposite adjectives with a seven-point scale between them
●Ranking techniques: ordered series
49.
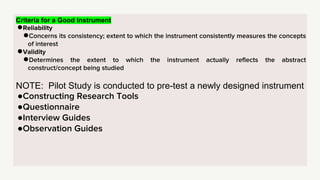
Criteria for aGood Instrument
●Reliability
●Concerns its consistency; extent to which the instrument consistently measures the concepts
of interest
●Validity
●Determines the extent to which the instrument actually reflects the abstract
construct/concept being studied
NOTE: Pilot Study is conducted to pre-test a newly designed instrument
●Constructing Research Tools
●Questionnaire
●Interview Guides
●Observation Guides


![When true experiments and quasi-experiments are not possible, researchers may turn
to a pre-experimental design (Campbell & Stanley, 1963). [4] Pre-experimental designs
are called such because they often happen before a true experiment is conducted.
Often, researchers want to see if their interventions will have an effect on a small group
of people before they seek funding and dedicate time to conduct a true experiment.
Pre-experimental designs, thus, are usually conducted as a first step towards
establishing the evidence for or against an intervention. However, this type of design
comes with some unique disadvantages, which we’ll describe as we review the pre-
experimental designs available.
If we wished to measure the impact of a natural disaster like Hurricane Katrina, then we
might conduct a pre-experiment by identifying an experimental group from a
community that experienced the hurricane and a control group from a similar
community that had not been hit by the hurricane. This study design, called a static
group comparison, has the advantage of including a comparison group that did not
experience the stimulus (in this case, the hurricane). Unfortunately, it is difficult to be
sure that the groups are truly comparable because the experimental and control groups
were determined by factors other than random assignment. Additionally, the design
would only allow for posttests, unless one were lucky enough to be gathering the data
already before Katrina. As you might have guessed from our example, static group
comparisons are useful in cases where a researcher cannot control or predict whether,
when, or how the stimulus is administered, as in the case of natural disasters.](https://image.slidesharecdn.com/designandplanningphase-250321234836-a08c22ab/85/design-and-planning-phase-research-pdf-20-320.jpg)