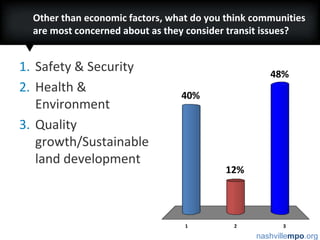
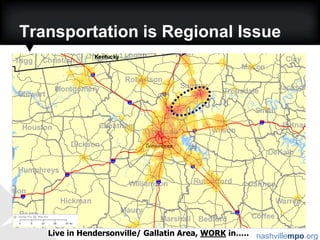
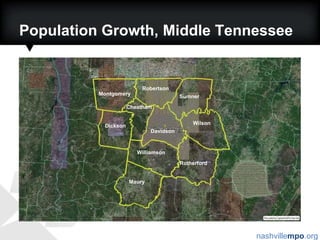
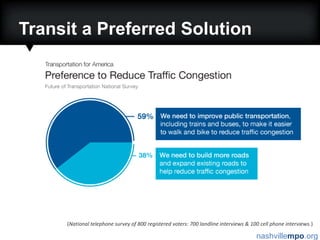
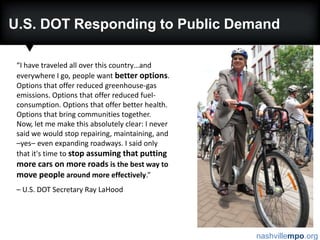
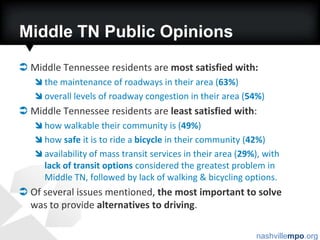
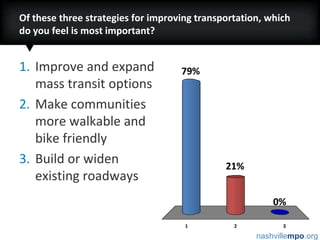
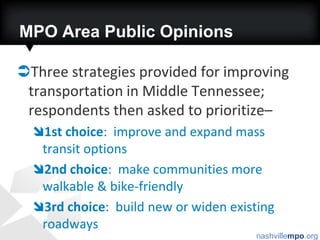
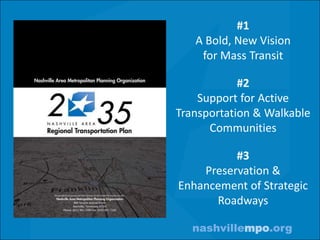
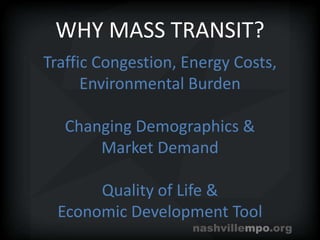
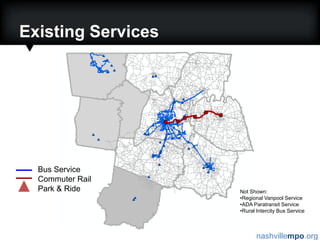
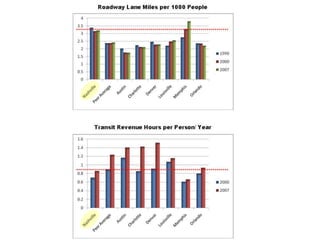
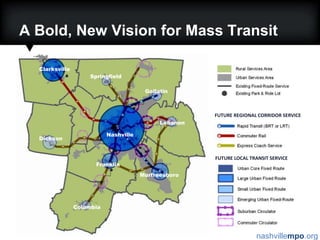
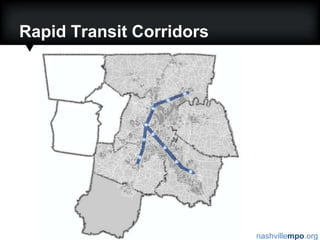
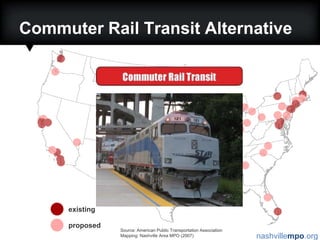
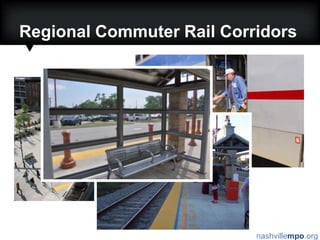
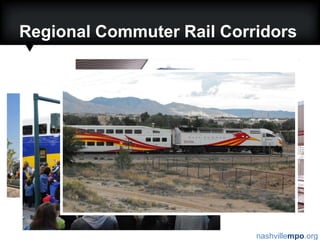
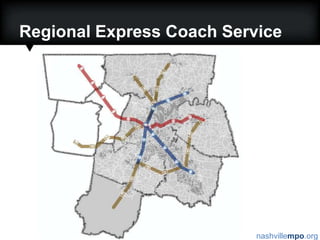
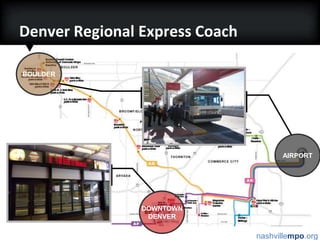
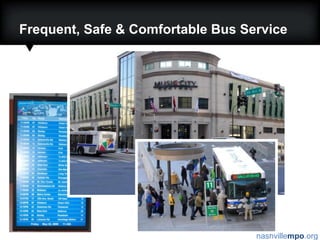
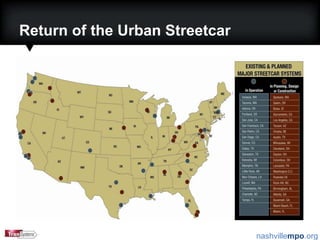
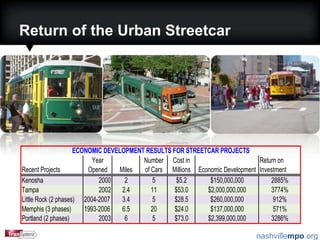
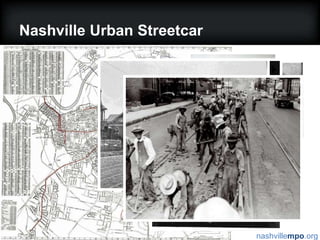
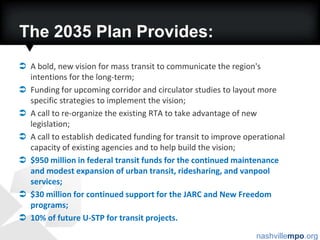
Other than economic factors, what do you think communities are most concerned about as they consider transit issues?Safety & SecurityHealth & EnvironmentQuality growth/Sustainable land development
Planning for the Future with Mass TransitMiddle Tennessee Transit AcademySeptember 14, 2011
What percentage of employees across the 10-county area commute to another county to work?10%25%33%66%
Transportation is Regional IssueWORK in Downtown Nashville, LIVE in…..
Transportation is Regional IssueLive in Hendersonville/ Gallatin Area, WORK in…..
MPOs in Tennessee
Regional Geographies in Middle TN
Population Growth, Middle TennesseeRobertsonMontgomerySumnerCheathamWilsonDicksonDavidsonWilliamsonRutherfordMaury
How will our Region Grow?
Development Pattern, 1965-203520352,600,000(In 2035, the Nashville region will be about the size of the Denver region today)20001,450,0001965750,000PopulationProperties affected by development
Market and Policy Driven ForecastingEnvironmental ConstraintsLand Use PolicySuitability AnalysisGrowth Policy
Increasing DiversityRace, Ethnicity, AgeSource: U.S. Census Bureau, Woods & Poole Economics
Increasing DiversityHousehold CompositionCensus for 1960 and 2000, 2025 adapted from Martha Farnsworth Riche, How Changes in the Nation’s Age and Household Structure Will Reshape Housing Demand in the 21st Century, HUD, 2003.
Growth’s Impact on Mobility & Quality-of-Life
Resiliency in Urban Congestion2035 w/ Short-Term Improvements2035 After Long-Term ImprovementsTODAYCongestion in Urban Areas Cannot Be Treated with Roadway Capacity Alone.Daily Recurring Congestion on Major Roadways.
How much does traffic congestion cost the region annually in wasted fuel and lost time?$200 million to $300 million$300 million to $400 million$400 million to $500 million$500 million to $600 millionMore than $600 million
Texas Transportation Institute (TTI)Urban Mobility Report, 2009Nashville-Davidson Urbanized AreaCost of Congestion (wasted fuel and time):$ 426 Million, Annually $ 10.65 Billion, over next 25 years
Source: Driven Apart (CEO for Cities)
Source: Driven Apart (CEO for Cities), TTI Urban Mobility Report, 2009
What percentage of Middle Tennessee households spend 20% or more of their income on transportation costs?Less than 30%30% to 50%50% to 70%70% to 90%More than 90%
On average, Americans spend about 18% of their Household Income on Transportation- Related ExpensesSource: Center for Neighborhood Technology Housing + Transportation Affordability Index (http://www.htaindex.org/)
Public Attitudes toward Transportation Policy
I have no choice but to drive as much as I do.Strongly agreeStrongly disagree
I would like to spend less time in my car.Strongly agreeStrongly disagree
No Other Options than Driving(National telephone survey of 800 registered voters: 700 landline interviews & 100 cell phone interviews.)
Transit a Preferred Solution(National telephone survey of 800 registered voters: 700 landline interviews & 100 cell phone interviews.)
U.S. DOT Responding to Public Demand“I have traveled all over this country…and everywhere I go, people want better options. Options that offer reduced greenhouse-gas emissions. Options that offer reduced fuel-consumption. Options that offer better health. Options that bring communities together. Now, let me make this absolutely clear: I never said we would stop repairing, maintaining, and –yes–even expanding roadways. I said only that it's time tostop assuming that putting more cars on more roads is the best way to move people around more effectively.”– U.S. DOT Secretary Ray LaHood
Middle TN Public OpinionsMiddle Tennessee residents are most satisfied with:the maintenance of roadways in their area (63%)overall levels of roadway congestion in their area (54%)Middle Tennessee residents are least satisfied with:how walkable their community is (49%)how safe it is to ride a bicycle in their community (42%)availability of mass transit services in their area (29%), with lack of transit options considered the greatest problem in Middle TN, followed by lack of walking & bicycling options.Of several issues mentioned, the most important to solve was to provide alternatives to driving.
Of these three strategies for improving transportation, which do you feel is most important?Improve and expand mass transit optionsMake communities more walkable and bike friendlyBuild or widen existing roadways
MPO Area Public OpinionsThree strategies provided for improving transportation in Middle Tennessee; respondents then asked to prioritize– 1st choice:  improve and expand mass transit options2nd choice:  make communities more walkable & bike-friendly3rd choice:  build new or widen existing roadways
How Should We Invest in Our Future?
#1A Bold, New Vision for Mass Transit#2Support for Active Transportation & Walkable Communities#3Preservation & Enhancement of Strategic Roadways
A Bold, New Vision for Mass Transit
WHY MASS TRANSIT?Traffic Congestion, Energy Costs, Environmental BurdenChanging Demographics & Market DemandQuality of Life &Economic Development Tool
Existing ServicesBus ServiceCommuter RailPark & RideNot Shown:Regional Vanpool Service
ADA Paratransit Service
Rural Intercity Bus Service
A Bold, New Vision for Mass TransitClarksvilleSpringfieldGallatinFUTURE REGIONAL CORRIDOR SERVICELebanonNashvilleDicksonFUTURE LOCAL TRANSIT SERVICEFranklinMurfreesboroColumbia
Rapid Transit Corridors
A History with InterUrban Rail
existingproposedLight Rail Transit AlternativeSource: American Public Transportation AssociationMapping: Nashville Area MPO (2007)
Rapid Rail Transit – Peers
Bus Rapid Transit Alternative
BUS Rapid Transit – Peers
existingproposedHeavy Rail Transit AlternativeSource: American Public Transportation AssociationMapping: Nashville Area MPO (2007)
Regional Rapid Transit Corridors
Denver – Urban/ Suburban Rapid Transit
13 Potential Station SitesGallatinHarrisBig Station Camp Indian LakeNew Shackle IslandSaundersvilleConference DriveCenter Point Old HickoryDickerson/ SkylineTrinityCleveland StreetMusic City Central
Music City Central StationLand Use Issues:Needed density/intensity increases must come from high density office and residential redevelopment in downtown core.
Will be driven by policy decisions (focusing high density regional employment and residential opportunities) more than land use decisions.Station Context:Urban Downtown Center, Regional employment destination
Music City Central Station
Saundersville StationFuture Land UseStation Context:Suburban interchange with significant industrial and institutional usesLand Use Issues:Single-use categories – need to permit a mix of uses adjacent to station
Significant industrial and public facilities land uses limit TOD opportunities in station area
Vertical mixed-use development not permitted
New street connectivity will be needed to maximize access to station areaTraditional Office ParkTransit Oriented DevelopmentSaundersville StationThe Streets at Indian Lake Village
Saundersville Station
Regional Rapid Transit Corridors
Regional Commuter Rail Corridors
existingproposedCommuter Rail Transit AlternativeSource: American Public Transportation AssociationMapping: Nashville Area MPO (2007)
Regional Commuter Rail Corridors
Regional Express Coach Service
Denver Regional Express CoachBOULDERAIRPORTDOWNTOWNDENVER
Regional Express Coach Service
Local Circulators
Local Circulators
Local Circulators
Urban Fixed Route Service
Frequent, Safe & Comfortable Bus Service
Return of the Urban Streetcar
Nashville Urban Streetcar
Lower Broadway/ West End
The 2035 Plan Provides:A bold, new vision for mass transit to communicate the region's intentions for the long-term;Funding for upcoming corridor and circulator studies to layout more specific strategies to implement the vision;A call to re-organize the existing RTA to take advantage of new legislation;A call to establish dedicated funding for transit to improve operational capacity of existing agencies and to help build the vision;$950 million in federal transit funds for the continued maintenance and modest expansion of urban transit, ridesharing, and vanpool services;$30 million for continued support for the JARC and New Freedom programs;10% of future U-STP for transit projects.
Support for Active Transportation & Walkable Communities
System Preservation & Enhancement
Show me the Money
Average Costs per Mile
Sources of Funding for Transit
What do other things cost?2030 Regional Plan adopted in 2005 = $3.5 BAnnual Payroll for NFL Players = $3.6 BCentral Texas Turnpike around Austin = $3.6 BSan Francisco/Oakland Bridge Replacement = $6.3 BDenver FasTracks System = $6.9 BLas Vegas City Center (mixed-use) = $11 BBig Dig (Boston) = $14.6 BTTI Cost of Congestion for Nashville Metro between now and 2035 = $15+ B
Funding/ Financing Issues2035 Plan estimated to provide approx $4.9 B FederalThe cost of NEEDS/ VISION is at least triple the anticipated revenuesLack of dedicated funding for transit to ensure stability and to compete for federal transit fundsSprawling land development pattern creates unsustainable demand for infrastructureDeclining fuel tax revenues and buying power means fewer projects, slower progress, less benefit
2035 Cost-Feasible Road Projects

Revised skipper presentation

  • 1.
    Other than economicfactors, what do you think communities are most concerned about as they consider transit issues?Safety & SecurityHealth & EnvironmentQuality growth/Sustainable land development
  • 2.
    Planning for theFuture with Mass TransitMiddle Tennessee Transit AcademySeptember 14, 2011
  • 3.
    What percentage ofemployees across the 10-county area commute to another county to work?10%25%33%66%
  • 4.
    Transportation is RegionalIssueWORK in Downtown Nashville, LIVE in…..
  • 5.
    Transportation is RegionalIssueLive in Hendersonville/ Gallatin Area, WORK in…..
  • 6.
  • 7.
  • 8.
    Population Growth, MiddleTennesseeRobertsonMontgomerySumnerCheathamWilsonDicksonDavidsonWilliamsonRutherfordMaury
  • 9.
    How will ourRegion Grow?
  • 10.
    Development Pattern, 1965-203520352,600,000(In2035, the Nashville region will be about the size of the Denver region today)20001,450,0001965750,000PopulationProperties affected by development
  • 11.
    Market and PolicyDriven ForecastingEnvironmental ConstraintsLand Use PolicySuitability AnalysisGrowth Policy
  • 12.
    Increasing DiversityRace, Ethnicity,AgeSource: U.S. Census Bureau, Woods & Poole Economics
  • 13.
    Increasing DiversityHousehold CompositionCensusfor 1960 and 2000, 2025 adapted from Martha Farnsworth Riche, How Changes in the Nation’s Age and Household Structure Will Reshape Housing Demand in the 21st Century, HUD, 2003.
  • 14.
    Growth’s Impact onMobility & Quality-of-Life
  • 15.
    Resiliency in UrbanCongestion2035 w/ Short-Term Improvements2035 After Long-Term ImprovementsTODAYCongestion in Urban Areas Cannot Be Treated with Roadway Capacity Alone.Daily Recurring Congestion on Major Roadways.
  • 16.
    How much doestraffic congestion cost the region annually in wasted fuel and lost time?$200 million to $300 million$300 million to $400 million$400 million to $500 million$500 million to $600 millionMore than $600 million
  • 17.
    Texas Transportation Institute(TTI)Urban Mobility Report, 2009Nashville-Davidson Urbanized AreaCost of Congestion (wasted fuel and time):$ 426 Million, Annually $ 10.65 Billion, over next 25 years
  • 18.
    Source: Driven Apart(CEO for Cities)
  • 19.
    Source: Driven Apart(CEO for Cities), TTI Urban Mobility Report, 2009
  • 20.
    What percentage ofMiddle Tennessee households spend 20% or more of their income on transportation costs?Less than 30%30% to 50%50% to 70%70% to 90%More than 90%
  • 21.
    On average, Americansspend about 18% of their Household Income on Transportation- Related ExpensesSource: Center for Neighborhood Technology Housing + Transportation Affordability Index (http://www.htaindex.org/)
  • 22.
    Public Attitudes towardTransportation Policy
  • 23.
    I have nochoice but to drive as much as I do.Strongly agreeStrongly disagree
  • 24.
    I would liketo spend less time in my car.Strongly agreeStrongly disagree
  • 25.
    No Other Optionsthan Driving(National telephone survey of 800 registered voters: 700 landline interviews & 100 cell phone interviews.)
  • 26.
    Transit a PreferredSolution(National telephone survey of 800 registered voters: 700 landline interviews & 100 cell phone interviews.)
  • 27.
    U.S. DOT Respondingto Public Demand“I have traveled all over this country…and everywhere I go, people want better options. Options that offer reduced greenhouse-gas emissions. Options that offer reduced fuel-consumption. Options that offer better health. Options that bring communities together. Now, let me make this absolutely clear: I never said we would stop repairing, maintaining, and –yes–even expanding roadways. I said only that it's time tostop assuming that putting more cars on more roads is the best way to move people around more effectively.”– U.S. DOT Secretary Ray LaHood
  • 28.
    Middle TN PublicOpinionsMiddle Tennessee residents are most satisfied with:the maintenance of roadways in their area (63%)overall levels of roadway congestion in their area (54%)Middle Tennessee residents are least satisfied with:how walkable their community is (49%)how safe it is to ride a bicycle in their community (42%)availability of mass transit services in their area (29%), with lack of transit options considered the greatest problem in Middle TN, followed by lack of walking & bicycling options.Of several issues mentioned, the most important to solve was to provide alternatives to driving.
  • 29.
    Of these threestrategies for improving transportation, which do you feel is most important?Improve and expand mass transit optionsMake communities more walkable and bike friendlyBuild or widen existing roadways
  • 30.
    MPO Area PublicOpinionsThree strategies provided for improving transportation in Middle Tennessee; respondents then asked to prioritize– 1st choice: improve and expand mass transit options2nd choice: make communities more walkable & bike-friendly3rd choice: build new or widen existing roadways
  • 31.
    How Should WeInvest in Our Future?
  • 32.
    #1A Bold, NewVision for Mass Transit#2Support for Active Transportation & Walkable Communities#3Preservation & Enhancement of Strategic Roadways
  • 33.
    A Bold, NewVision for Mass Transit
  • 34.
    WHY MASS TRANSIT?TrafficCongestion, Energy Costs, Environmental BurdenChanging Demographics & Market DemandQuality of Life &Economic Development Tool
  • 35.
    Existing ServicesBus ServiceCommuterRailPark & RideNot Shown:Regional Vanpool Service
  • 36.
  • 37.
  • 38.
    A Bold, NewVision for Mass TransitClarksvilleSpringfieldGallatinFUTURE REGIONAL CORRIDOR SERVICELebanonNashvilleDicksonFUTURE LOCAL TRANSIT SERVICEFranklinMurfreesboroColumbia
  • 39.
  • 40.
    A History withInterUrban Rail
  • 41.
    existingproposedLight Rail TransitAlternativeSource: American Public Transportation AssociationMapping: Nashville Area MPO (2007)
  • 42.
  • 43.
  • 44.
  • 45.
    existingproposedHeavy Rail TransitAlternativeSource: American Public Transportation AssociationMapping: Nashville Area MPO (2007)
  • 46.
  • 47.
    Denver – Urban/Suburban Rapid Transit
  • 48.
    13 Potential StationSitesGallatinHarrisBig Station Camp Indian LakeNew Shackle IslandSaundersvilleConference DriveCenter Point Old HickoryDickerson/ SkylineTrinityCleveland StreetMusic City Central
  • 49.
    Music City CentralStationLand Use Issues:Needed density/intensity increases must come from high density office and residential redevelopment in downtown core.
  • 50.
    Will be drivenby policy decisions (focusing high density regional employment and residential opportunities) more than land use decisions.Station Context:Urban Downtown Center, Regional employment destination
  • 51.
  • 52.
    Saundersville StationFuture LandUseStation Context:Suburban interchange with significant industrial and institutional usesLand Use Issues:Single-use categories – need to permit a mix of uses adjacent to station
  • 53.
    Significant industrial andpublic facilities land uses limit TOD opportunities in station area
  • 54.
  • 55.
    New street connectivitywill be needed to maximize access to station areaTraditional Office ParkTransit Oriented DevelopmentSaundersville StationThe Streets at Indian Lake Village
  • 56.
  • 57.
  • 58.
  • 59.
    existingproposedCommuter Rail TransitAlternativeSource: American Public Transportation AssociationMapping: Nashville Area MPO (2007)
  • 60.
  • 61.
  • 62.
  • 63.
  • 64.
  • 65.
    Denver Regional ExpressCoachBOULDERAIRPORTDOWNTOWNDENVER
  • 66.
  • 67.
  • 68.
  • 69.
  • 70.
  • 71.
    Frequent, Safe &Comfortable Bus Service
  • 72.
    Frequent, Safe &Comfortable Bus Service
  • 73.
    Return of theUrban Streetcar
  • 74.
    Return of theUrban Streetcar
  • 75.
  • 76.
  • 77.
    The 2035 PlanProvides:A bold, new vision for mass transit to communicate the region's intentions for the long-term;Funding for upcoming corridor and circulator studies to layout more specific strategies to implement the vision;A call to re-organize the existing RTA to take advantage of new legislation;A call to establish dedicated funding for transit to improve operational capacity of existing agencies and to help build the vision;$950 million in federal transit funds for the continued maintenance and modest expansion of urban transit, ridesharing, and vanpool services;$30 million for continued support for the JARC and New Freedom programs;10% of future U-STP for transit projects.
  • 78.
    Support for ActiveTransportation & Walkable Communities
  • 79.
  • 80.
  • 81.
  • 82.
  • 83.
    What do otherthings cost?2030 Regional Plan adopted in 2005 = $3.5 BAnnual Payroll for NFL Players = $3.6 BCentral Texas Turnpike around Austin = $3.6 BSan Francisco/Oakland Bridge Replacement = $6.3 BDenver FasTracks System = $6.9 BLas Vegas City Center (mixed-use) = $11 BBig Dig (Boston) = $14.6 BTTI Cost of Congestion for Nashville Metro between now and 2035 = $15+ B
  • 84.
    Funding/ Financing Issues2035Plan estimated to provide approx $4.9 B FederalThe cost of NEEDS/ VISION is at least triple the anticipated revenuesLack of dedicated funding for transit to ensure stability and to compete for federal transit fundsSprawling land development pattern creates unsustainable demand for infrastructureDeclining fuel tax revenues and buying power means fewer projects, slower progress, less benefit
  • 85.