Download to read offline
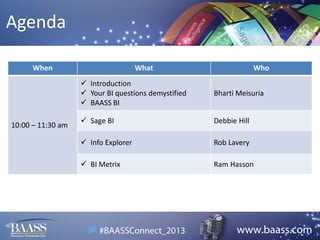

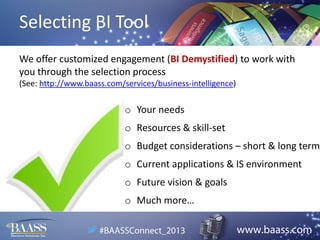
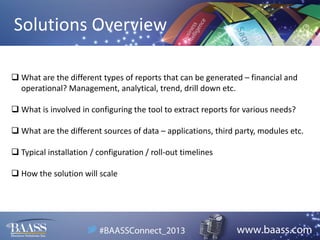
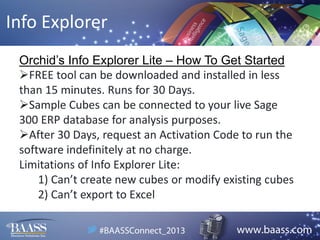
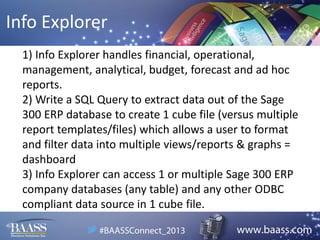

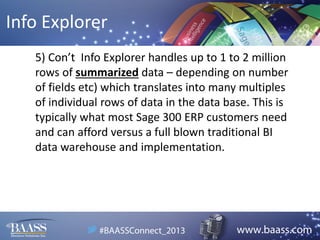
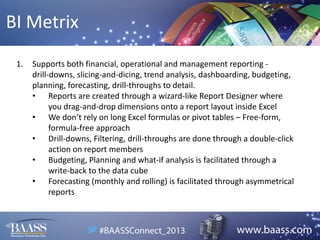
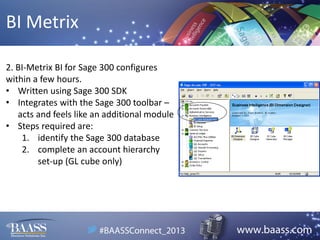
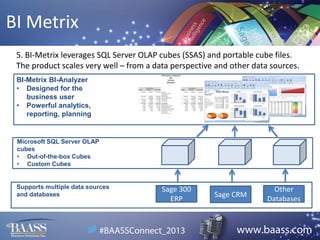

The document summarizes a presentation about demystifying business intelligence (BI) tools for an organization. It includes an agenda for presentations on four different BI tools: BAASS BI, Sage BI, Info Explorer, and BI Metrix. Each presentation section provides 3-5 key points about the features and benefits of the tool, such as customizable reporting, accessing multiple data sources, intuitive dashboards, and quick implementation timelines.