Scoro is a KPI dashboard software that allows users to track project, work, and financial KPIs across integrated software systems in real-time from a single or multiple dashboards. It aims to provide a single solution to manage different business functions like work, finances, projects, and reports. Pricing starts at $26 per user per month.
Is cloud and NDT a good mix? NDT has its own specificity. Clouds can truly simplify the file management, but is any cloud solution adapted for the NDT? For example, Dropbox may not work right out of the box for our market. This presentation highlights different avenues about clouds (IaaS, PaaS, and SaaS); and highlights NDT critical requirements (constraints and needs). A list of different levels of cloud services (component, option, security, ...) will be defined. It is important to remember that private and public servers are 2 possible avenues. NDT was an early user of private servers even before it was called a cloud. Overall the main idea is to optimize the operation process to reduce OPEX and to increase availability and accuracy of data.
See: www.amotus-solutions.com or www.nubitus.com
Join the professionals at BAASS as we answer your key quesons about Business Intelligence and how it can fit
within your business model. Dive deeper into how varying
soluons offered by our vendors can cater specifically to your business needs. Uncover technology that transforms raw data into meaningful and useful informaon for your key business funcons. You’ll hear from a wide range of
presenters and be able to uncover details regarding each of the following Business Intelligence Tools:
1. BAASS Business Intelligence
2. Sage Business Intelligence
3. Info Explorer
4. BI Metrix
5. Data Warehousing BI
8 ways i fieldsmart technologies helps aec firms leverage the cloud for fastiFieldsmart Technologies
iFieldSmart Technology is working on next generation construction management solutions for enhanced productivity, proactive risk management & realistic data availability at fingertips!
Intro of Key Features of Auto eCAAT Pro Softwarerafeq
This presentation provides a brief overview of Auto eCAAT Pro with use cases. Auto eCAAT Pro is a Data Analytics/BI software specially designed for CA Firms and their team to perform and automate analytics in the assignments of Assurance, Compliance and Fraud Investigations.
Intro of Key Features of SoftCAAT BI SQL Softwarerafeq
This presentation provides a brief overview of SoftCAAT BI SQL with use cases. SoftCAAT BI SQL is a Data Analytics/BI software specially designed for performing Analytics/BI/MIS on large volume of data in SQL in the assignments of Assurance, Compliance and Fraud Investigations.
Tableau Drive, A new methodology for scaling your analytic cultureTableau Software
Tableau Drive is a methodology for scaling out self-service analytics. Drive is based on best practices from successful enterprise deployments. The methodology relies on iterative, agile methods that are faster and more effective than traditional long-cycle deployment. A cornerstone of the approach is a new model of a partnership between business and IT.
The Drive Methodology is available for free. Some organizations will choose to execute Drive themselves; others will look to Tableau Services or Tableau Partners for expert help.
Intro of Key Features of Soft CAAT Ent Softwarerafeq
This presentation provides a brief overview of SoftCAAT Ent with use cases. SoftCAAT Ent is a data analytics/BI software used by CAs and CXOs for Assurance, Compliance and Fraud Investigations.
Intro of Key Features of SoftCAAT BI Softwarerafeq
This presentation provides a brief overview of SoftCAAT BI with use cases. SoftCAAT BI is a Data Analytics/BI/MIS software specially designed for performing analytics in the assignments of Assurance, Compliance, Consulting and Fraud Investigations.
Presentation given in San Francisco in January 2013 by myself and Paul Lawbaugh from Webtrends on the importance of capturing robust metrics to better understand the end user experience, build out strong KPIs and metrics, and optimize/improve based on data.
Intro of Key Features of SoftCAAT Pro softwarerafeq
This presentation provides an overview of key features of SoftCAAT Pro Software with use cases. SoftCAAT Pro is a independent Data Analytics designed specially for CA Firms and their teams to perform Data Analytics in assignments of Assurance, Compliance or Fraud Investigation.
ServiceNow + Precisely: Getting Business Value and Visibility from Mainframe ...Precisely
Your team has a huge responsibility to enable IT services without disruption for your organization. ServiceNow Service Mapping gives you a clear idea of how services are affected by infrastructure issues. However, you are missing one critical piece – visibility into the mainframe (IBM Z). To drive business value, you need visibility into service performance by automatically connecting mainframe CIs into your CMDB and ServiceNow Service Mapping.
In this webinar, Ian Hartley, Director of Product Management at Precisely, will discuss how Precisely Ironstream can help you with ITOM visibility by automatically linking your mainframe to ServiceNow Service Mapping in just a few clicks.
Watch this on-demand webcast to learn:
• The “must-dos” for a proactive approach to mainframe visibility in ServiceNow Service Mapping
• How to auto-populate the CMDB and ServiceNow with mainframe CIs
• The immediate value Ironstream can bring to your business by connecting the mainframe to ServiceNow
This presentation provides a brief overview of eCAAT BI with use cases. eCAAT BI is an add-in Software to MS Excel which can be used for performing Data Analytics/BI/MIS in the assignments of Assurance, Compliance, Consulting and Fraud Investigations.
This presentation provides brief overview of S-CAAT, add-in Software to MS Excel which enables user to perform analytics on SQL data from MS Excel. This empower users to perform complex analytics on SQL Data Analytics/BI from Excel in a few clicks.
This presentation provides brief overview of Auto S-CAAT, add-in Software to MS Excel which enables user to perform and automate analytics on SQL data from MS Excel. This empower users to Automate and perform complex analytics on SQL data Analytics/BI from Excel in a few clicks.
Intro of Key Features of SoftCAAT Ent SQL Softwarerafeq
This presentation provides a brief overview of SoftCAAT Ent SQL Version software with use cases. SoftCAAT is a Data analytics/BI software which can used for performing complex analytics on large voluem of data in SQL. SoftCAAT is primarily used by CAs and CXOs for Assurance/BI/MIS, Compliance and Fraud Investigations.
Corporate-training-for-msbi-course-in-mumbaiUnmesh Baile
Vibrant Technologies is headquarted in Mumbai,India.We are the best MSBI training provider in Navi Mumbai who provides Live Projects to students.We provide Corporate Training also.We are Best Microsoft Business Intelligence classes in Mumbai according to our students and corporators
Does your staff lose time and patience searching for information, client files and documents? Organizing, storing, searching for and retrieving documents should be easy to do, yet few firms have a well-planned document management strategy in place.
The right document management system can improve your firm’s efficiency, accuracy, and ultimately, profitability. But in order to achieve a good return on investment from any new document management system, you’ll need a solid workflow and process.
Intro of Key Features of Auto eCAAT Ent Softwarerafeq
This presentation provides a brief overview of Auto eCAAT Ent with use cases. Auto eCAAT Ent is a Data Analytics/BI software specially designed for automating analytics in the assignments of Assurance, Compliance and Fraud Investigations.
Intro of Key Features of Auto T-CAAT Pro 2021Dec01rafeq
This presentation provides an overview of the key features of Auto T-CAAT Pro, an add-in software to MS Excel which facilitates automation of import of masters and vouchers from Tally to MS Excel in a few clicks.
Taction has extensive experience in implementing BI environment, realizing the power of Tableau. Our Tableau experts have extensively created multiple industry specific BI platforms successfully integrating and consolidating distributed data sets using Tableau. This has helped all our customers in dealing with their BigData related concerns easily. From a simple data driven Graphical Tableau Dashboard to a complete Tableau Data Analytics ecosystem, our world class Tableau Consulting team will partner with you till you reach your Business Data goals. Our Tableau Consulting team will help you seamlessly integrate Tableau with your existing application framework to empower your employees, partners and customers with higher analytical capabilities with the power of Tableau’s Data Discovery and Data Visualization and hence dashboards and analytics.
This publication seeks to explain what business intelligence is, its history, usage in modern business operations and prospects into the future of BI.
The publication also mentions relevant software tool that help deliver business intelligence solutions.
In conclusion, each software offers unique features and benefits to help improve business operations. The pricing plans vary based on the size of the organization and the features needed. It is important to consider the specific needs of a business before choosing the right software solution.
Business Intelligence is more than just pretty visualsVincent Woon
Holistics is cloud BI that powers the data operations for businesses. We are self-funded, and our customers in the region include both young startups to large tech companies like Grab, Traveloka, Line Games, 99co, e27 and ShopBack.
We want to help people learn how to work with data, and make data work for them.
Companies ask questions from their data in the form of charts or numbers on a regular or adhoc basis. However, the process of preparing these data and reports is repetitive and time consuming. Data is also stored across different online applications which makes it difficult to have a single view of reporting.
Holistics automates the data pipeline process from source data to insights, reducing the time data teams spend preparing reports. Users can schedule email reports to be sent, or setup thresholds to notify them about changes in their business data.
There is a workspace for SQL analysts and data scientists to query, transform, and share datasets easily with each other. They can also troubleshoot slow-running queries on the fly without technical help.
Each Holistics dashboard can also be embedded in your in-house application, which reduces the time and effort for engineers to provide dashboards for their customers.
BUSINESS INTELLIGENCE
TECHNOLOGIES USED IN BUSINESS ANALYST:
Data Warehousing
Dashboards
Ad Hoc Reporting
Data Discovery
Cloud Data Services
BI TECHNOLOGIES USED:
SAP Business Intelligence
Tableau
TIBCO Spotfire
SAS Business Intelligence
MicroStrategy
Sisense
Yellowfin BI
Dundas BI
Systum
Microsoft Power BI
Looker
Clear Analytics
domo
Oracle BI
QlikView
How and Why: Embedded Analytics Interfaces For Your SaaS ProductAggregage
Sam and Jessica faced a problem that many product managers face: their customers wanted better analytics and reporting, but analytics wasn’t the core function of the SaaS product Sam and Jessica manage. To make things tougher, they needed something flexible, scalable and capable of serving different user types.
Modern Product Data Workflows: How and Why: Embedded Analytics Interfaces For...Hannah Flynn
Sam and Jessica faced a problem that many product managers face: their customers wanted better analytics and reporting, but analytics wasn’t the core function of the SaaS product Sam and Jessica manage. To make things tougher, they needed something flexible, scalable and capable of serving different user types.
How to Successfully Implement Cognos Self-ServiceSenturus
Learn best practices, how to do requirements discovery, and the pros and cons of Cognos architectural models so you can achieve agile, governed self-service on any analytics platform. View this on-demand webinar: https://senturus.com/resources/how-to-successfully-implement-self-service-analytics/.
Senturus offers a full spectrum of services in business intelligence and training on Cognos, Tableau and Power BI. Our resource library has hundreds of free live and recorded webinars, blog posts, demos and unbiased product reviews available on our website at: http://www.senturus.com/senturus-resources/.
IBM Cognos Analytics: Empowering business by infusing intelligence across the...IBM Analytics
Analytics leaders can now offer organizations the self-service they want while giving users the control they expect, redefining business intelligence in the process—all thanks to the IBM Cognos Analytics platform. Learn more at http://ibm.co/cognosanalytics.
Extracted data can give you useful insights into what is going on inside and outside your organization, which you can use to make important decisions. You can also take business intelligence services to get valuable insights from big data. To Know more about Business Intelligence Services,visit our website.
https://www.impressico.com/services/technical-capabilities/data-analytics-bi/
For a dashboard to truly provide value
and actionable insights, dashboard design must be approached leveraging meaningful data and analytics with the stakeholder in mind.
Webinar: How to Decipher Big Data to Enhance Your Client’s Social Media Perfo...Sendible
With the ever growing number of digital data sources that agencies have to manage and analyze for their clients, it’s becoming increasingly difficult to collate and extract actionable insights.
Digital analytics can be a gold mine for finding opportunities, not only for lead generation but to also give clear indications on what is and isn’t working in your strategy.
We’re frequently asked by agencies “How do we manage all our clients’ digital marketing data in a simplified way?”. To help answer this question we’ve teamed up with NinjaCat, a leader in reporting, monitoring and call tracking software for agencies. Together we show how advanced analytics help agencies create a superior social media and digital strategy for their clients.
We uncover the pain points agencies are facing in terms of data overload and how NinjaCat and Sendible can help overcome these hurdles, alongside building a strategy and gaining a holistic view of your clients’ digital analytics.
Discover the tools and strategy your agency needs to decipher the storm of data to help your clients succeed. This webinar covers:
- Pain points: The issues agencies face with Big Data.
- Streamline: The importance of meaningful and organized data.
- Centralize: How to create an agency data hub.
- KPIs: Create goals, that you can monitor and measure.
- Software: See the analytics features from NinjaCat and Sendible in action.
If you’re a digital agency that’s looking to increase productivity in managing your clients’ analytics and implement a data-driven strategy, then this webinar is a must.
View the full video at www.youtube.com/sendible
Data Visualization Trends - Next Steps for TableauArunima Gupta
Want answers to:
- What is data visualization?
- Why is it deemed disruptive in the field of analytics?
- What is Tableau?
Come view the slide deck!
Concludes with:
- Digital strategy recommendations for Tableau to become the winner in a winner-take-all-market
Jan 2017 Investment Recommendation for Tableaupaulchenuva
Buy Tableau was one of my stock pitches in 2017. I was predicting a 2x return. Instead, Tableau's stock increased over 4x since. Great to see Salesforce's acquisition today. Would love to hear your comments and feedback.
Introduction to Power BI a Business Intelligence Tool by Apurva RamtekeApurva Ramteke
Power BI is a tool which provides users with very intelligent statistical analysis of raw data and to derive beautiful reports out of it using hundreds of power Visualization. Not just it Power BI provides a build in advantage of Power Views and Power Queries derived from Excel as a base with a very easy process learning. I personally call it very Intelligently dumb tool, because its so easy for normal user to use it and make highly interactive reporting and Dashboards. The Dashboard which are created can be shared with multiple users with specific permission levels to access the reports.
Dall’inizio di ogni progetto fino alla fase di reporting, Companion consente di visualizzare l’impatto del progetto di miglioramento con riepiloghi automatici e aggiornati. Companion aiuta tutto il team di lavoro a completare i progetti in modo più veloce e coerente, fornendo al team e agli stakeholder una visione essenziale per prendere le giuste decisioni aziendali.
Companion è la soluzione per gestire, comprendere e condividere un programma continuo di miglioramento.
The Ultimate Guide To Embedded Analytics Poojitha B
Did you know that the lack of in-context data prevents you from making smarter business decisions - and as a result, missing out on key revenue opportunities?
The amount of information inside your company is constantly expanding, and to stay competitive, your data-insight strategy has to keep pace with business change. Here, we explore the benefits of using Infor BI and how using the platform can quickly transform raw data into valuable business insight. Infor BI is the one solution for all your data analytics needs.
[Note: This is a partial preview. To download this presentation, visit:
https://www.oeconsulting.com.sg/training-presentations]
Sustainability has become an increasingly critical topic as the world recognizes the need to protect our planet and its resources for future generations. Sustainability means meeting our current needs without compromising the ability of future generations to meet theirs. It involves long-term planning and consideration of the consequences of our actions. The goal is to create strategies that ensure the long-term viability of People, Planet, and Profit.
Leading companies such as Nike, Toyota, and Siemens are prioritizing sustainable innovation in their business models, setting an example for others to follow. In this Sustainability training presentation, you will learn key concepts, principles, and practices of sustainability applicable across industries. This training aims to create awareness and educate employees, senior executives, consultants, and other key stakeholders, including investors, policymakers, and supply chain partners, on the importance and implementation of sustainability.
LEARNING OBJECTIVES
1. Develop a comprehensive understanding of the fundamental principles and concepts that form the foundation of sustainability within corporate environments.
2. Explore the sustainability implementation model, focusing on effective measures and reporting strategies to track and communicate sustainability efforts.
3. Identify and define best practices and critical success factors essential for achieving sustainability goals within organizations.
CONTENTS
1. Introduction and Key Concepts of Sustainability
2. Principles and Practices of Sustainability
3. Measures and Reporting in Sustainability
4. Sustainability Implementation & Best Practices
To download the complete presentation, visit: https://www.oeconsulting.com.sg/training-presentations
Explore our most comprehensive guide on lookback analysis at SafePaaS, covering access governance and how it can transform modern ERP audits. Browse now!
Cracking the Workplace Discipline Code Main.pptxWorkforce Group
Cultivating and maintaining discipline within teams is a critical differentiator for successful organisations.
Forward-thinking leaders and business managers understand the impact that discipline has on organisational success. A disciplined workforce operates with clarity, focus, and a shared understanding of expectations, ultimately driving better results, optimising productivity, and facilitating seamless collaboration.
Although discipline is not a one-size-fits-all approach, it can help create a work environment that encourages personal growth and accountability rather than solely relying on punitive measures.
In this deck, you will learn the significance of workplace discipline for organisational success. You’ll also learn
• Four (4) workplace discipline methods you should consider
• The best and most practical approach to implementing workplace discipline.
• Three (3) key tips to maintain a disciplined workplace.
Taurus Zodiac Sign_ Personality Traits and Sign Dates.pptxmy Pandit
Explore the world of the Taurus zodiac sign. Learn about their stability, determination, and appreciation for beauty. Discover how Taureans' grounded nature and hardworking mindset define their unique personality.
Accpac to QuickBooks Conversion Navigating the Transition with Online Account...PaulBryant58
This article provides a comprehensive guide on how to
effectively manage the convert Accpac to QuickBooks , with a particular focus on utilizing online accounting services to streamline the process.
As a business owner in Delaware, staying on top of your tax obligations is paramount, especially with the annual deadline for Delaware Franchise Tax looming on March 1. One such obligation is the annual Delaware Franchise Tax, which serves as a crucial requirement for maintaining your company’s legal standing within the state. While the prospect of handling tax matters may seem daunting, rest assured that the process can be straightforward with the right guidance. In this comprehensive guide, we’ll walk you through the steps of filing your Delaware Franchise Tax and provide insights to help you navigate the process effectively.
Affordable Stationery Printing Services in Jaipur | Navpack n PrintNavpack & Print
Looking for professional printing services in Jaipur? Navpack n Print offers high-quality and affordable stationery printing for all your business needs. Stand out with custom stationery designs and fast turnaround times. Contact us today for a quote!
"𝑩𝑬𝑮𝑼𝑵 𝑾𝑰𝑻𝑯 𝑻𝑱 𝑰𝑺 𝑯𝑨𝑳𝑭 𝑫𝑶𝑵𝑬"
𝐓𝐉 𝐂𝐨𝐦𝐬 (𝐓𝐉 𝐂𝐨𝐦𝐦𝐮𝐧𝐢𝐜𝐚𝐭𝐢𝐨𝐧𝐬) is a professional event agency that includes experts in the event-organizing market in Vietnam, Korea, and ASEAN countries. We provide unlimited types of events from Music concerts, Fan meetings, and Culture festivals to Corporate events, Internal company events, Golf tournaments, MICE events, and Exhibitions.
𝐓𝐉 𝐂𝐨𝐦𝐬 provides unlimited package services including such as Event organizing, Event planning, Event production, Manpower, PR marketing, Design 2D/3D, VIP protocols, Interpreter agency, etc.
Sports events - Golf competitions/billiards competitions/company sports events: dynamic and challenging
⭐ 𝐅𝐞𝐚𝐭𝐮𝐫𝐞𝐝 𝐩𝐫𝐨𝐣𝐞𝐜𝐭𝐬:
➢ 2024 BAEKHYUN [Lonsdaleite] IN HO CHI MINH
➢ SUPER JUNIOR-L.S.S. THE SHOW : Th3ee Guys in HO CHI MINH
➢FreenBecky 1st Fan Meeting in Vietnam
➢CHILDREN ART EXHIBITION 2024: BEYOND BARRIERS
➢ WOW K-Music Festival 2023
➢ Winner [CROSS] Tour in HCM
➢ Super Show 9 in HCM with Super Junior
➢ HCMC - Gyeongsangbuk-do Culture and Tourism Festival
➢ Korean Vietnam Partnership - Fair with LG
➢ Korean President visits Samsung Electronics R&D Center
➢ Vietnam Food Expo with Lotte Wellfood
"𝐄𝐯𝐞𝐫𝐲 𝐞𝐯𝐞𝐧𝐭 𝐢𝐬 𝐚 𝐬𝐭𝐨𝐫𝐲, 𝐚 𝐬𝐩𝐞𝐜𝐢𝐚𝐥 𝐣𝐨𝐮𝐫𝐧𝐞𝐲. 𝐖𝐞 𝐚𝐥𝐰𝐚𝐲𝐬 𝐛𝐞𝐥𝐢𝐞𝐯𝐞 𝐭𝐡𝐚𝐭 𝐬𝐡𝐨𝐫𝐭𝐥𝐲 𝐲𝐨𝐮 𝐰𝐢𝐥𝐥 𝐛𝐞 𝐚 𝐩𝐚𝐫𝐭 𝐨𝐟 𝐨𝐮𝐫 𝐬𝐭𝐨𝐫𝐢𝐞𝐬."
Premium MEAN Stack Development Solutions for Modern BusinessesSynapseIndia
Stay ahead of the curve with our premium MEAN Stack Development Solutions. Our expert developers utilize MongoDB, Express.js, AngularJS, and Node.js to create modern and responsive web applications. Trust us for cutting-edge solutions that drive your business growth and success.
Know more: https://www.synapseindia.com/technology/mean-stack-development-company.html
Putting the SPARK into Virtual Training.pptxCynthia Clay
This 60-minute webinar, sponsored by Adobe, was delivered for the Training Mag Network. It explored the five elements of SPARK: Storytelling, Purpose, Action, Relationships, and Kudos. Knowing how to tell a well-structured story is key to building long-term memory. Stating a clear purpose that doesn't take away from the discovery learning process is critical. Ensuring that people move from theory to practical application is imperative. Creating strong social learning is the key to commitment and engagement. Validating and affirming participants' comments is the way to create a positive learning environment.
RMD24 | Debunking the non-endemic revenue myth Marvin Vacquier Droop | First ...BBPMedia1
Marvin neemt je in deze presentatie mee in de voordelen van non-endemic advertising op retail media netwerken. Hij brengt ook de uitdagingen in beeld die de markt op dit moment heeft op het gebied van retail media voor niet-leveranciers.
Retail media wordt gezien als het nieuwe advertising-medium en ook mediabureaus richten massaal retail media-afdelingen op. Merken die niet in de betreffende winkel liggen staan ook nog niet in de rij om op de retail media netwerken te adverteren. Marvin belicht de uitdagingen die er zijn om echt aansluiting te vinden op die markt van non-endemic advertising.
Business Valuation Principles for EntrepreneursBen Wann
This insightful presentation is designed to equip entrepreneurs with the essential knowledge and tools needed to accurately value their businesses. Understanding business valuation is crucial for making informed decisions, whether you're seeking investment, planning to sell, or simply want to gauge your company's worth.
RMD24 | Retail media: hoe zet je dit in als je geen AH of Unilever bent? Heid...BBPMedia1
Grote partijen zijn al een tijdje onderweg met retail media. Ondertussen worden in dit domein ook de kansen zichtbaar voor andere spelers in de markt. Maar met die kansen ontstaan ook vragen: Zelf retail media worden of erop adverteren? In welke fase van de funnel past het en hoe integreer je het in een mediaplan? Wat is nu precies het verschil met marketplaces en Programmatic ads? In dit half uur beslechten we de dilemma's en krijg je antwoorden op wanneer het voor jou tijd is om de volgende stap te zetten.
RMD24 | Retail media: hoe zet je dit in als je geen AH of Unilever bent? Heid...
Every kpi dashboard list
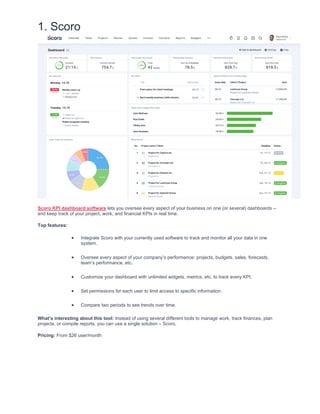
1. 1. Scoro
Scoro KPI dashboard software lets you oversee every aspect of your business on one (or several) dashboards –
and keep track of your project, work, and financial KPIs in real time.
Top features:
• Integrate Scoro with your currently used software to track and monitor all your data in one
system.
• Oversee every aspect of your company’s performance: projects, budgets, sales, forecasts,
team’s performance, etc.
• Customize your dashboard with unlimited widgets, metrics, etc. to track every KPI.
• Set permissions for each user to limit access to specific information.
• Compare two periods to see trends over time.
What’s interesting about this tool: Instead of using several different tools to manage work, track finances, plan
projects, or compile reports, you can use a single solution – Scoro.
Pricing: From $26 user/month
2. 2. Datapine
Datapine lets you visualize and monitor your most relevant KPIs in a single place.
Top features:
• Advanced analytics
• Custom formulas
• Automated reporting
• Interactive dashboards
• Intelligent alarms
What’s interesting about this tool: Datapine discovers new relationships and detect trends to take the guesswork
out of your business decisions.
Pricing: From $249 month + $55 user/month
3. 3. InetSoft
InetSoft is an analytic dashboard & reporting software backed by data mashup with big data scalability.
Top features:
• Professional atomic data block modeling
• End-user data mashup on the web
• Embedded dashboarding
• Dashboard and visualization annotations
• A high-performance, secure infrastructure
What’s interesting about this tool: InetSoft is a powerful data mashup software that enables a fast and flexible
transformation of data from disparate sources, which can either supplement or obviate a data warehouse solution.
Pricing: On request
4. 4. Tableau
Tableau helps the world’s largest organizations unleash the power of their most valuable assets: their data and their
people.
Top features:
• Get up and running in minutes and seamlessly add users as your needs grow.
• Automatically refresh data from web apps like Google Analytics or Salesforce.
• Give external teams, partners, and clients secure access to analytics.
• Empower site admins to easily manage authentication and permissions for users, content, and
data.
What’s interesting about this tool: Tableau is an excellent solution for companies who have clients with a few
users and who need to deploy solutions in multiple organizations—and who don’t have the infrastructure to create
their own server installation.
Pricing: $42 user/month (billed annually)
5. 5. SimpleKPI
Top features:
• Powerful and flexible KPI dashboards
• Standard and customizable KPI Reports
• Shareable reports, dashboards, and analytics
• Streamlined KPI analytics
What’s interesting about this tool: SimpleKPI lets you tailor your dashboards and reports to your branding.
Pricing: $109/month
6. 6. Smartsheet
Smartsheet links with third-party apps like Tableau, Excel, Qlik Sense, QlikView, and others – allowing you to deliver
powerful data visibility and insights via the tools you already use.
Top features:
• Share your work with other team members, or simply collaborate on a specific task.
• Set automated alerts to remind you (and others on your team) about upcoming tasks and
approaching deadlines.
• Give teams a more visual way to work, communicate, and collaborate.
• Get a quick, visual status of their top projects, see summary reports on goals, view important
deadlines, and follow links to key information.
What’s interesting about this tool: Smartsheet is trusted by over 50% of the Fortune 500.
Pricing: From $15 month/user for teams
7. 7. Bilbeo
Bilbeo uses scoring and advanced data visualization to auto-populate your business dashboard with intuitive drill-
down capabilities.
Top features:
• Smart alerts
• Leading indicators algorithm
• Custom reports
• Unlimited dashboards
• Collaboration
What’s interesting about this tool: No setup required from the user. No design. No coding. Just an automatic KPI
dashboard that provides a unified view of your business and saves you time and effort.
Pricing: From $49 user/month
8. 8. Target Dashboard
Target Dashboard connects and mixes all of your information into one place. It is powerful and proactive, delivering
essential information and driving growth.
Top features:
• Progress emails warn of dangers and add accountability
• Mix data from different sources.
• Unlimited users
What’s interesting about this tool: Target Dashboard can help you modify, re-share, or summarise data to make it
easy to report on.
Pricing: From $159/month
9. 9. Databox
Databox gets everyone focused on the metrics that matter – in the office, the hall, or at meetings.
Top features:
• Set time-bound, numeric goals, and track progress automatically.
• Create beautiful reports with no coding required.
• Beautifully designed mobile apps
What’s interesting about this tool: Marketing agency or consultant? Automate your client reporting to stop wasting
time cutting and pasting your reports together, use data to drive retention, and identify upsell opportunities.
Pricing: Free for up to 3 users, from $49 for larger teams
10. 10. InfoCaptor
InfoCaptor lets you examine data from different angles and get the “Aha moment!”
Top features:
• Rapid analytics
• Ad-hoc visualization
• Prototyping mockups
• Security and data governance
What’s interesting about this tool: InfoCaptor lets you embed dashboard, or individual widgets live on any web
page.
Pricing: From $29/month
11. 11. KPI Fire
Rather than overwhelm you with features and complexity, KPI Fire makes managing your business fast and easy.
Top features:
• Align employees & projects to your strategic goals.
• Manage projects & demonstrate progress in real-time, at a glance.
• Ready to use on any device, no download required.
What’s interesting about this tool: KPI Fire lets you capture and reward everyone’s best ideas.
Pricing: On request
12. 12. Dasheroo
Dasheroo brings business performance metrics from all your favorite applications to one beautiful free dashboard.
Top features:
• Intelligent insights
• Metrics alerts
• Team collaboration
• Dashboard exports
What’s interesting about this tool: Sharing is caring, and productive when you’re working together across your
dashboards. Comment and chat real-time right from within Dasheroo!
Pricing: Free & paid plans
13. 13. HandyKPI
HandyKPI brings the performance of your business and team to the palm of your hand.
Top features:
• Control business KPIs in a mobile app.
• Collect or deliver KPIs to your team in seconds.
• Upload your Excel spreadsheets.
• Analyze changes over time: by days, by months, by years.
• Integrate with your software.
What’s interesting about this tool: HandyKPI is focused on mobile data visualization.
Pricing: Free for up to 3 users, $5 user/month
14. 14. Grow
Grow is a reporting and BI dashboard software that helps to accelerate your growth.
Top features:
• Connect to your data using integrations, databases, CRMs, financials, spreadsheets, and more.
• Select the data you want to build a customized chart or add pre-built metrics to your BI
dashboard instantly.
• Set the Grow timer to refresh your data.
What’s interesting about this tool: With Grow, you can get specific answers by blending, mashing, and comparing
data from different sources – get insights tailored to your business.
Pricing: On Request
15. 15. Sisense
Sisense gives you the easiest way to create insights and business value from complex data.
Top features:
• Create and manage complex data models from multiple sources in a simple drag & drop
environment.
• See your data come to life in interactive web dashboards with a host of visualization options.
• See immediate ROI from your BI project.
• Open platform
What’s interesting about this tool: Sisense comes with everything you need to easily prepare, analyze, and
visualize complex data, saving you the need to invest in additional tools or specialized staff.
Pricing: On request
16. 16. Klipfolio
Klipfolio is a cloud app for building and sharing real-time business dashboards on web browsers, TV monitors, and
mobile devices, that helps you stay in control of your business by giving you visibility into your most important data
and metrics.
Top features:
• Supports direct connections to over 100 cloud applications like Twitter, Moz,
Pingdom, Salesforce, Google Analytics, Xero, and more
• Pre-built data visualization
• Access your data from anywhere
• A robust data visualization editor
What’s interesting about this tool: Many of the custom metrics you need for your dashboard will require some
math. Unlike many dashboard solutions, Klipfolio gives you the ability to do the math you need to create meaningful
dashboards.
Pricing: From $24 / 5 users
17. 17. Zoho Reports
Zoho Reports is a BI and analytics solution that allows you to create insightful reports and dashboards.
Top features:
• Connect to any data source.
• Visual analysis
• Sharing and collaboration
• White labeling
• Scalable BI platform
What’s interesting about this tool: Zoho Reports is governed by strong Zoho Security Practices, including support
for redundancy, backup, confidentiality & privacy to help ensure your data is secure & safe.
Pricing: From $55 / month (5 users)
18. 18. Geckoboard
Geckoboard lets you broadcast live business metrics, KPIs, and goals to your team in an easy-to-understand way.
Top features:
• Pull live metrics from popular business tools into Geckoboard without any technical know-how
• Effortlessly turn data tracked in a Google Sheet or Excel file into live visualizations
• Visualize metrics from databases, in-house systems, and third-party software
• Quickly share a link to your dashboard in an email or chat
What’s interesting about this tool: Geckoboard is optimized for your office wall – build a TV dashboard in minutes
using a drag-and-drop interface.
Pricing: From $25 user/month
19. 19. iDashboards
iDashboards business intelligence software lets you build interactive, custom dashboards with a simple drag-and-
drop tool.
Top features:
• Create dashboards with custom charts and graphs.
• Interact with every layer of data, ask and answer their own questions.
• Build charts using a mix of data sources in a single dashboard, and spot hidden trends at a
glance.
What’s interesting about this tool: iDashboards has real-time email and text alerts, so you can stay on top of your
metrics whenever or wherever you are.
Pricing: From $29.95 user/month (billed annually)
20. 20. Scoreboard
Scoreboard tracks your key performance indicators with dashboards, reports, and alerts.
Top features:
• Track KPIs.
• Share with anyone.
• Earned value management
• Prebuilt and custom reports
• Alerts
• Presentations
What’s interesting about this tool: Scoreboard works great on all screen sizes, from your cell phone to your board
room projector.
Pricing: From $55 user/month
21. 21. Ubiq
Ubiq is a web-based reporting tool for MySQL, PostgreSQL database that makes it easy to analyze business data.
Top features:
• Unlimited databases and charts
• Drag & drop chart creator and report designer
• Custom formula/variables
• Export as PDF/CSV/image
What’s interesting about this tool: Ubiq is easily customizable, to change a dashboard theme, just select an option
from the dropdown of dashboard themes.
Pricing: From $18/month