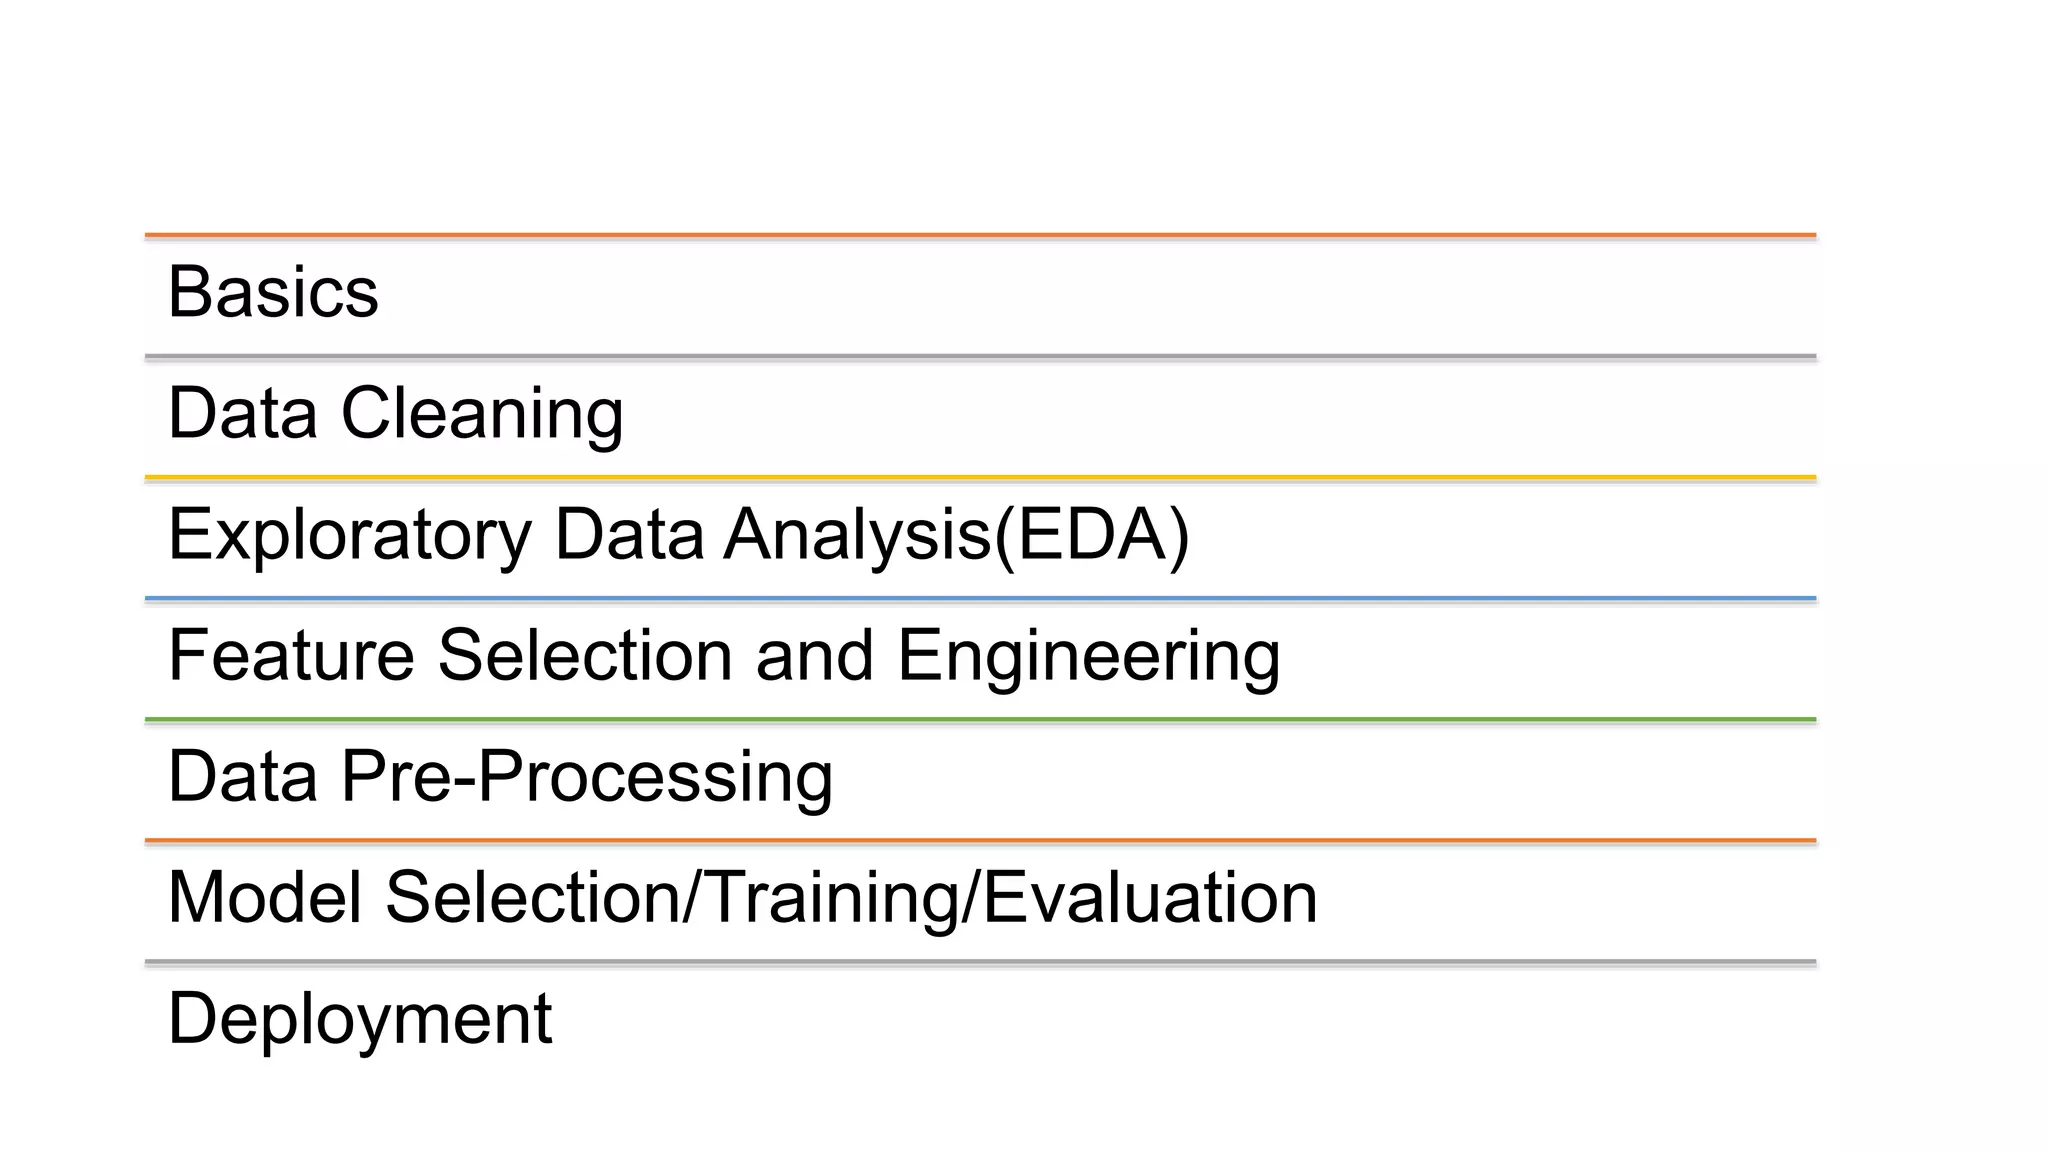
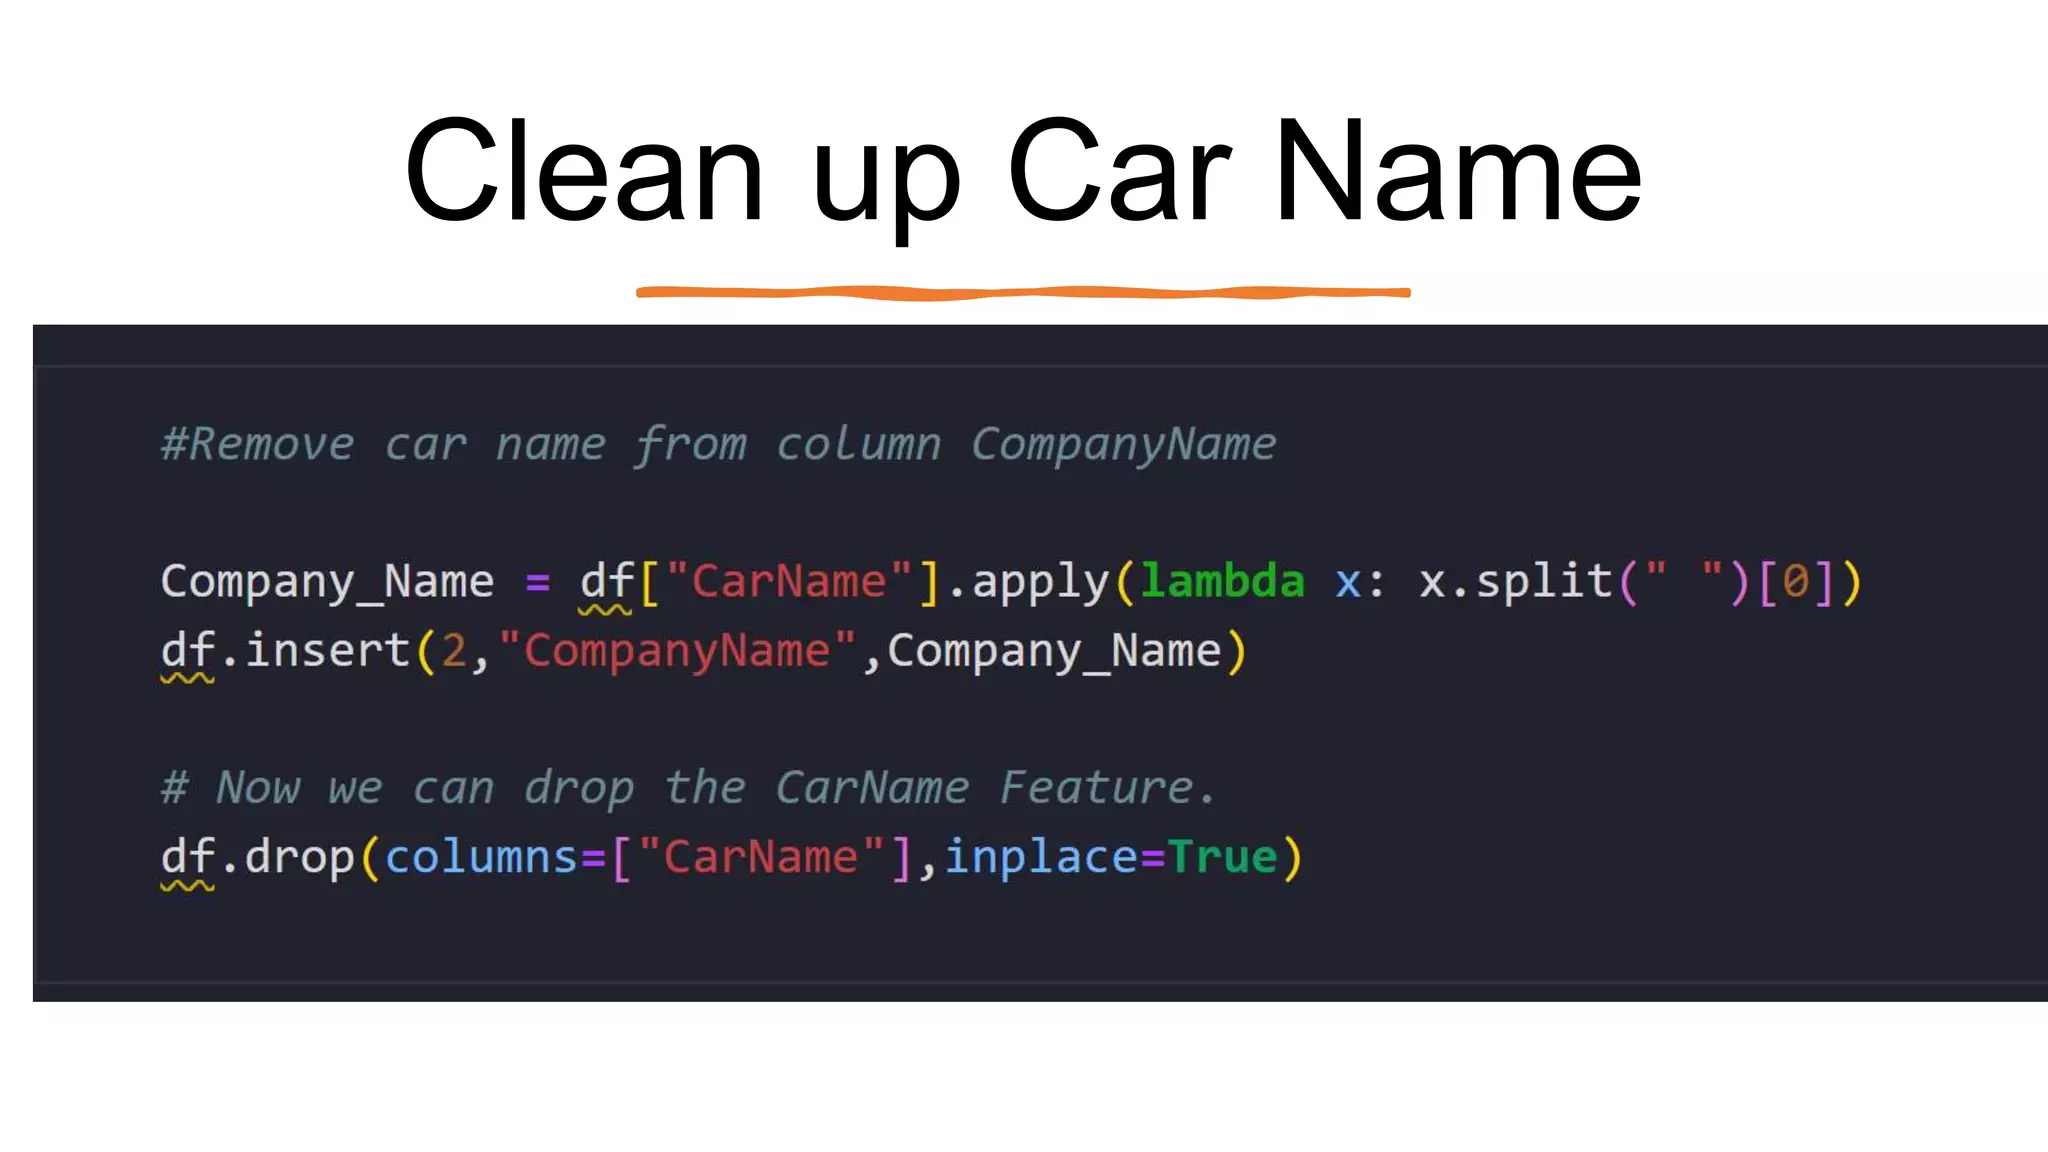
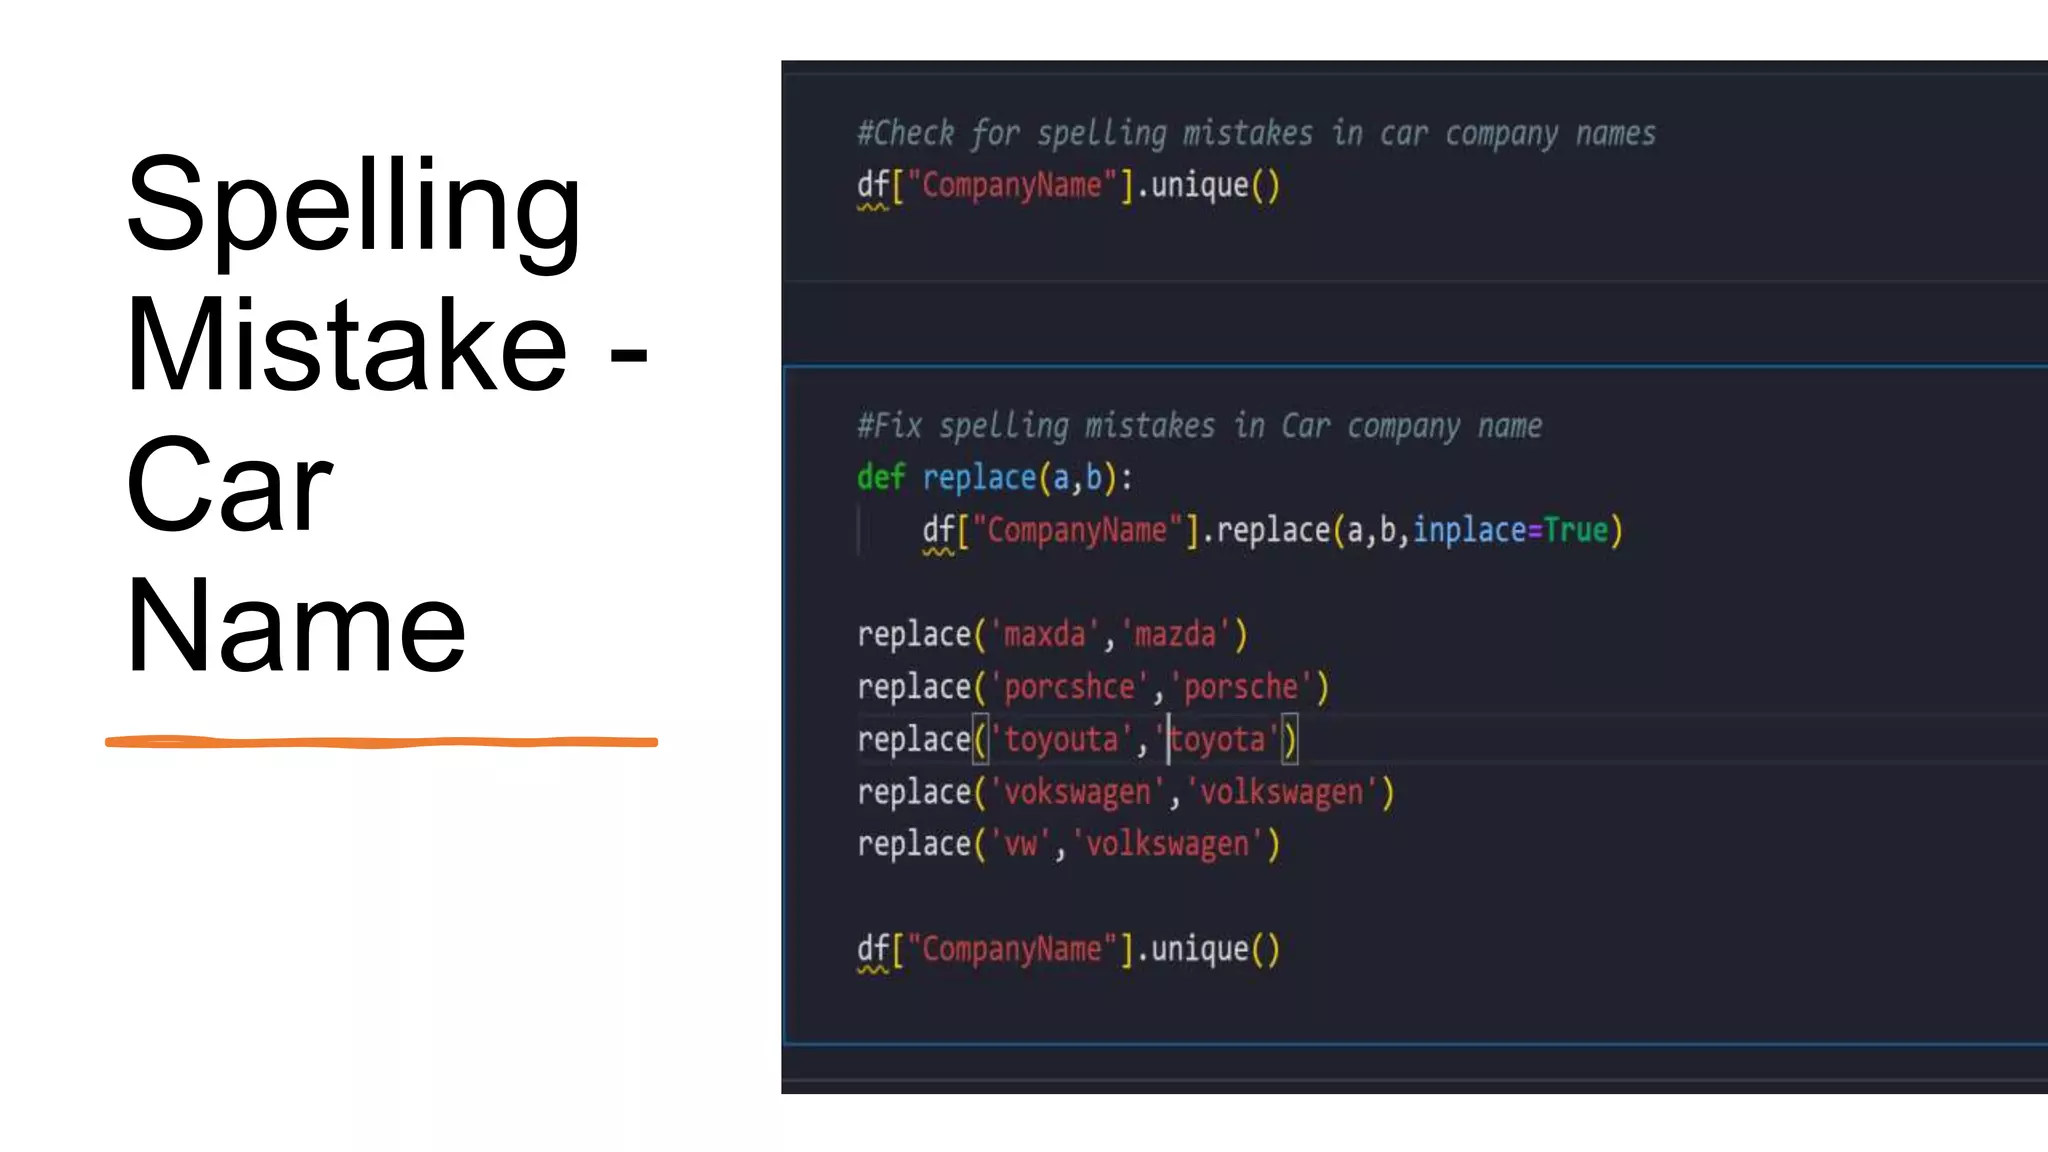
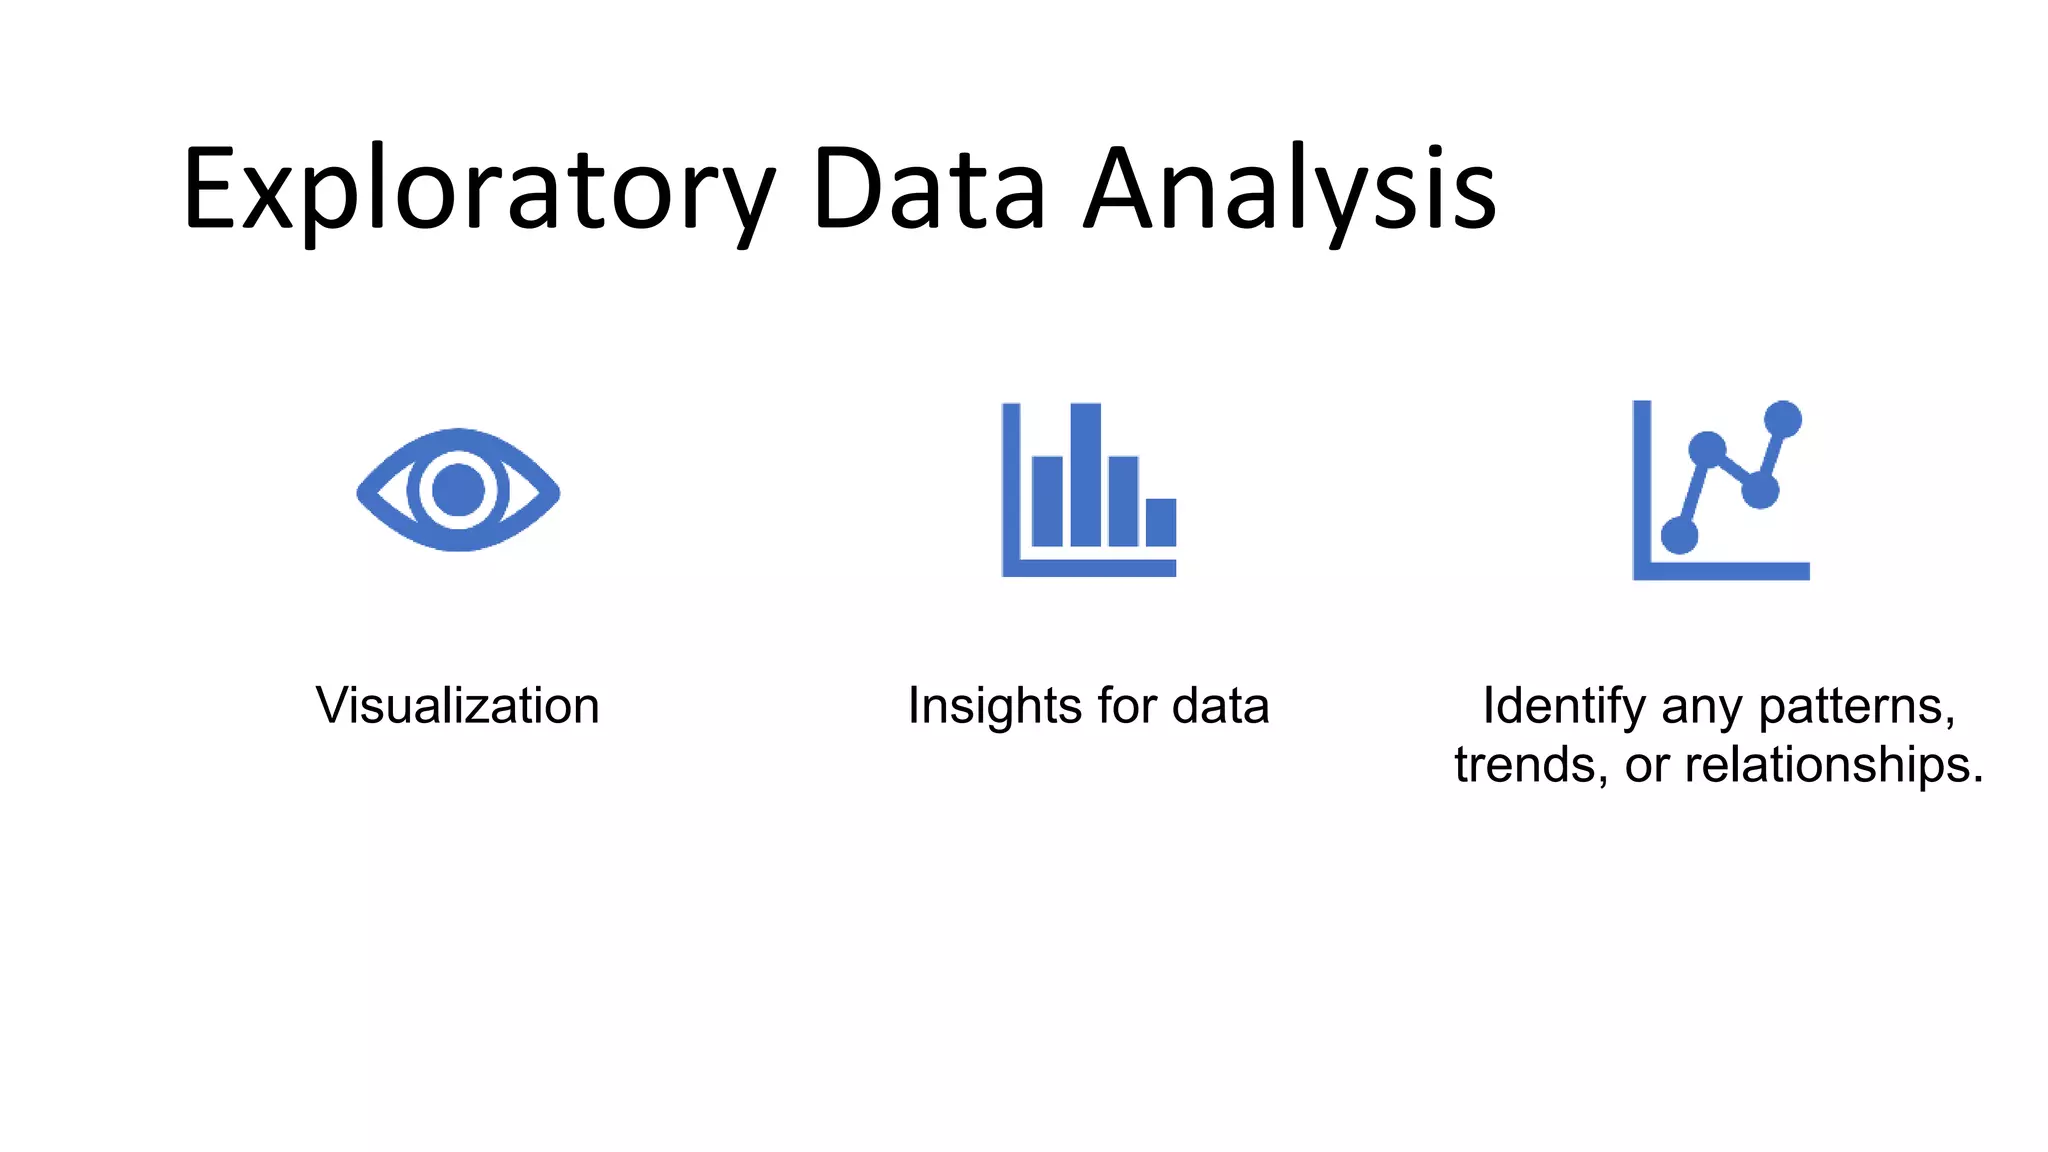
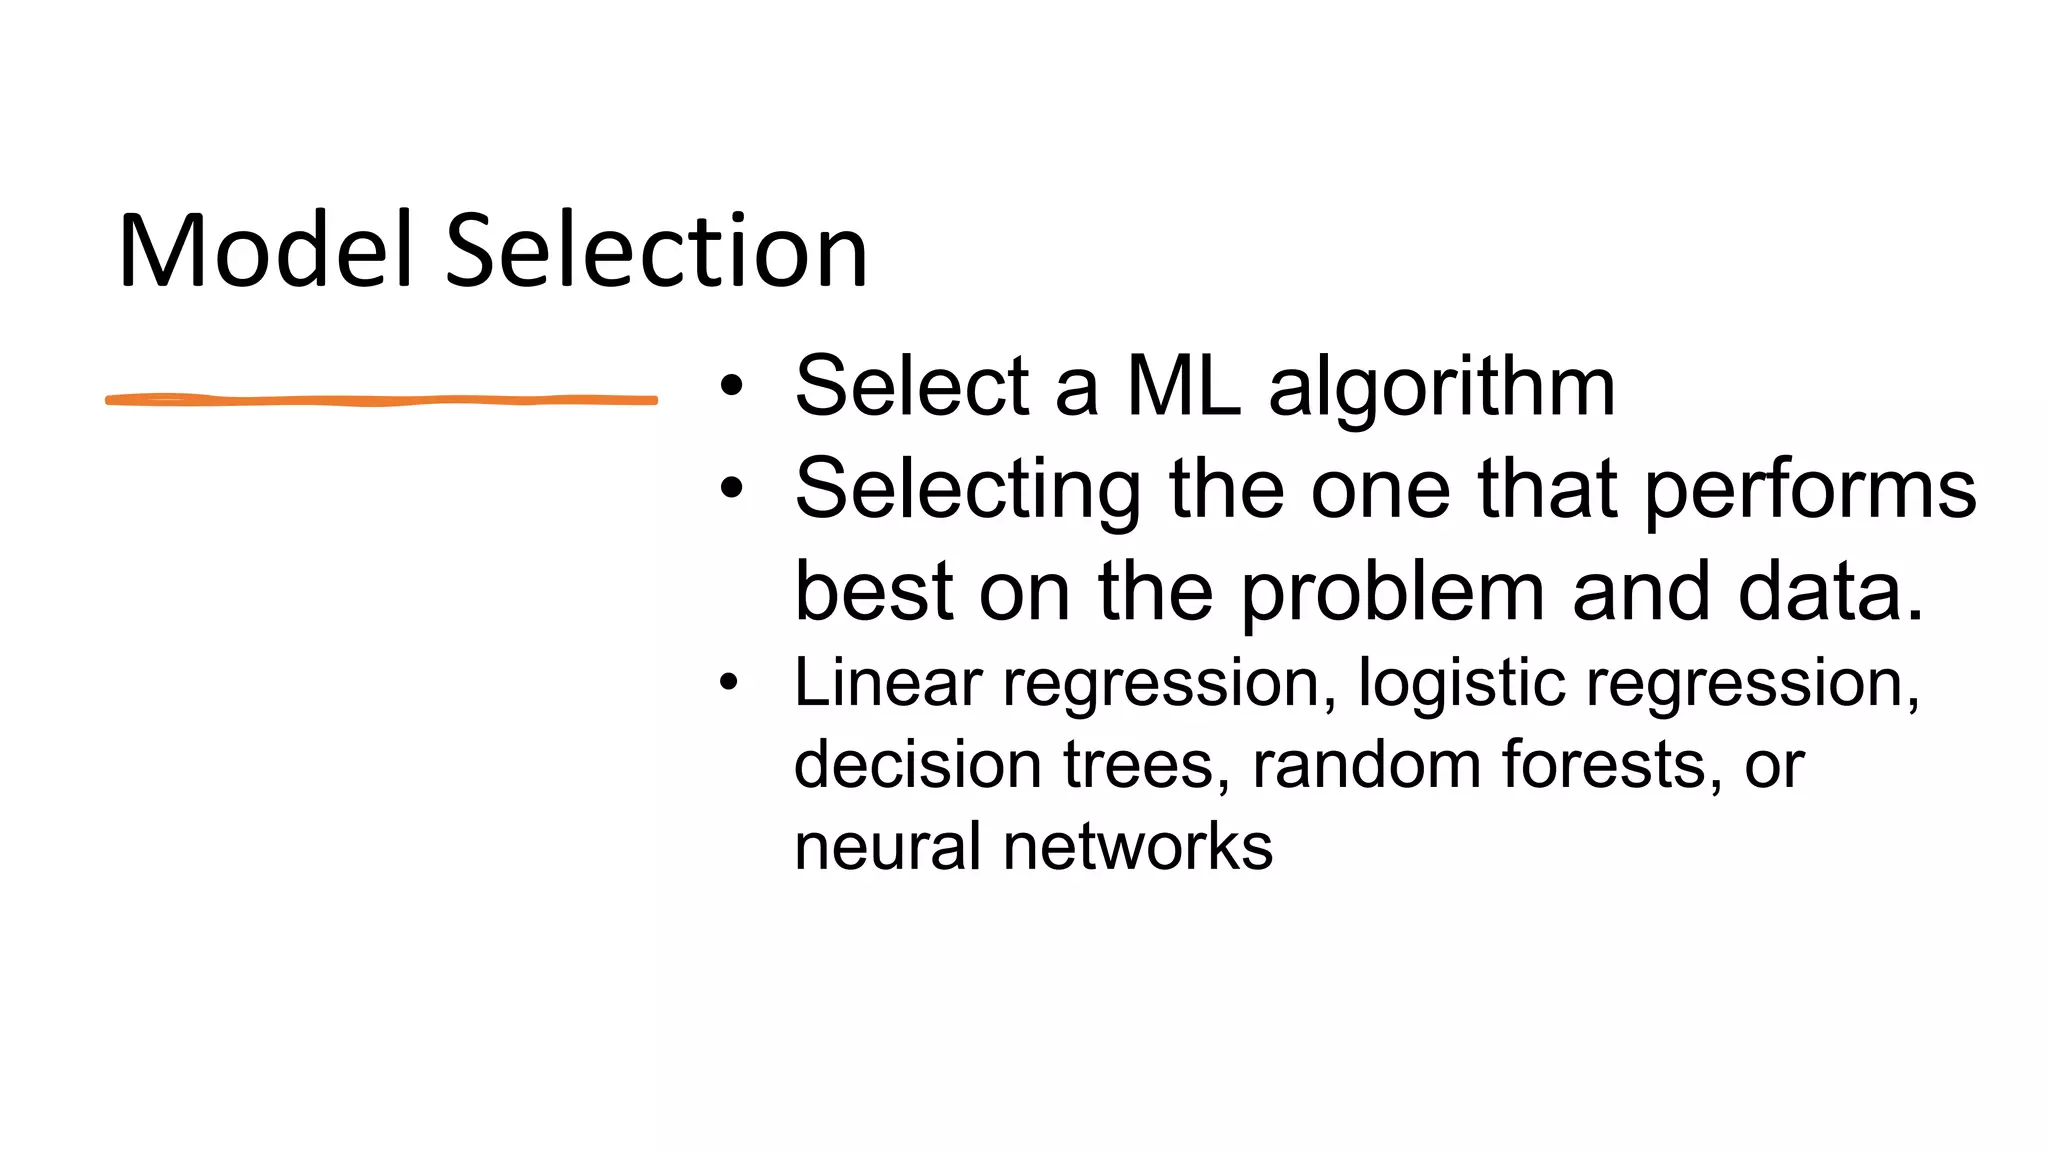
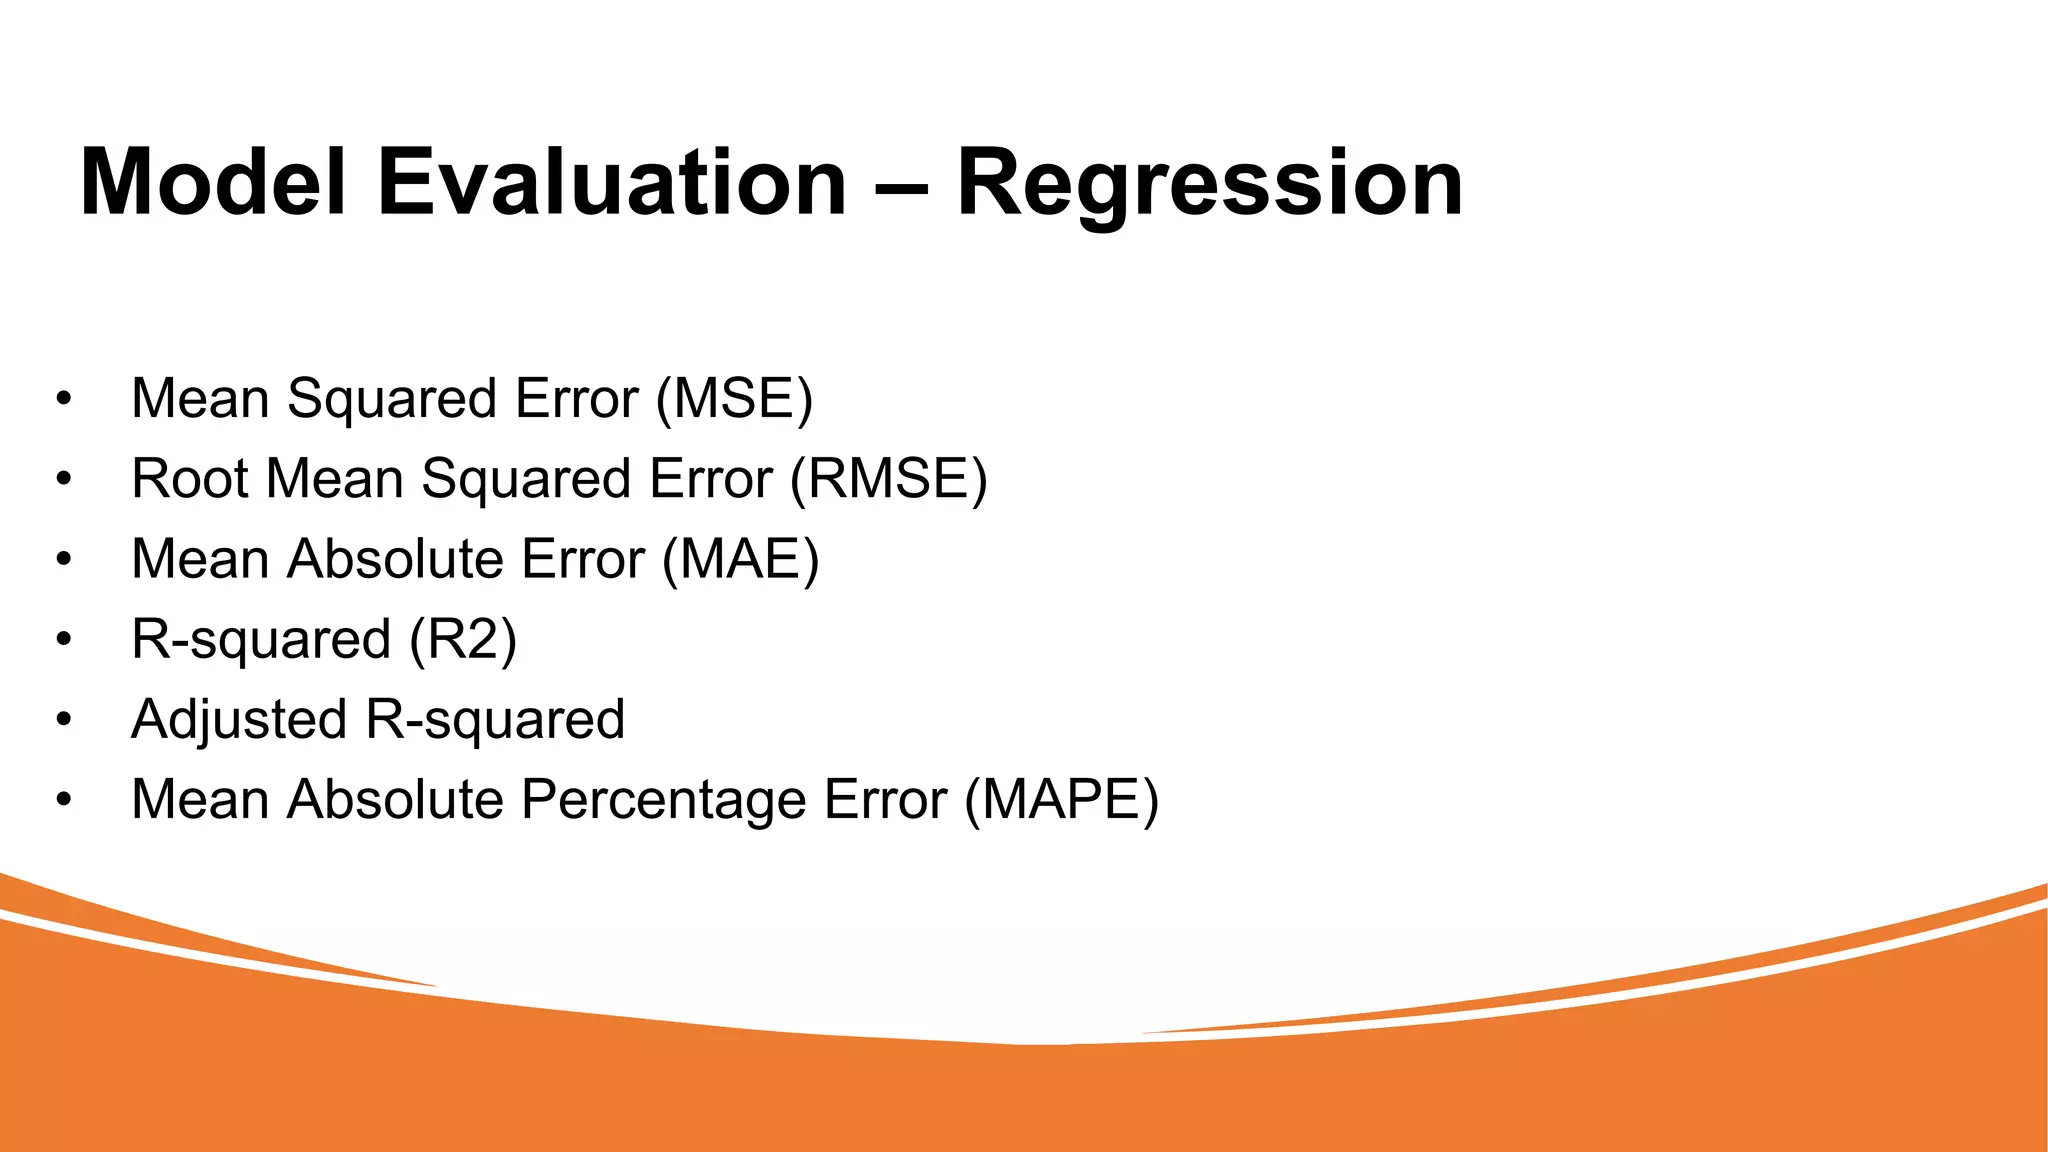
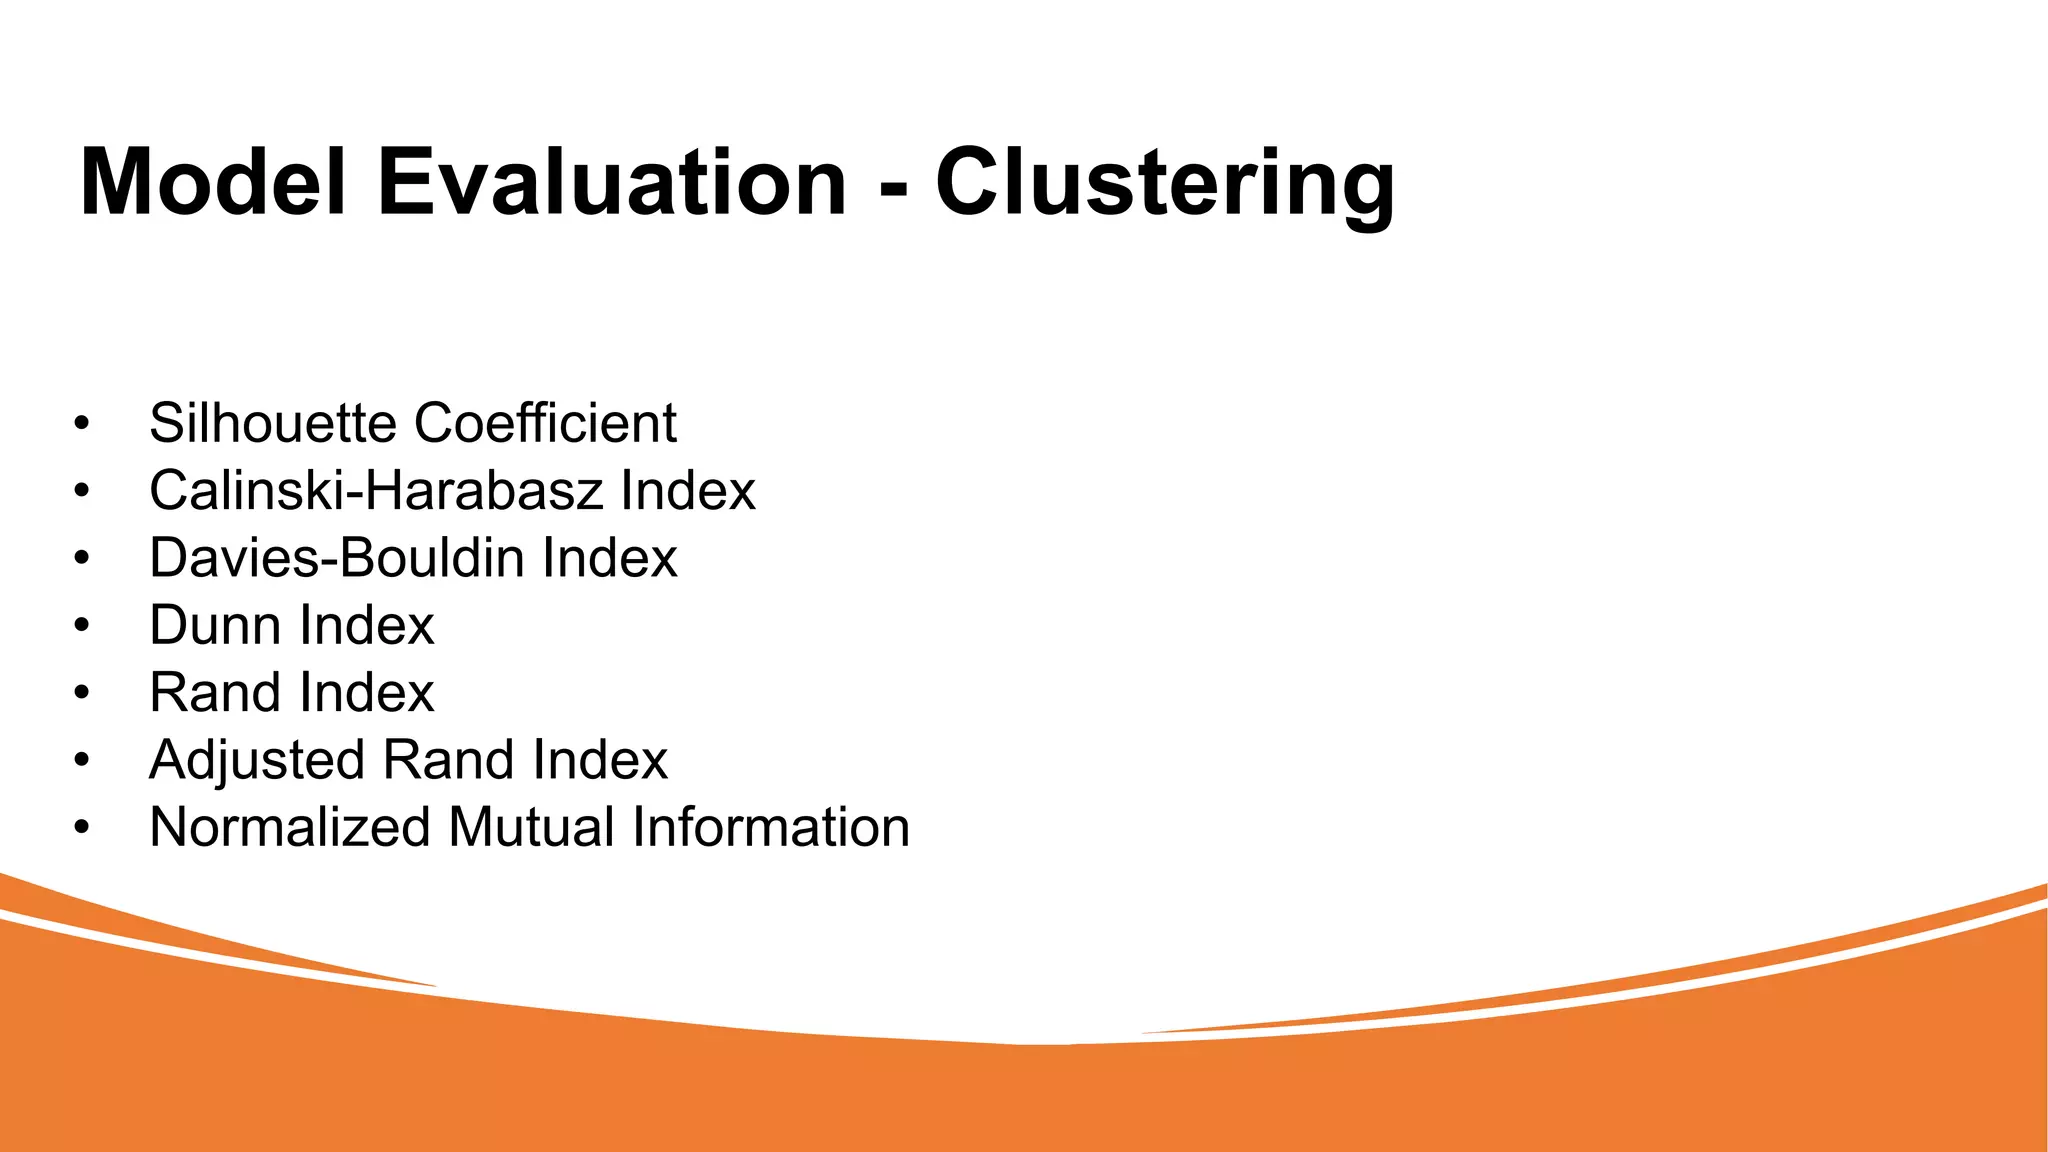
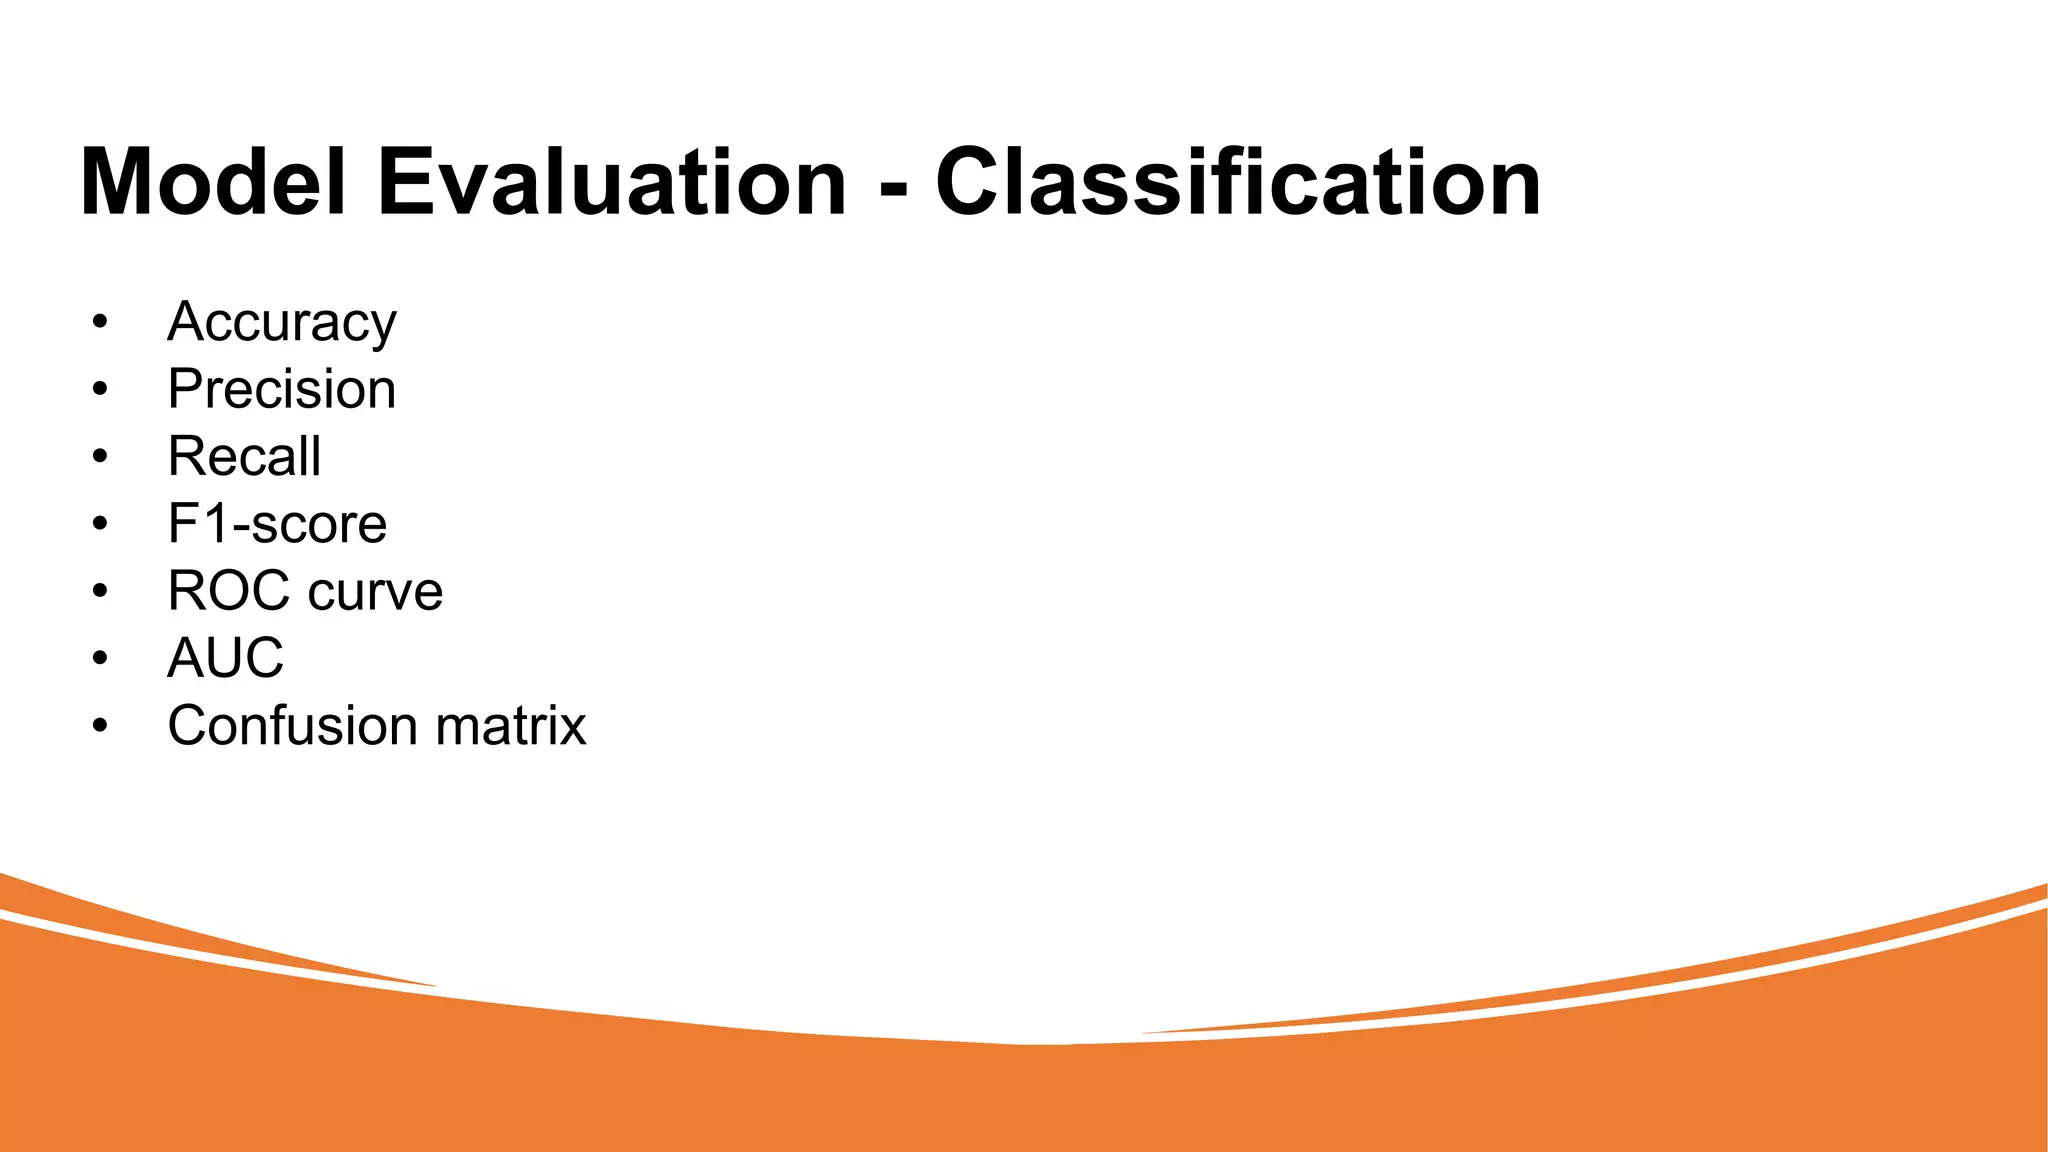
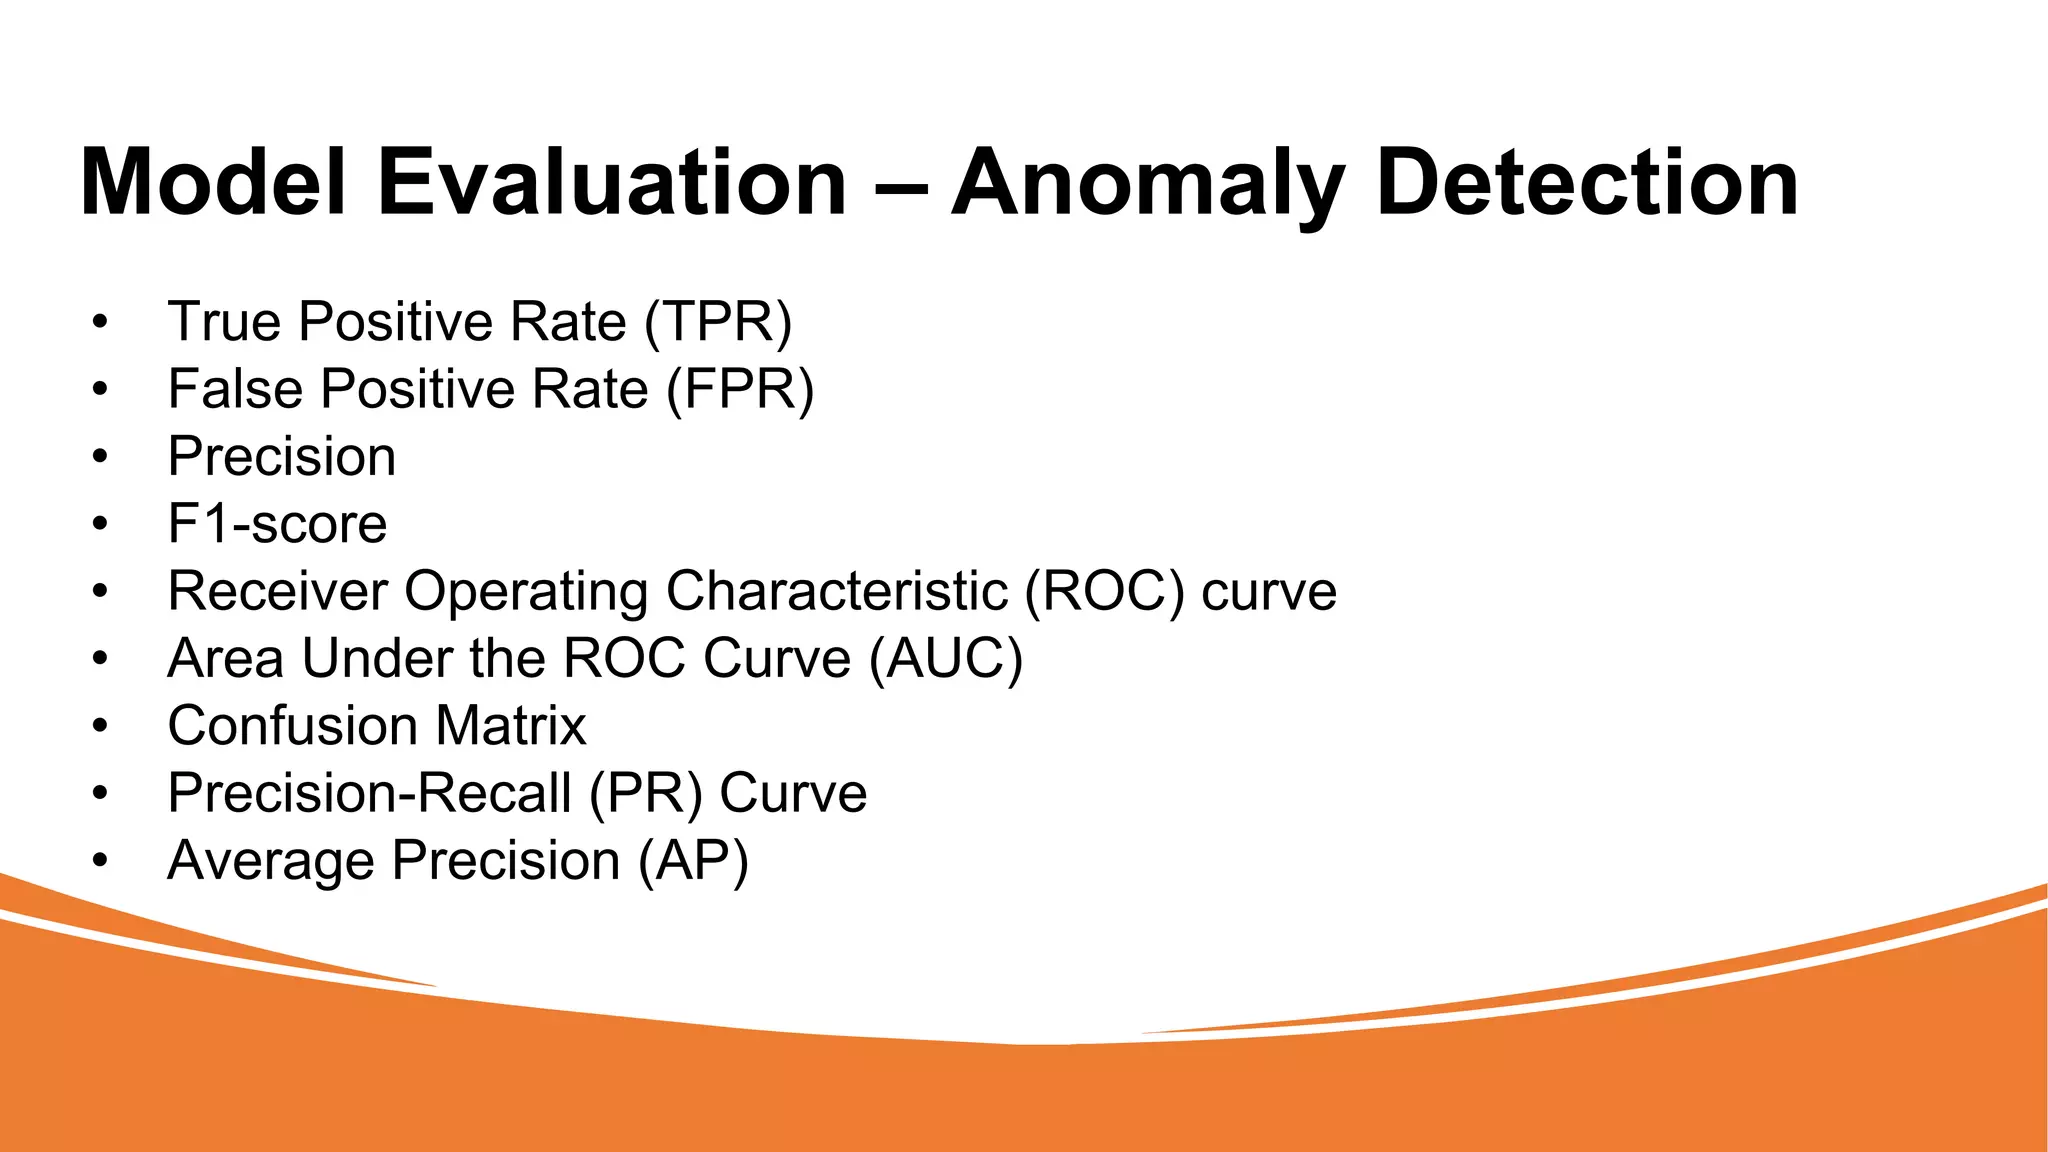
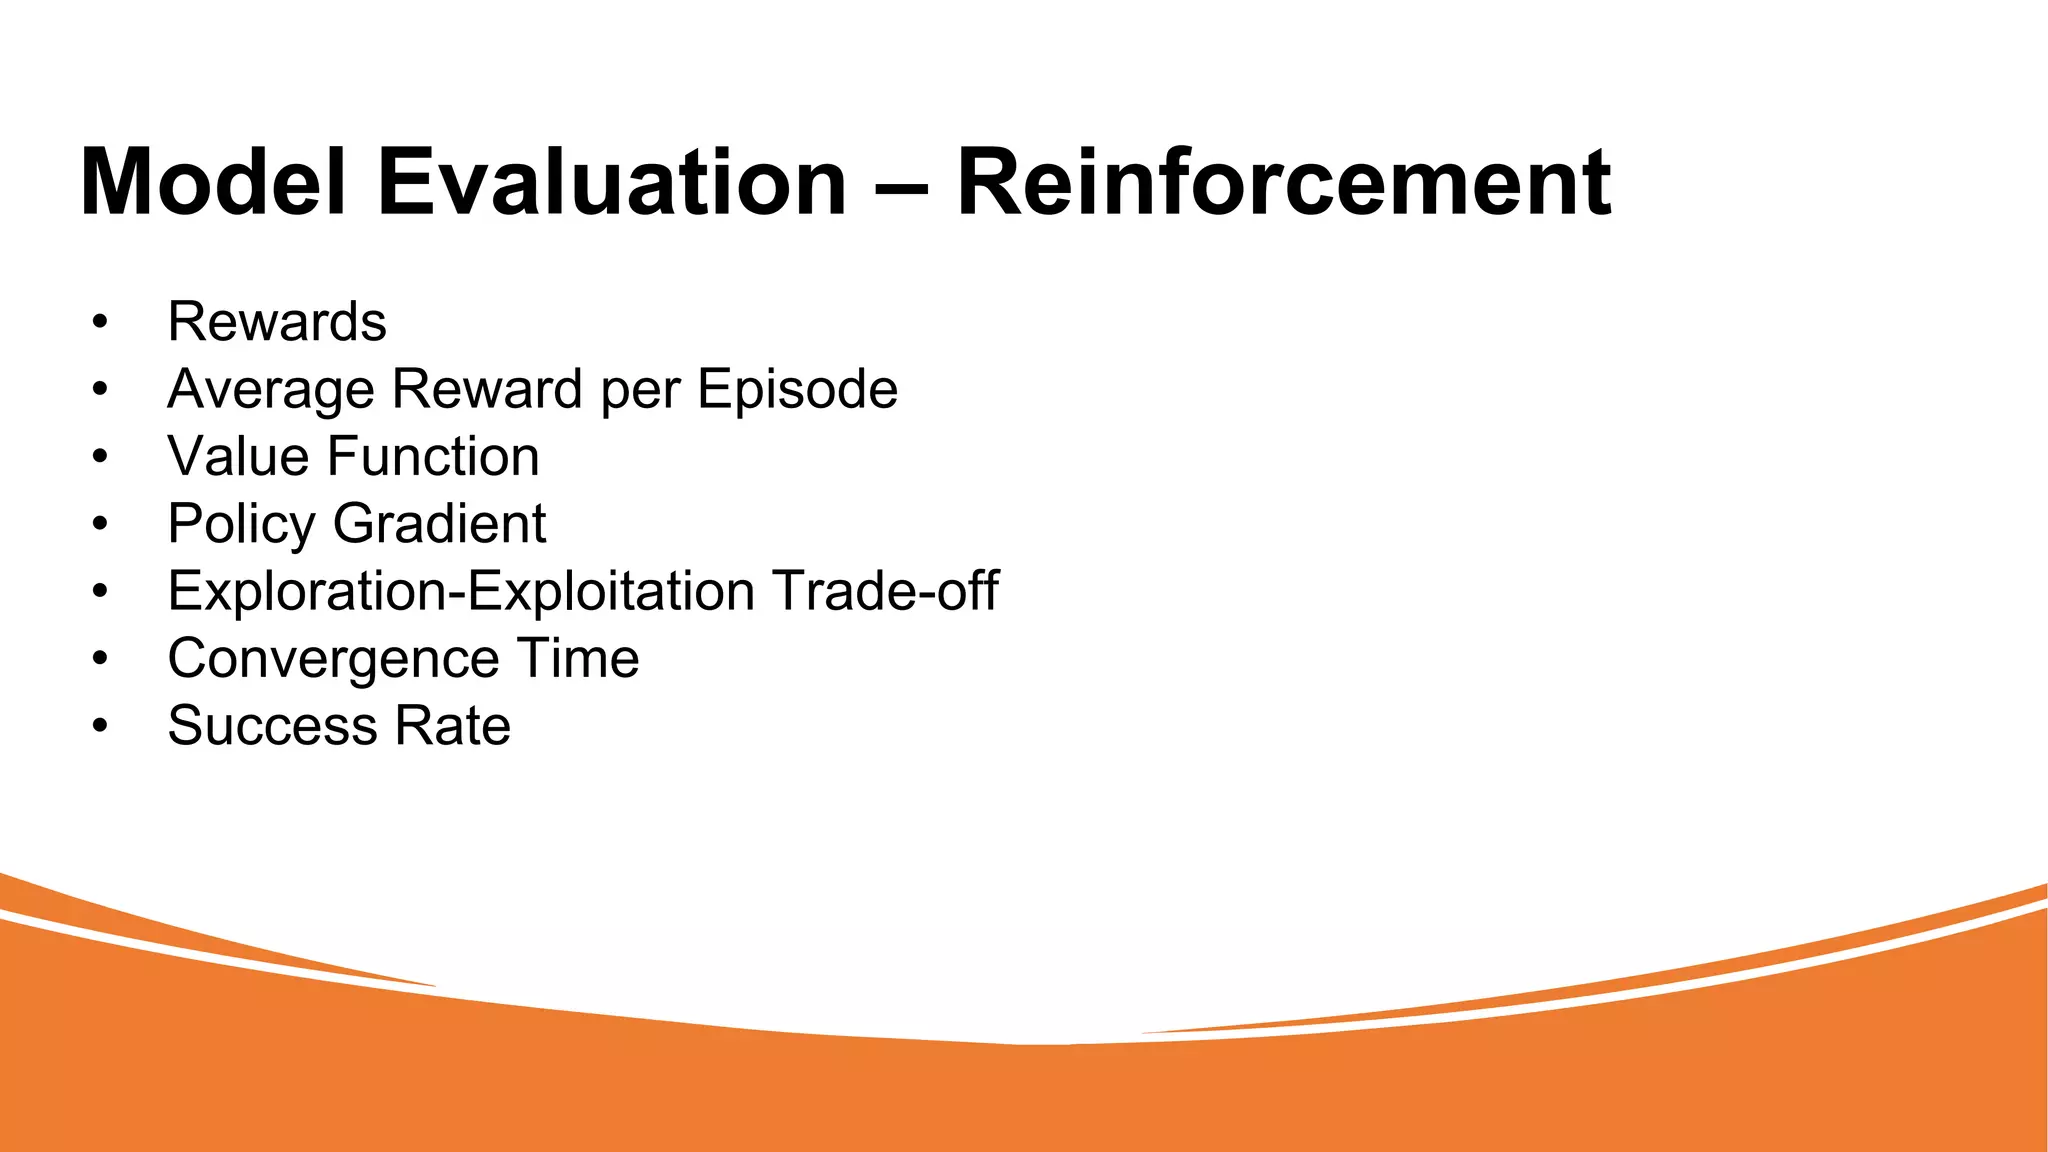
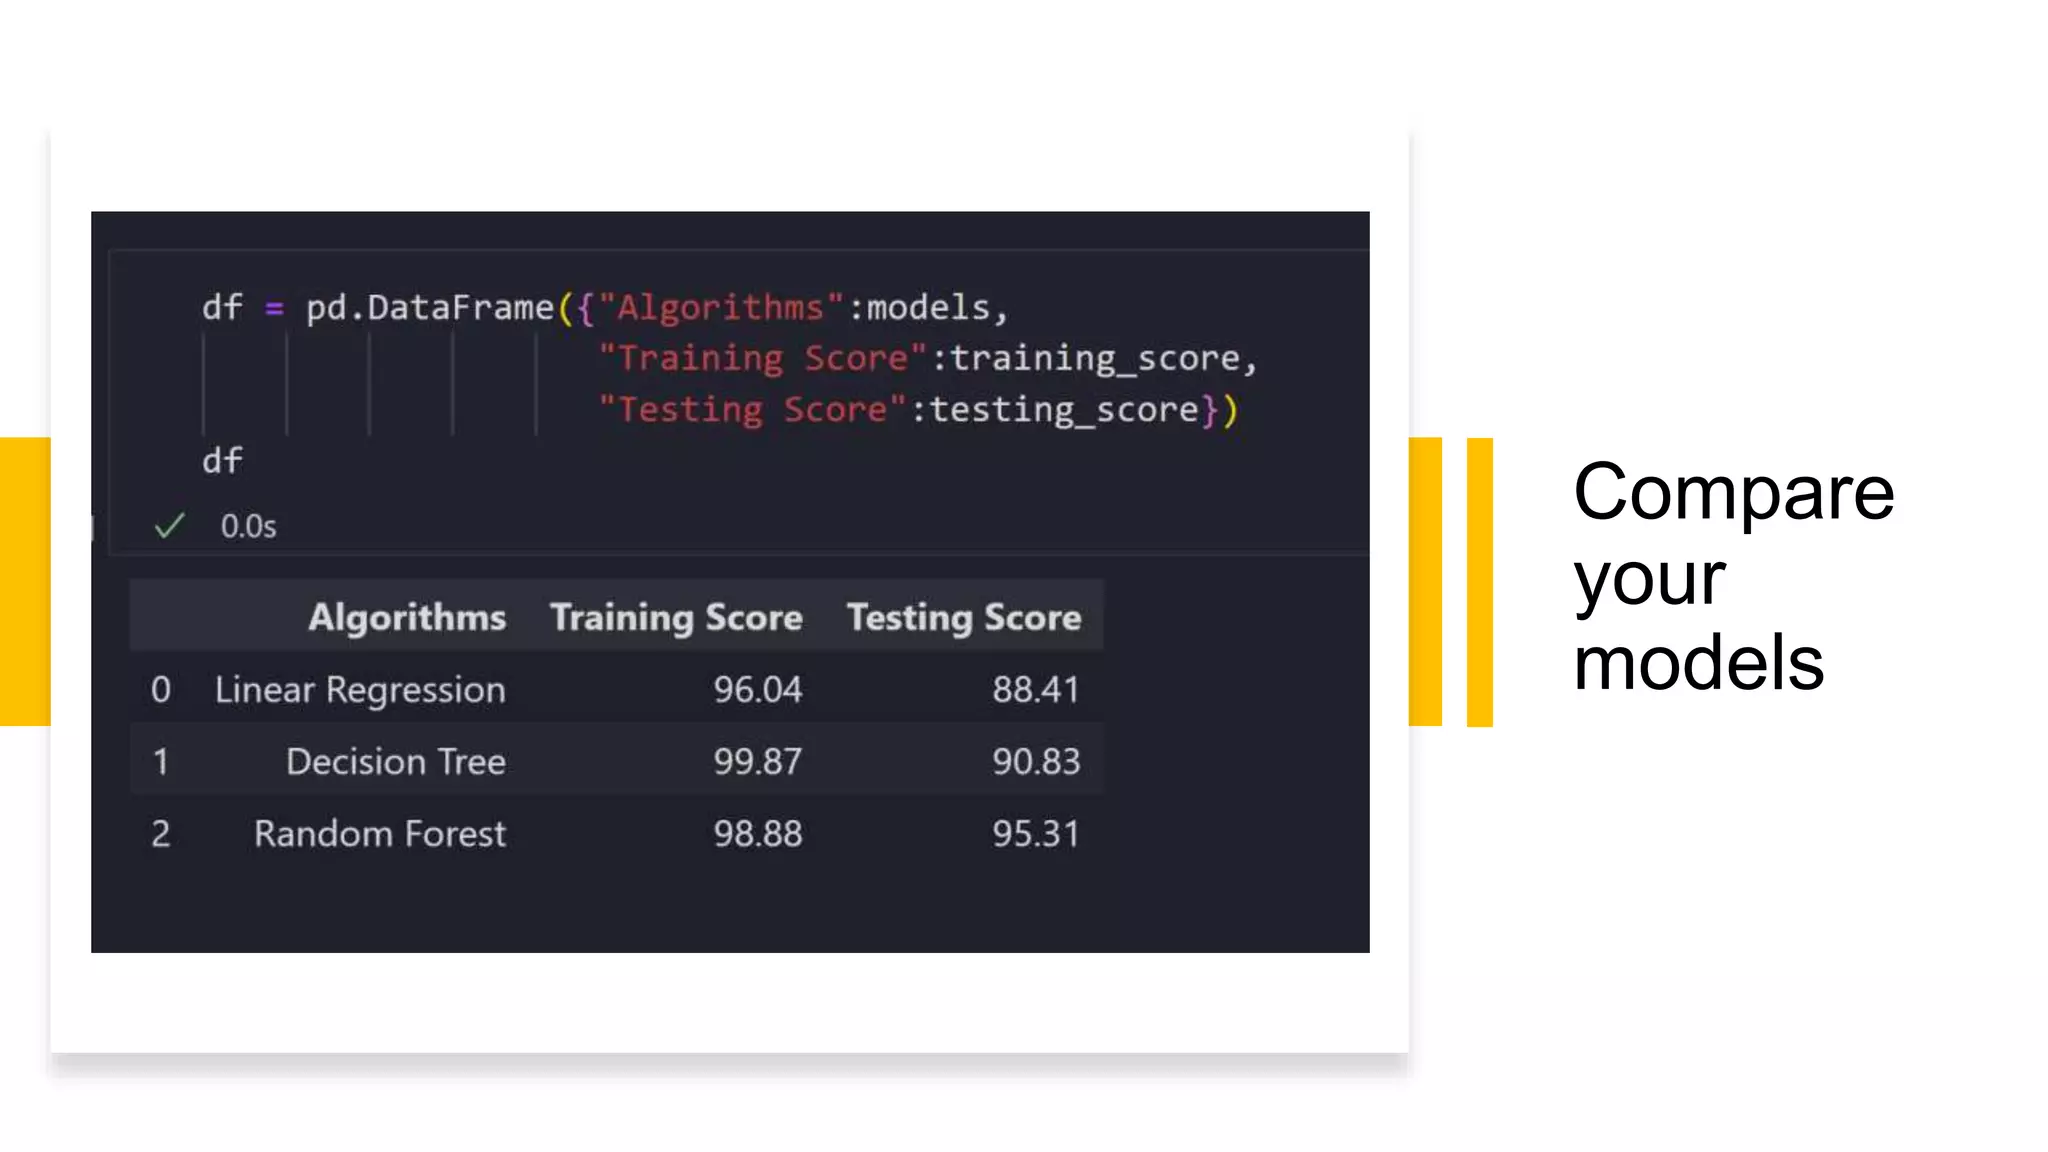
Data Science in a Day -
Workshop
Karthikeyan VK
Cloud Native Architect & Microsoft MVP
Basics
Data Cleaning
Exploratory Data Analysis(EDA)
Feature Selection and Engineering
Data Pre-Processing
Model Selection/Training/Evaluation
Deployment
Basics of Data
Types of Data
• Quantitative
• Qualitative
Attributes
Attribute is a property or characteristic of an
object that may vary, either from one object
to another or form one time another
Eg:- Temperature of an object varies over
time
Properties of Attributes
Distinctness
= and ≠
Order <,
>,≤,≥
Addition +
and –
Multiplication
* and /
Types of Attributes
Nominal Ordinal Interval Ratio
Types of
Attributes
WORKSHOP -
PREREQUISITES
Prerequisites – Readme.md
https://bit.ly/predtemplate
Prerequisites
Open Visual Studio Code and make sure the code is cloned.
Load Car
price Dataset
Check
Car price
Dataset
Check Car price Dataset
Check Car
price Dataset
Data Cleaning
Data Quality
Accuracy
Completeness
Consistencies
Interpretability
Clean up Car Name
Spelling
Mistake -
Car
Name
Exploratory Data
Analysis(EDA)
Exploratory Data Analysis
Visualization Insights for data Identify any patterns,
trends, or relationships.
Analysis
Visualize Cars vs Price
Insights
•
Jaguar & Buick seems to have the highest price range cars.
• Car companies like Nissan, Renault & Mercury are having only one
to two datapoints.
• So we can't make any inference related to lowest price range car
companies.
Note:
Since there are too many categories in car compnay feature. So we
can derive a new feature Company Price Range which will show the price
range as Low Range, Medium Range, High Range.
Feature
Engineering
Feature Engineering
Dimensionality reduction
Discretization and Binarization
Normalization or Standardization
Dimensionality Reduction
Feature Selection
Filter - Variance
Wrapper - Greedy approach
Embedded - L1 regularization(add bias)
Feature Extraction
Discretization and
binarization
Discretization
Unsupervised
Equal-Width
Equal-Frequency
K-Means
Supervised
Decision Trees
Binarization
Global
Thresholding
Local
Thresholding
Optimization
based
binarization
Check for mean to bin the data
Binning the Data
Data Pre-
Processing
Data Pre-processing
Scaling
Encoding
Normalization
Standardization
Normalization or
Standardization
Encoding
Standardization & Normalization
• Decimal Scaling
• Min-Max Normalization
• Z-Score
Normalization(Standariz
zation)
Standardization or Normalization when features of the
input dataset have anomalies or simply when they are
measured in different units (e.g., pounds, meters, miles,
etc.).
Standardization
• Before Principal Component Analysis
(PCA)
• Before Clustering
• Before K-Nearest Neighbors (KNN)
• Before Support Vector Machine (SVM)
• Before Measuring Variable Importance
in Regression Models
Select only useful features
Categorical to Numerical Transformation(Encoding)
Scaling Numerical data
Fit & Transform to remove the
anomalies
Model
Selection/Training/Evaluation
Model Selection
• Select a ML algorithm
• Selecting the one that performs
best on the problem and data.
• Linear regression, logistic regression,
decision trees, random forests, or
neural networks
Features for Training & Testing
Split the test and train data
Model Training
• Once the algorithm or model has been
selected, the next step is to train the
model on the training data.
• This involves fitting the model to the
data by adjusting the parameters of the
model to minimize the error or
maximize the accuracy.
Predict your car price
Model Evaluation – Regression
• Mean Squared Error (MSE)
• Root Mean Squared Error (RMSE)
• Mean Absolute Error (MAE)
• R-squared (R2)
• Adjusted R-squared
• Mean Absolute Percentage Error (MAPE)
Model Evaluation - Clustering
• Silhouette Coefficient
• Calinski-Harabasz Index
• Davies-Bouldin Index
• Dunn Index
• Rand Index
• Adjusted Rand Index
• Normalized Mutual Information
Model Evaluation - Classification
• Accuracy
• Precision
• Recall
• F1-score
• ROC curve
• AUC
• Confusion matrix
Model Evaluation – Anomaly Detection
• True Positive Rate (TPR)
• False Positive Rate (FPR)
• Precision
• F1-score
• Receiver Operating Characteristic (ROC) curve
• Area Under the ROC Curve (AUC)
• Confusion Matrix
• Precision-Recall (PR) Curve
• Average Precision (AP)
Model Evaluation – Reinforcement
• Rewards
• Average Reward per Episode
• Value Function
• Policy Gradient
• Exploration-Exploitation Trade-off
• Convergence Time
• Success Rate
Compare
your
models
Deployment
My Book
Thank You

DataScience-101