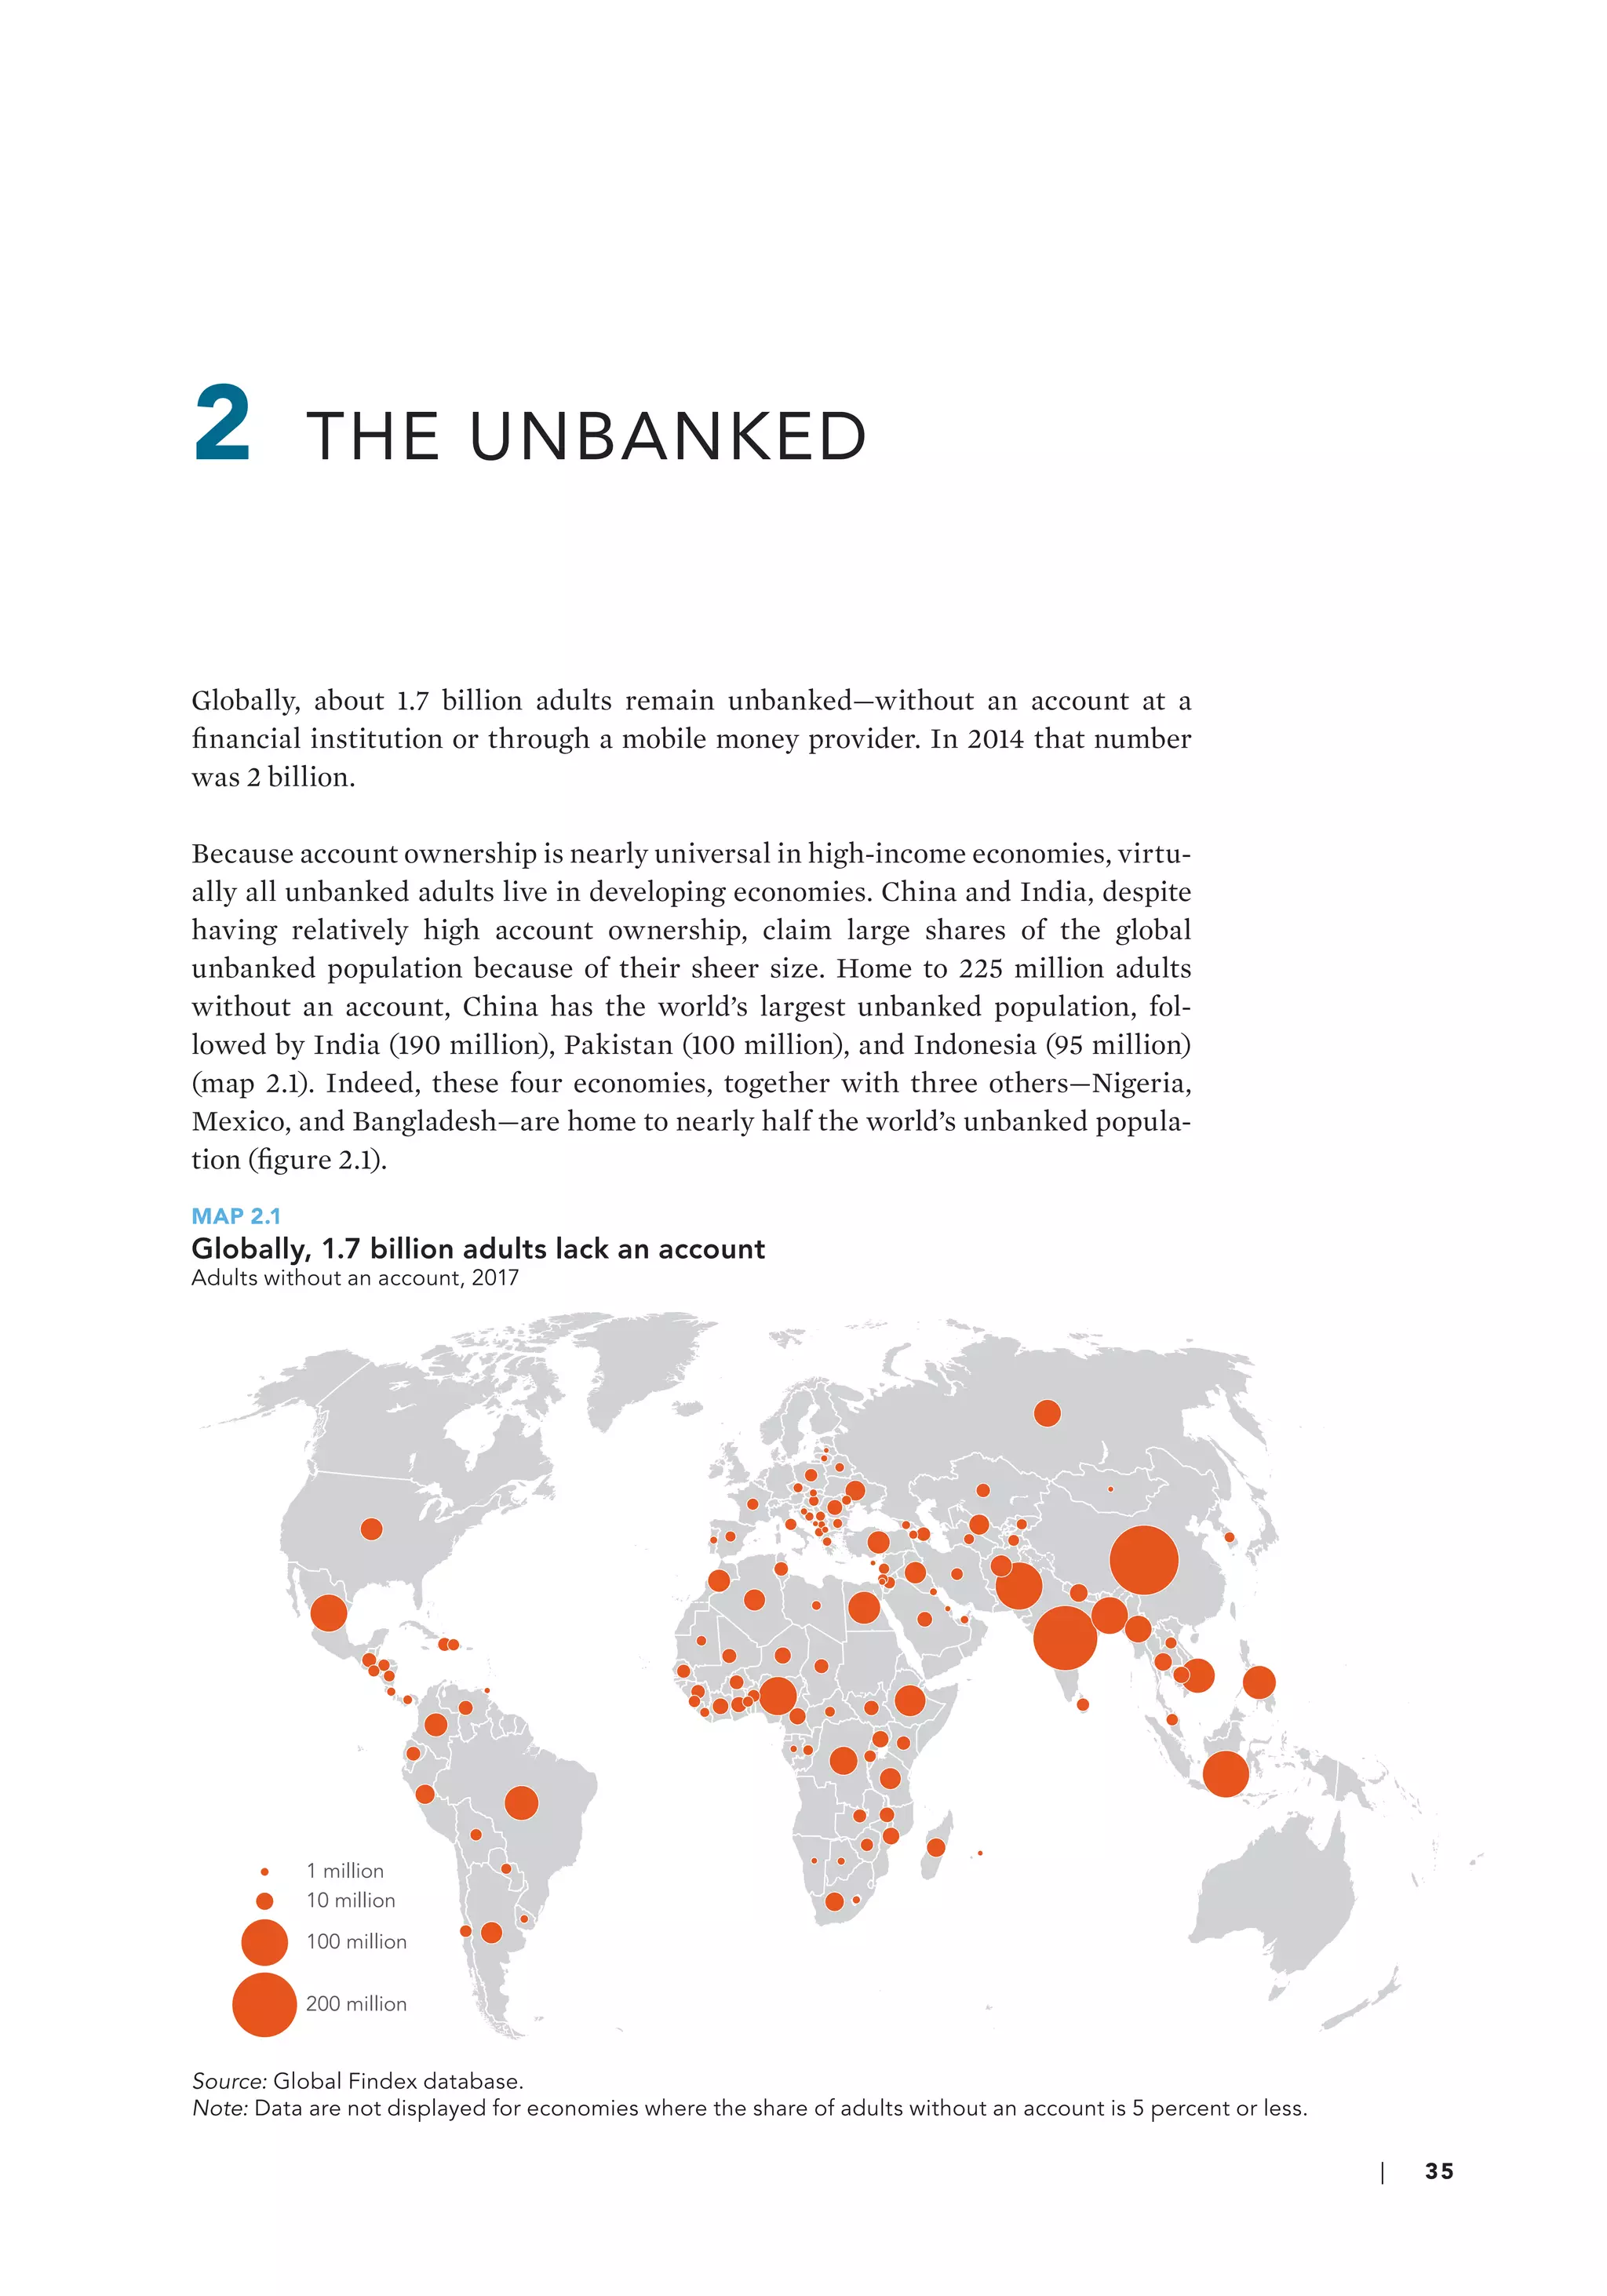
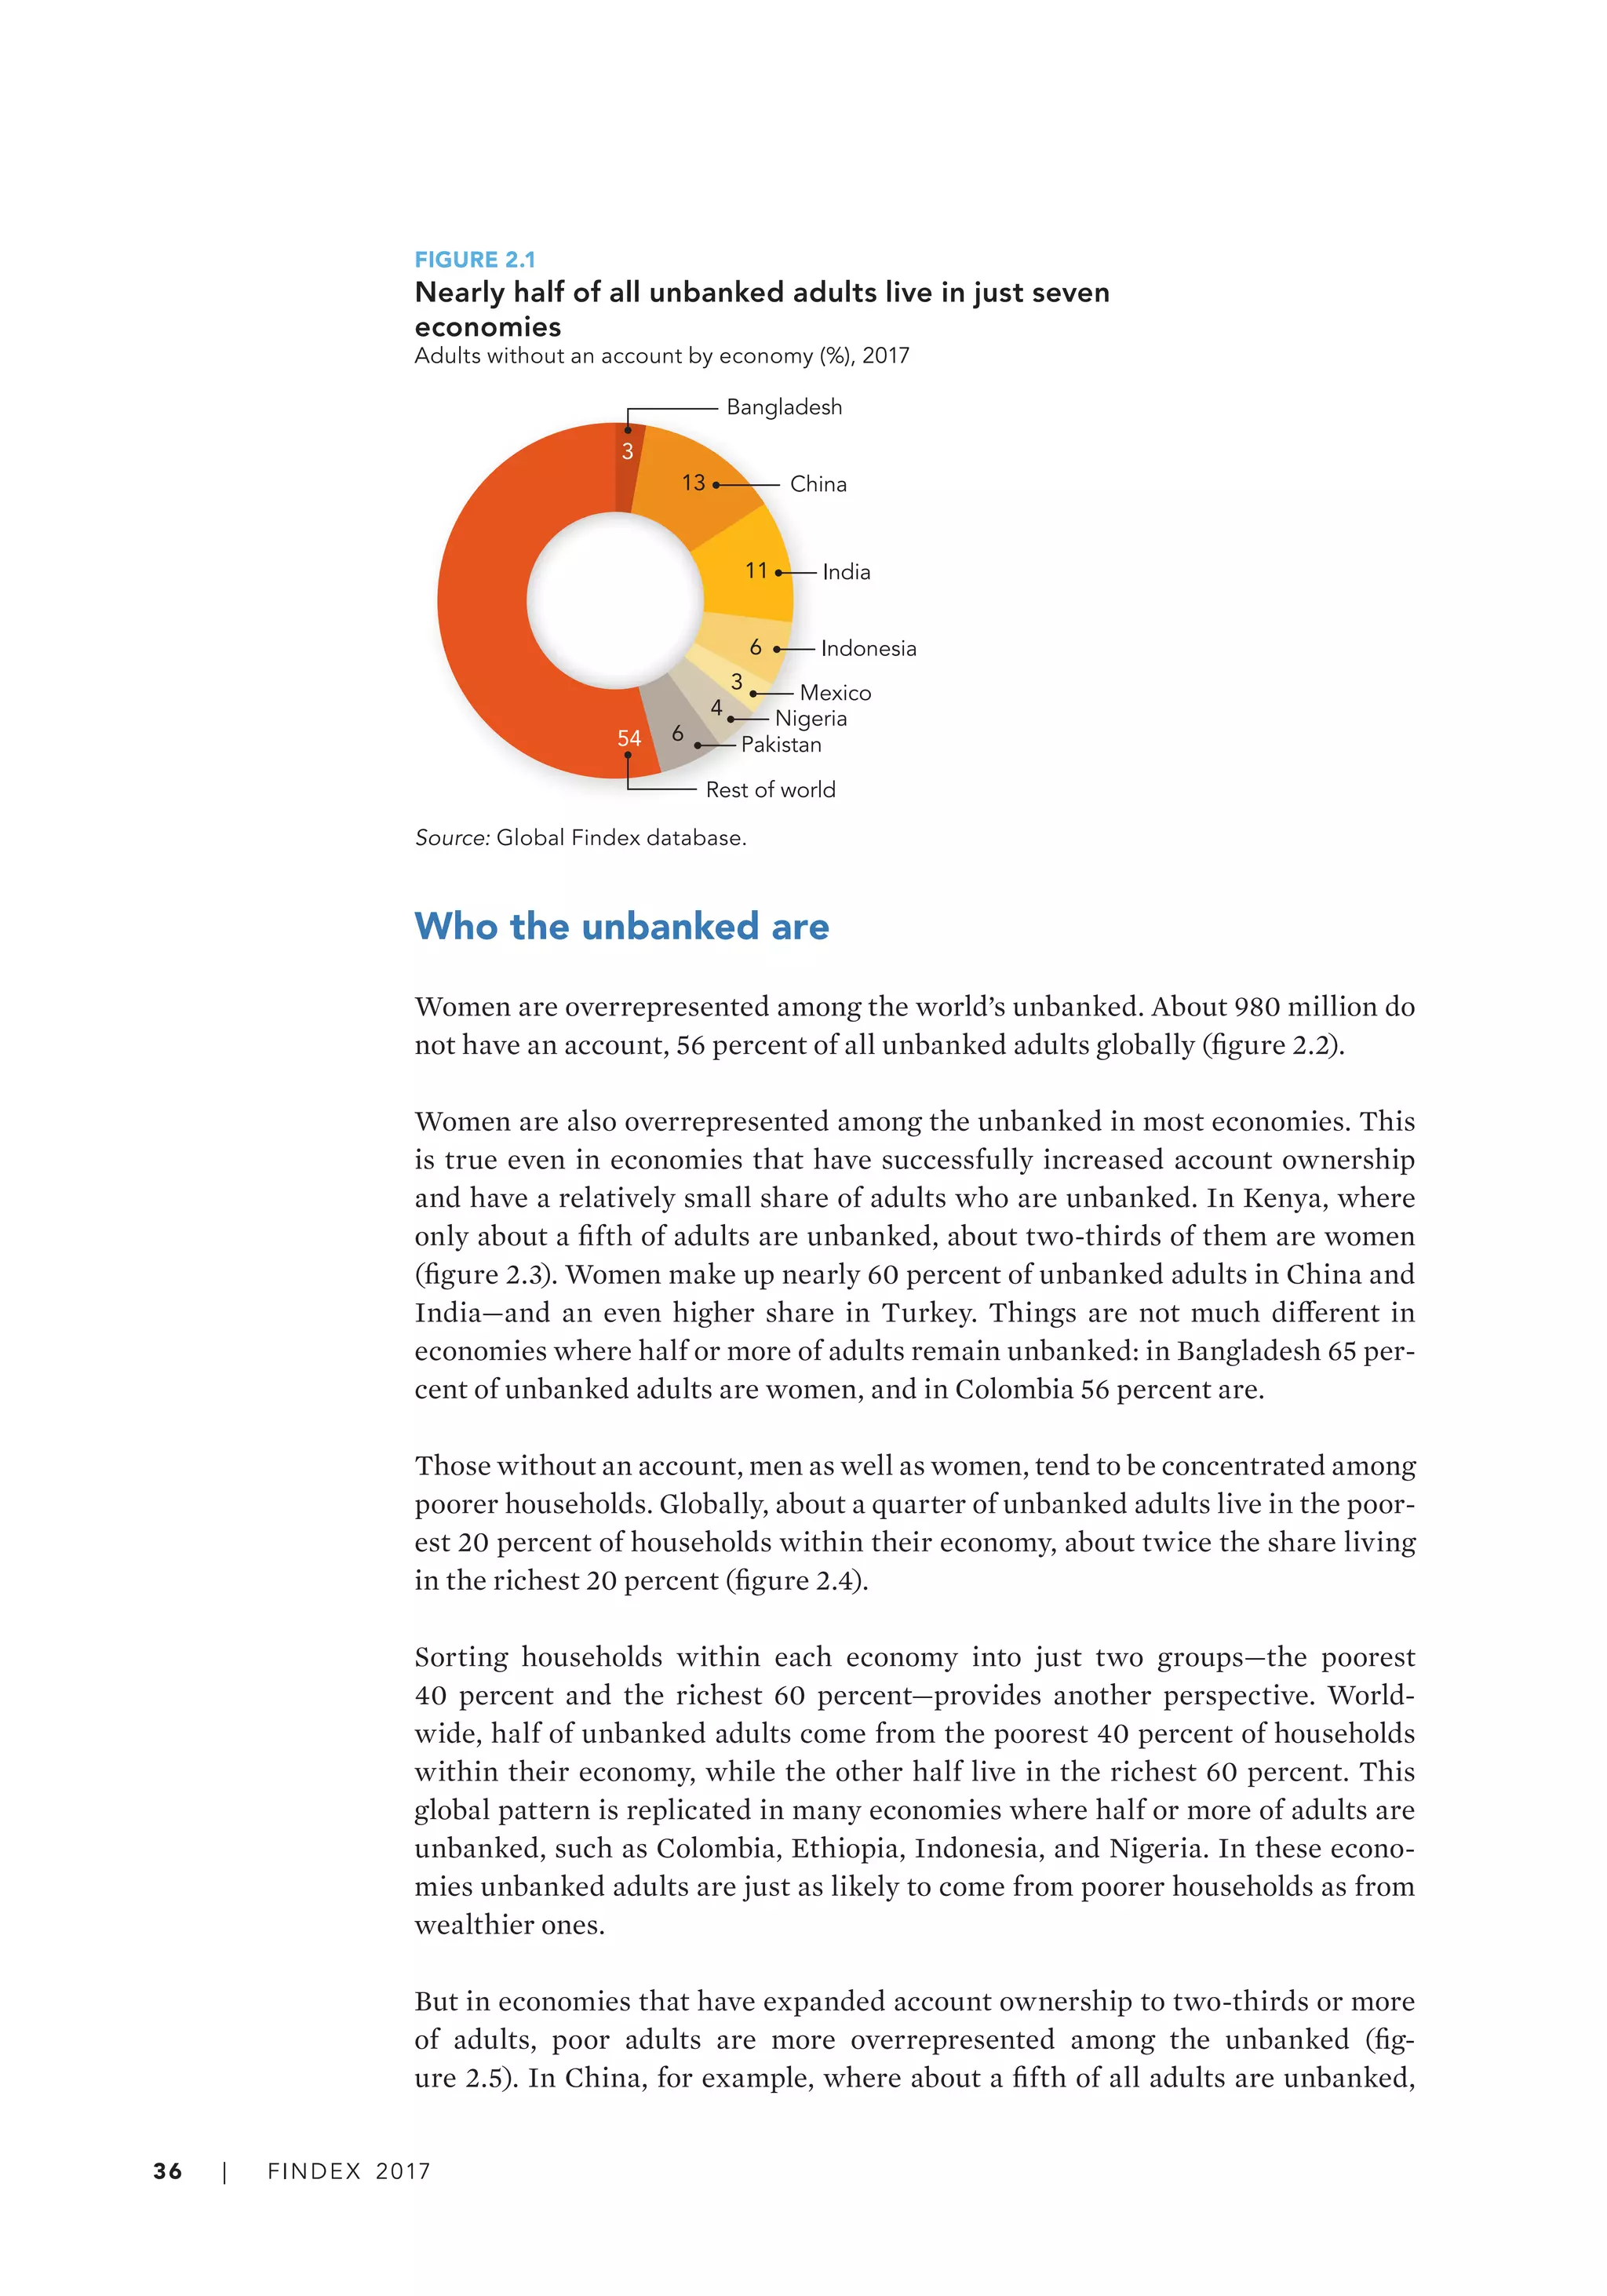
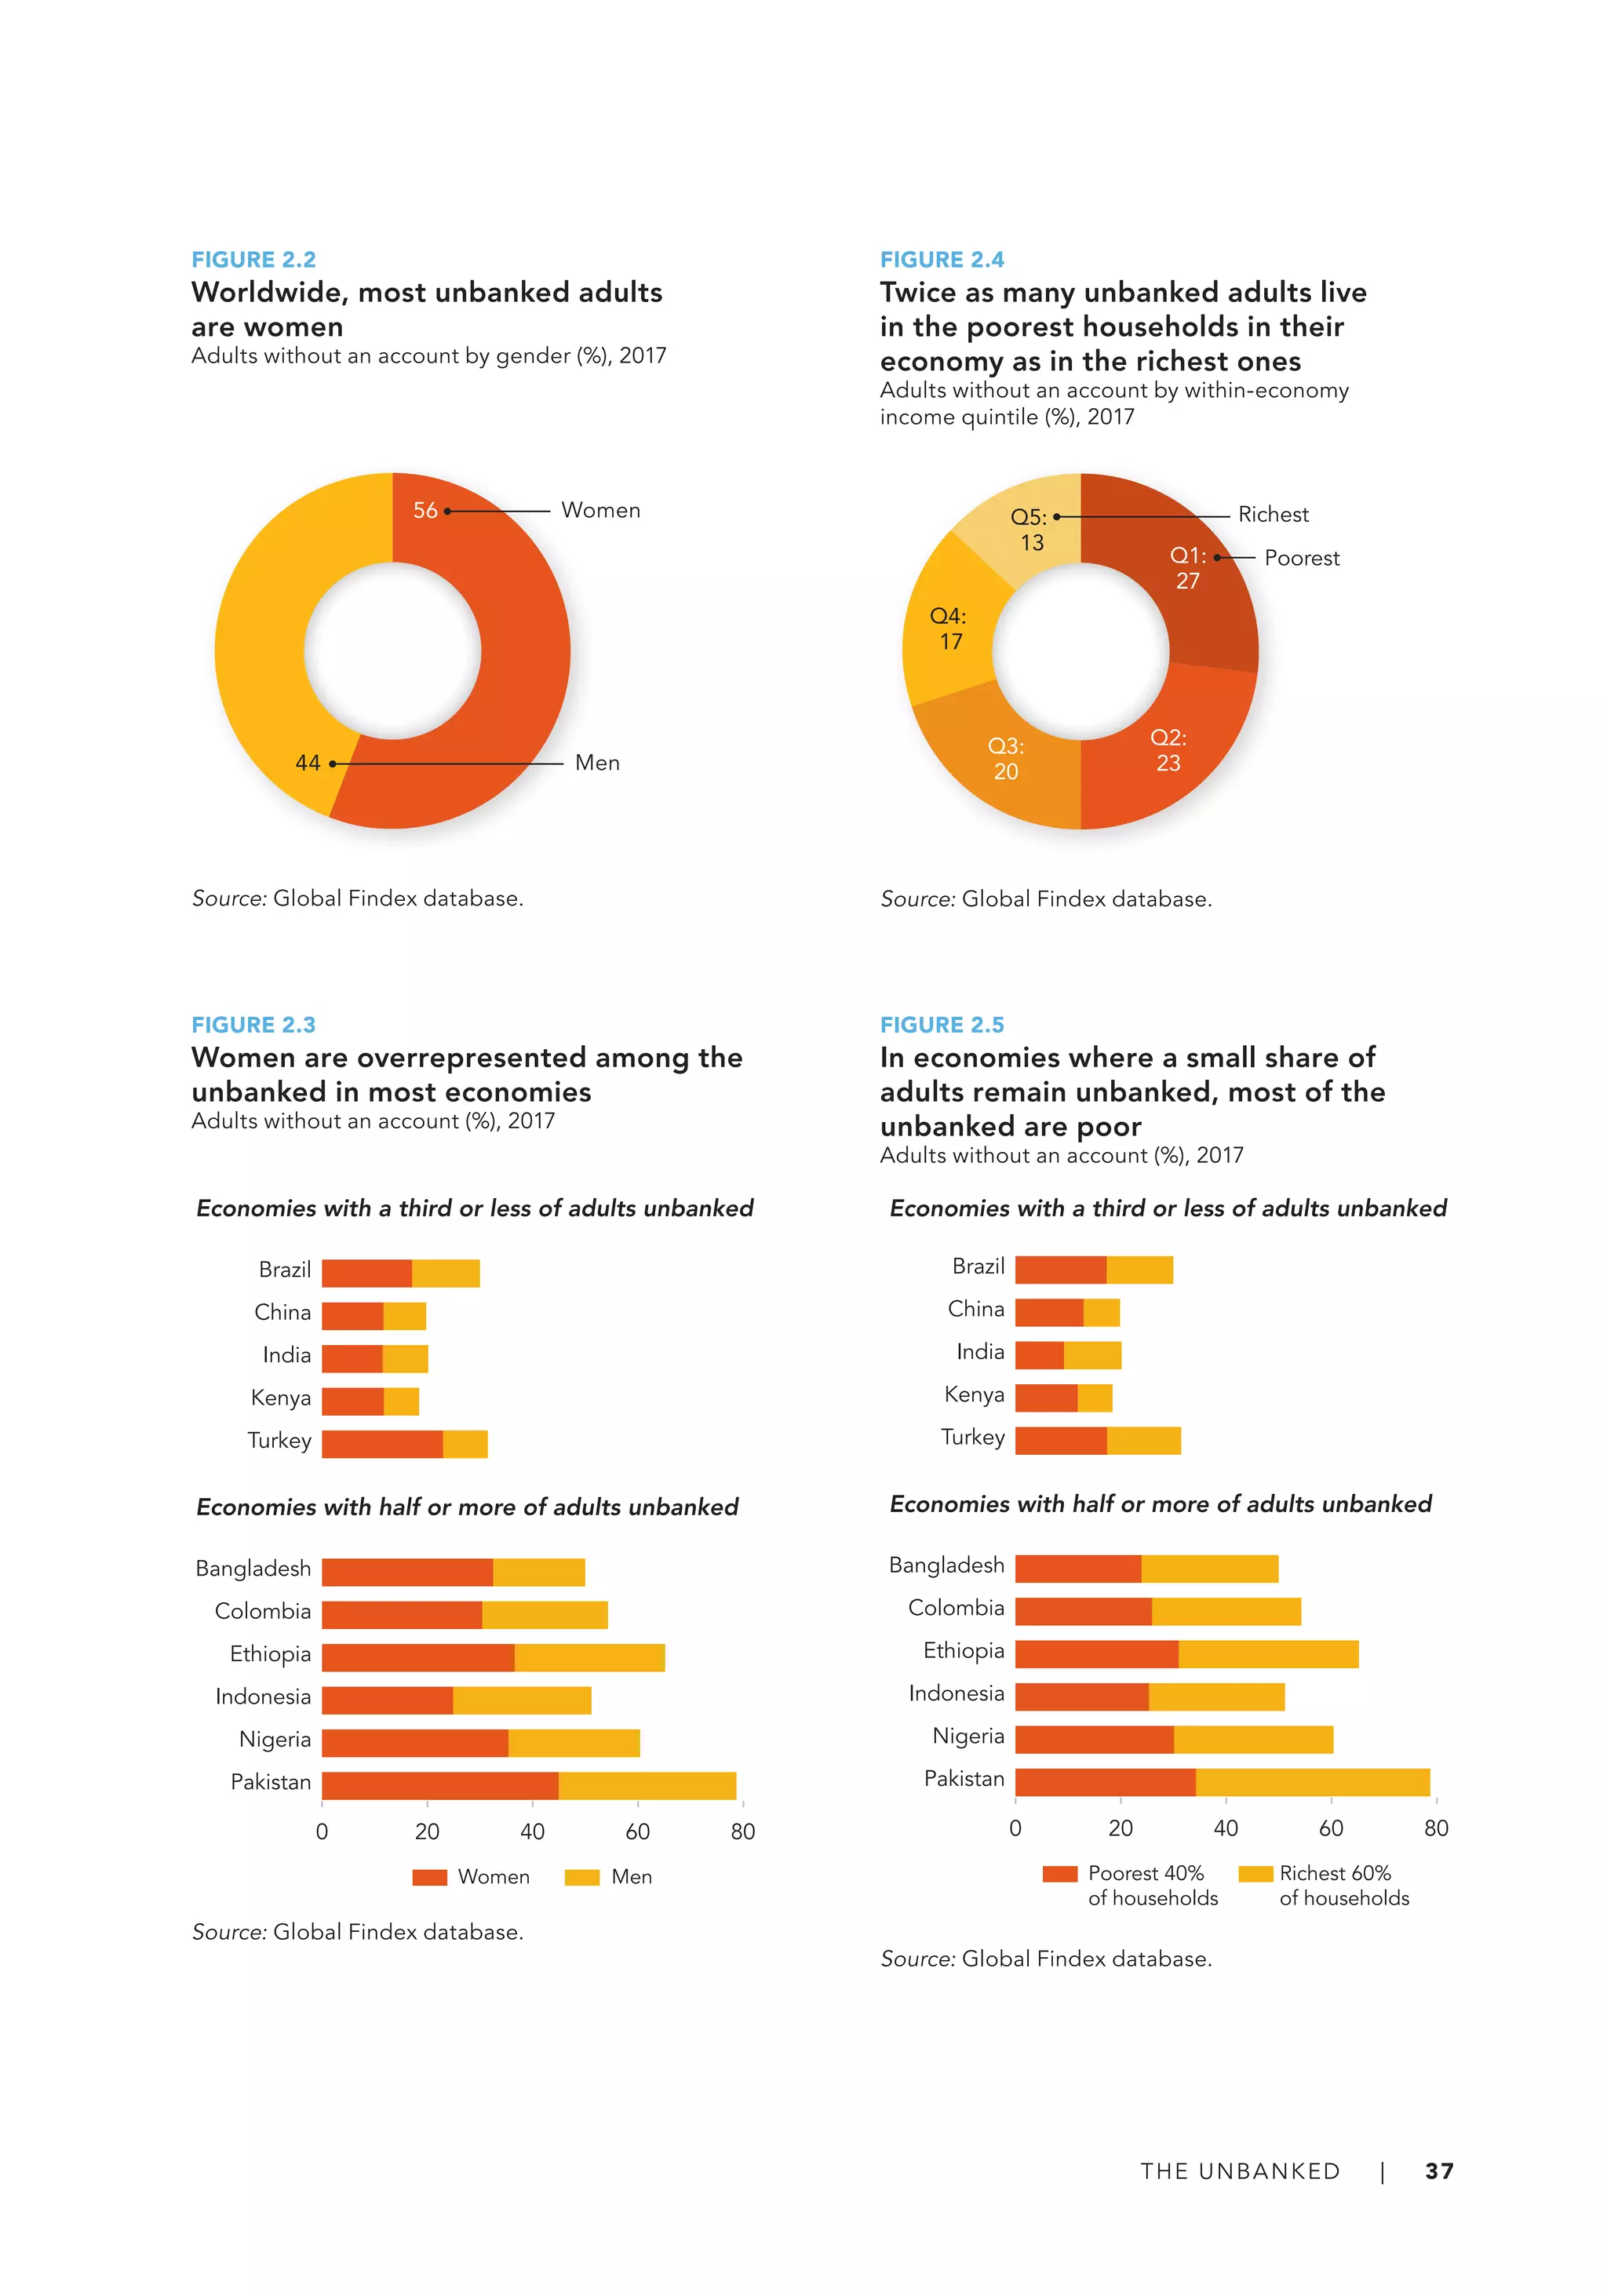
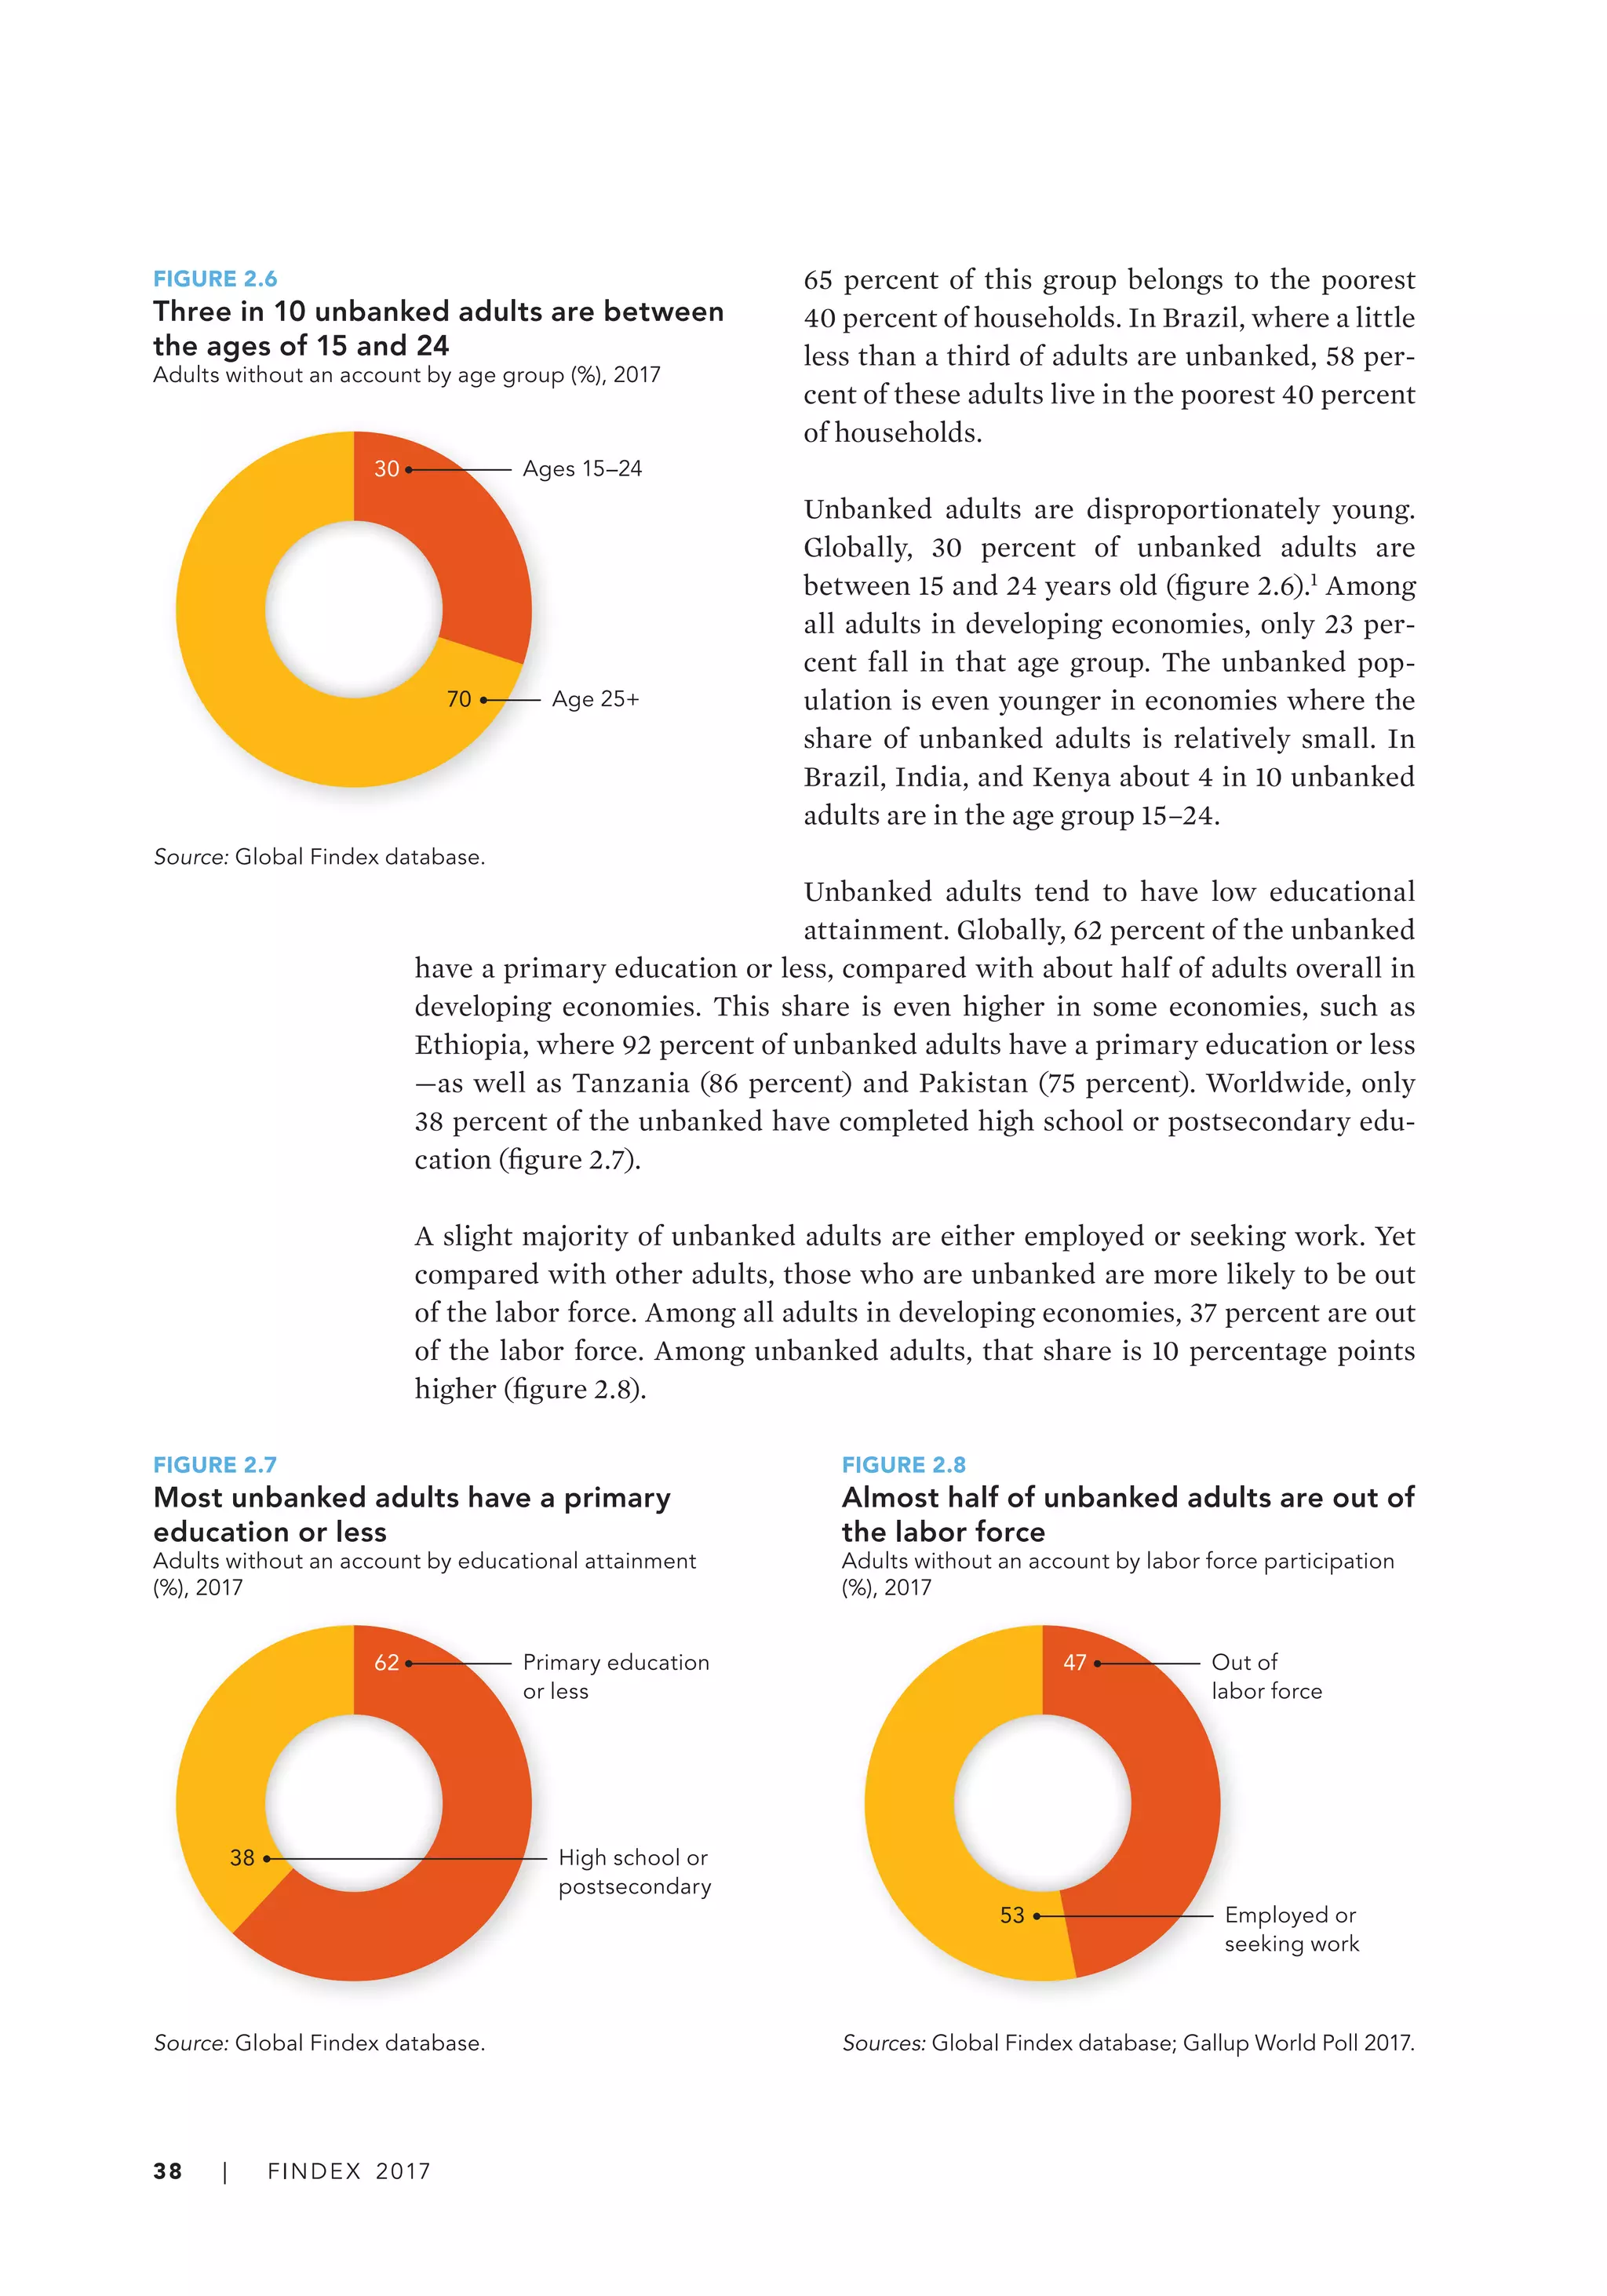
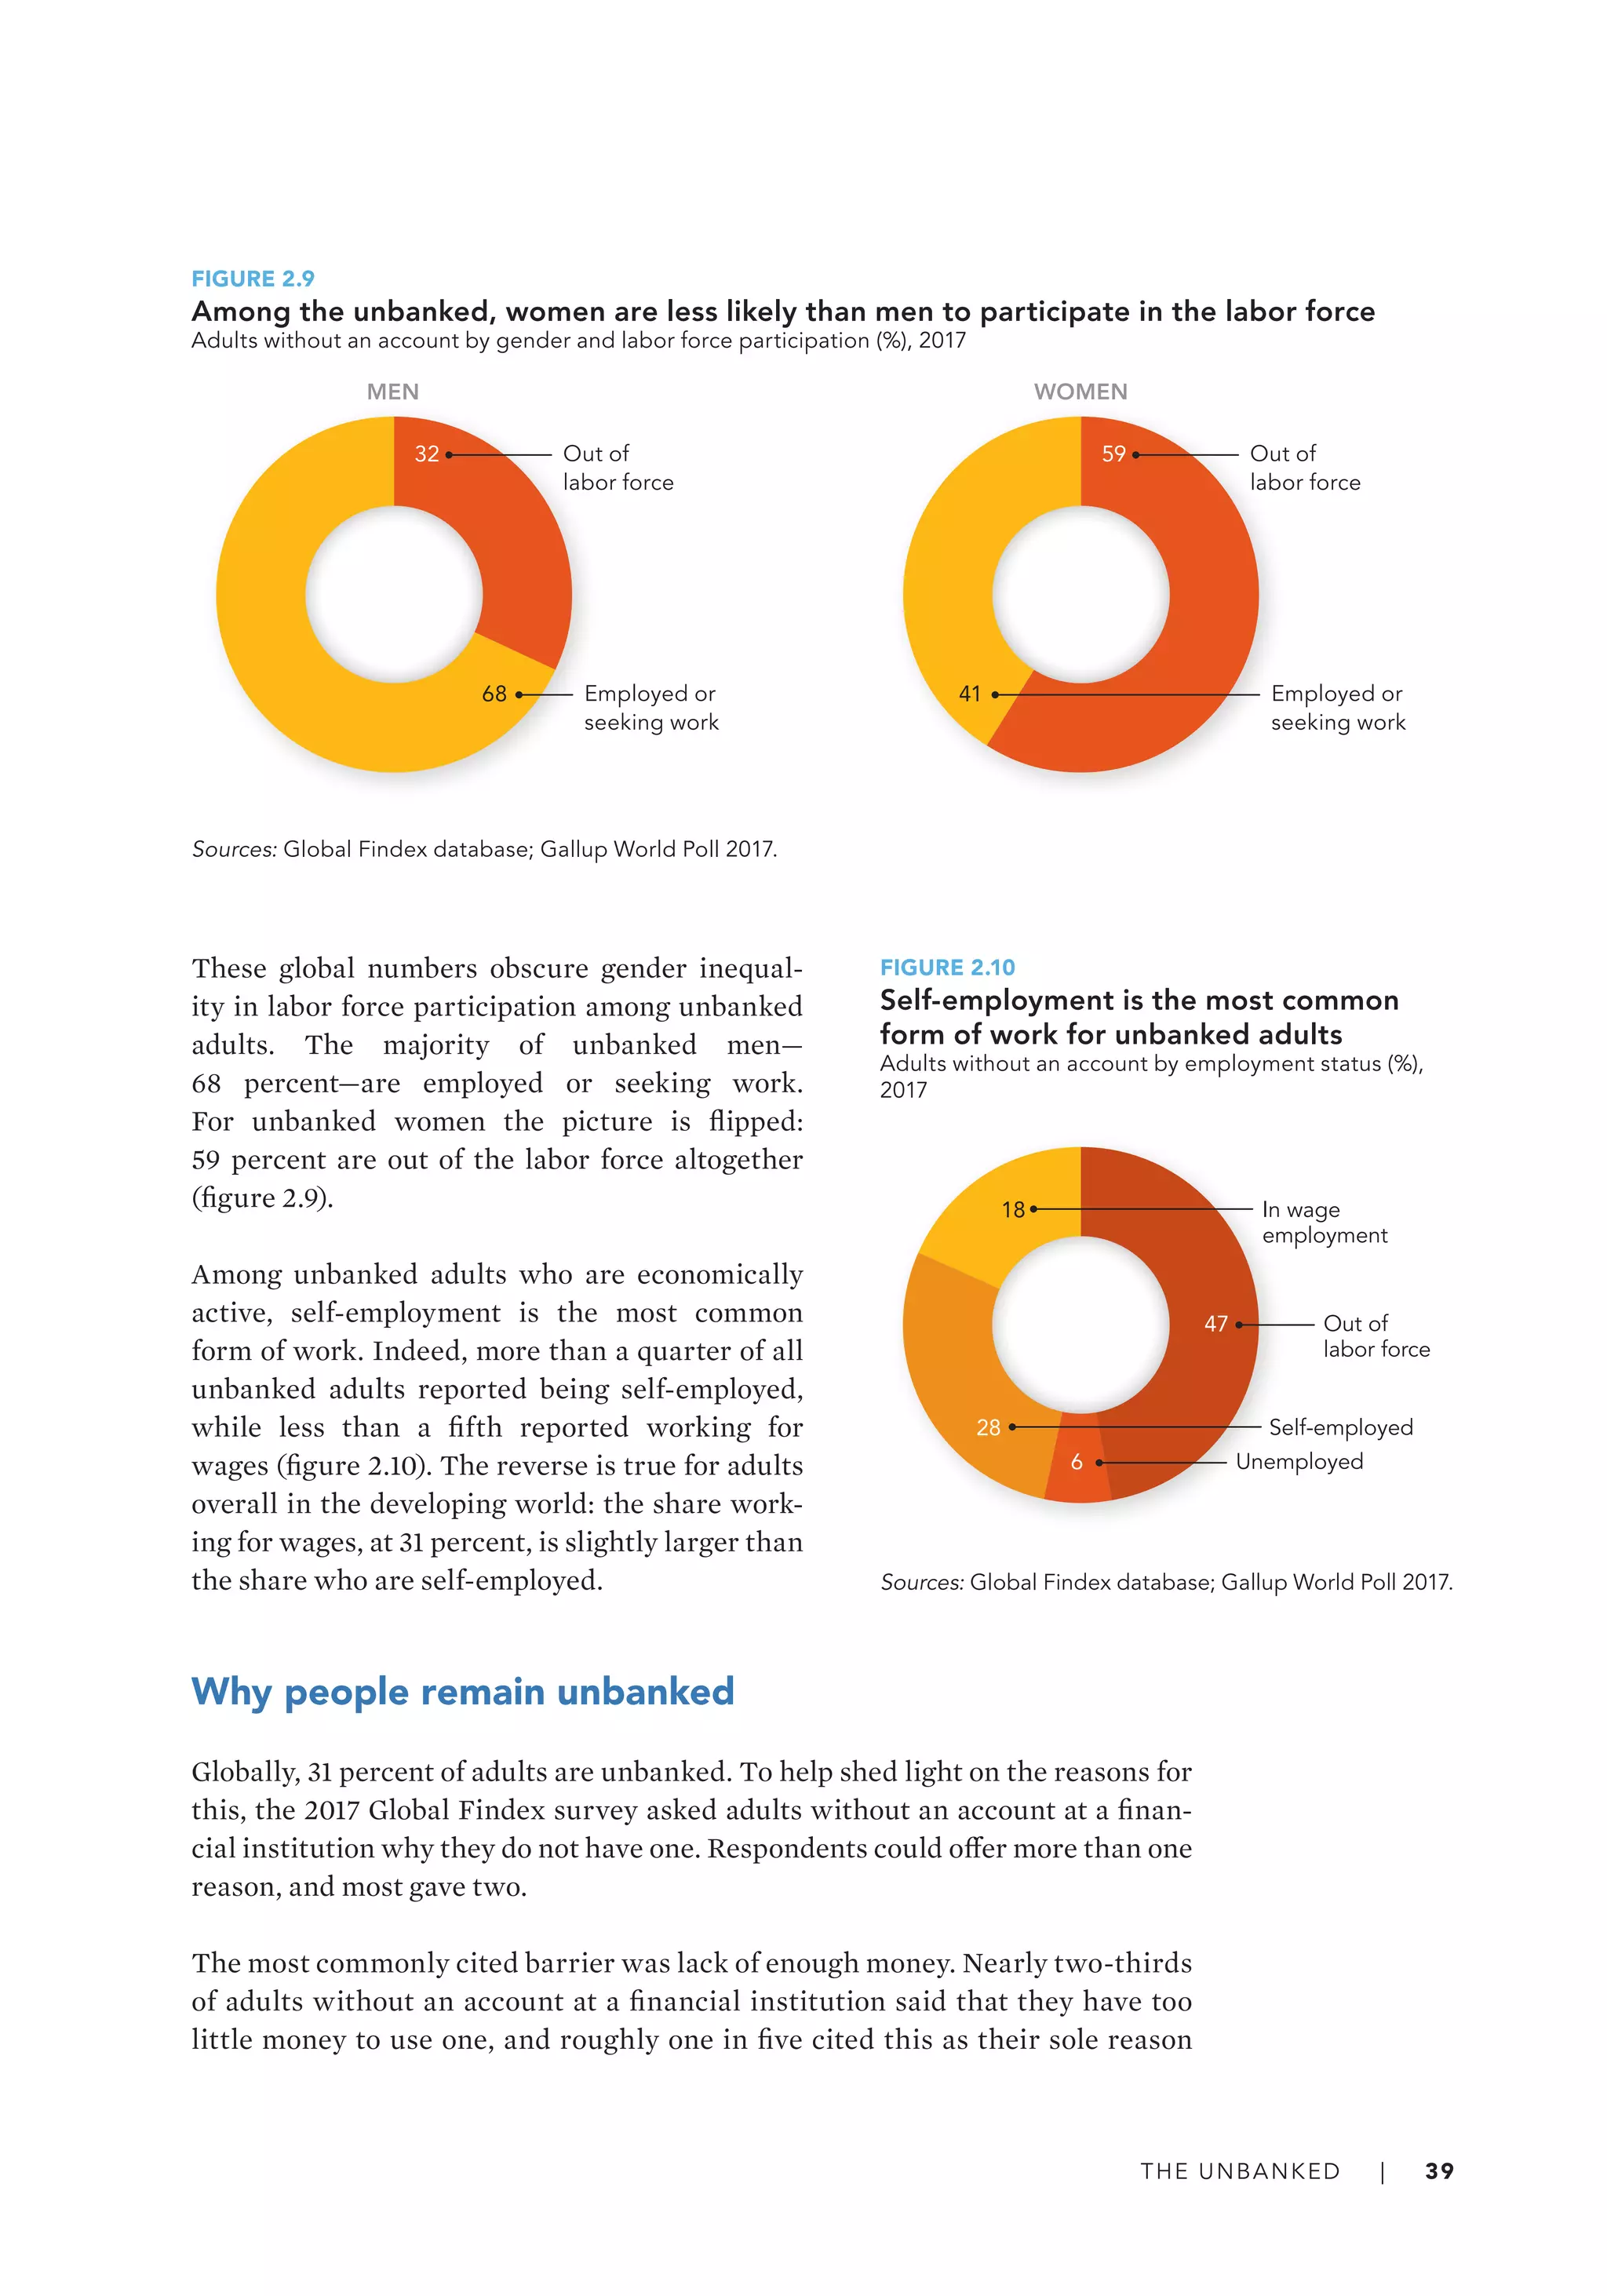
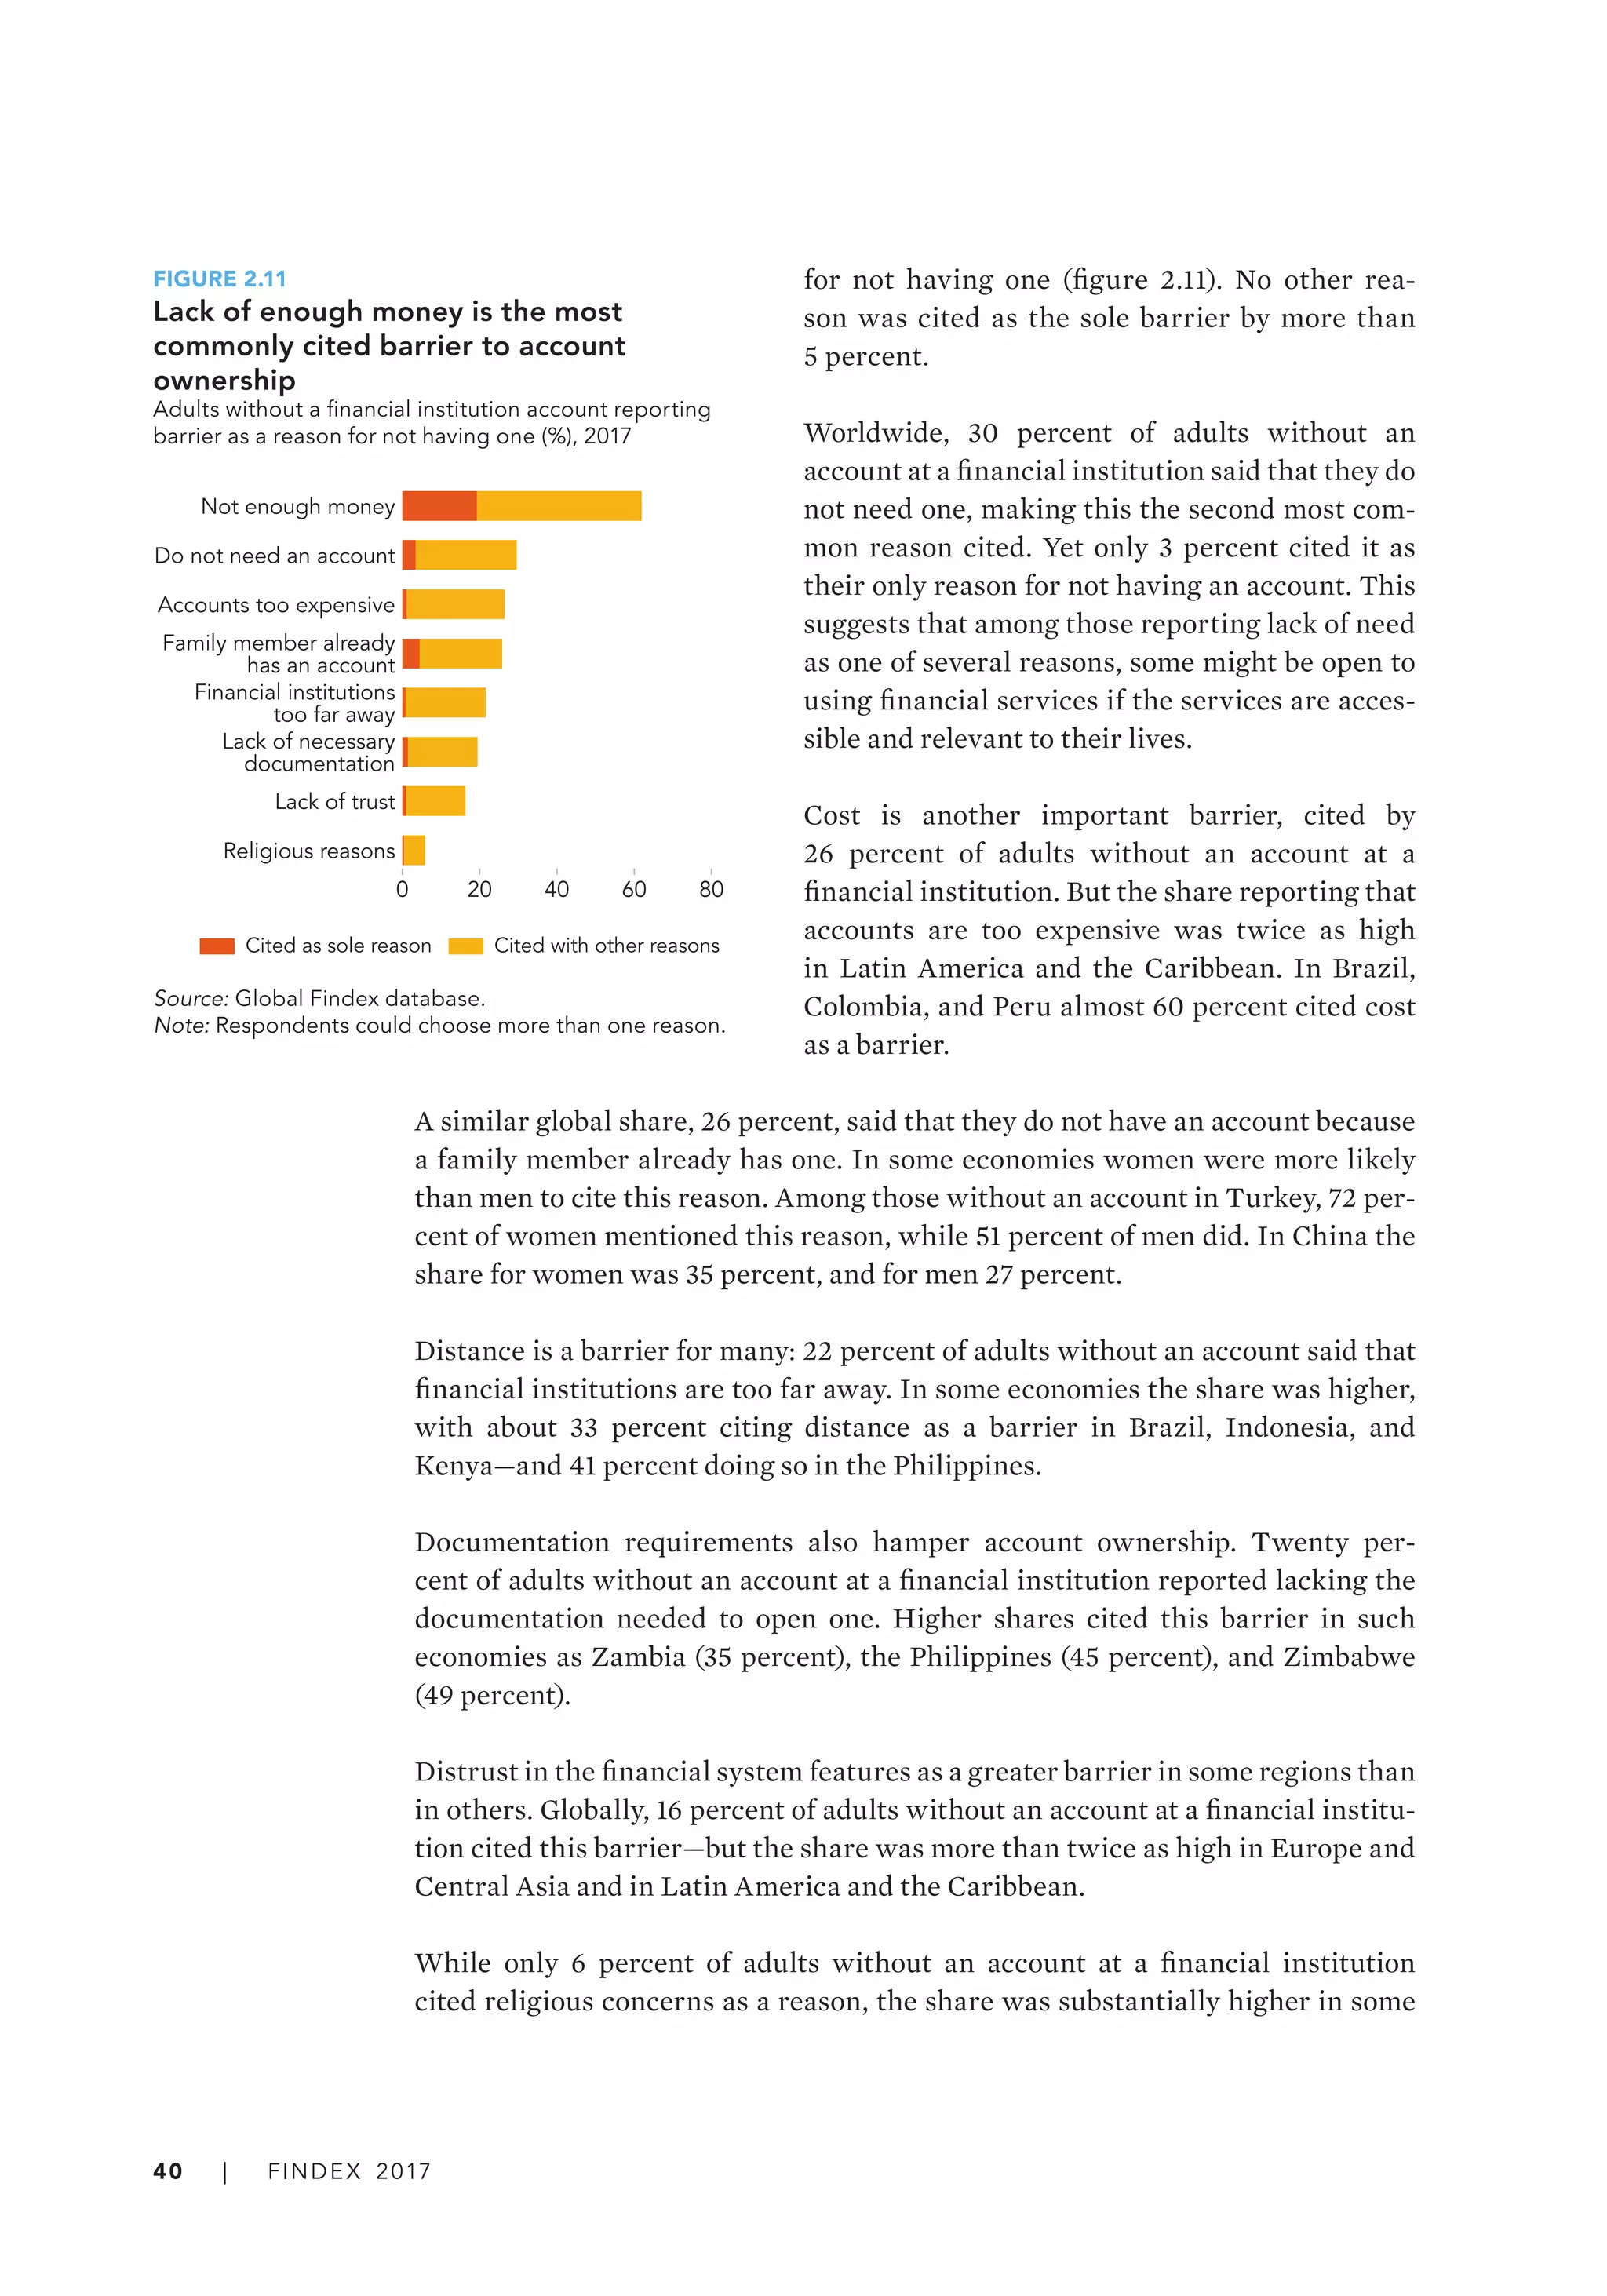
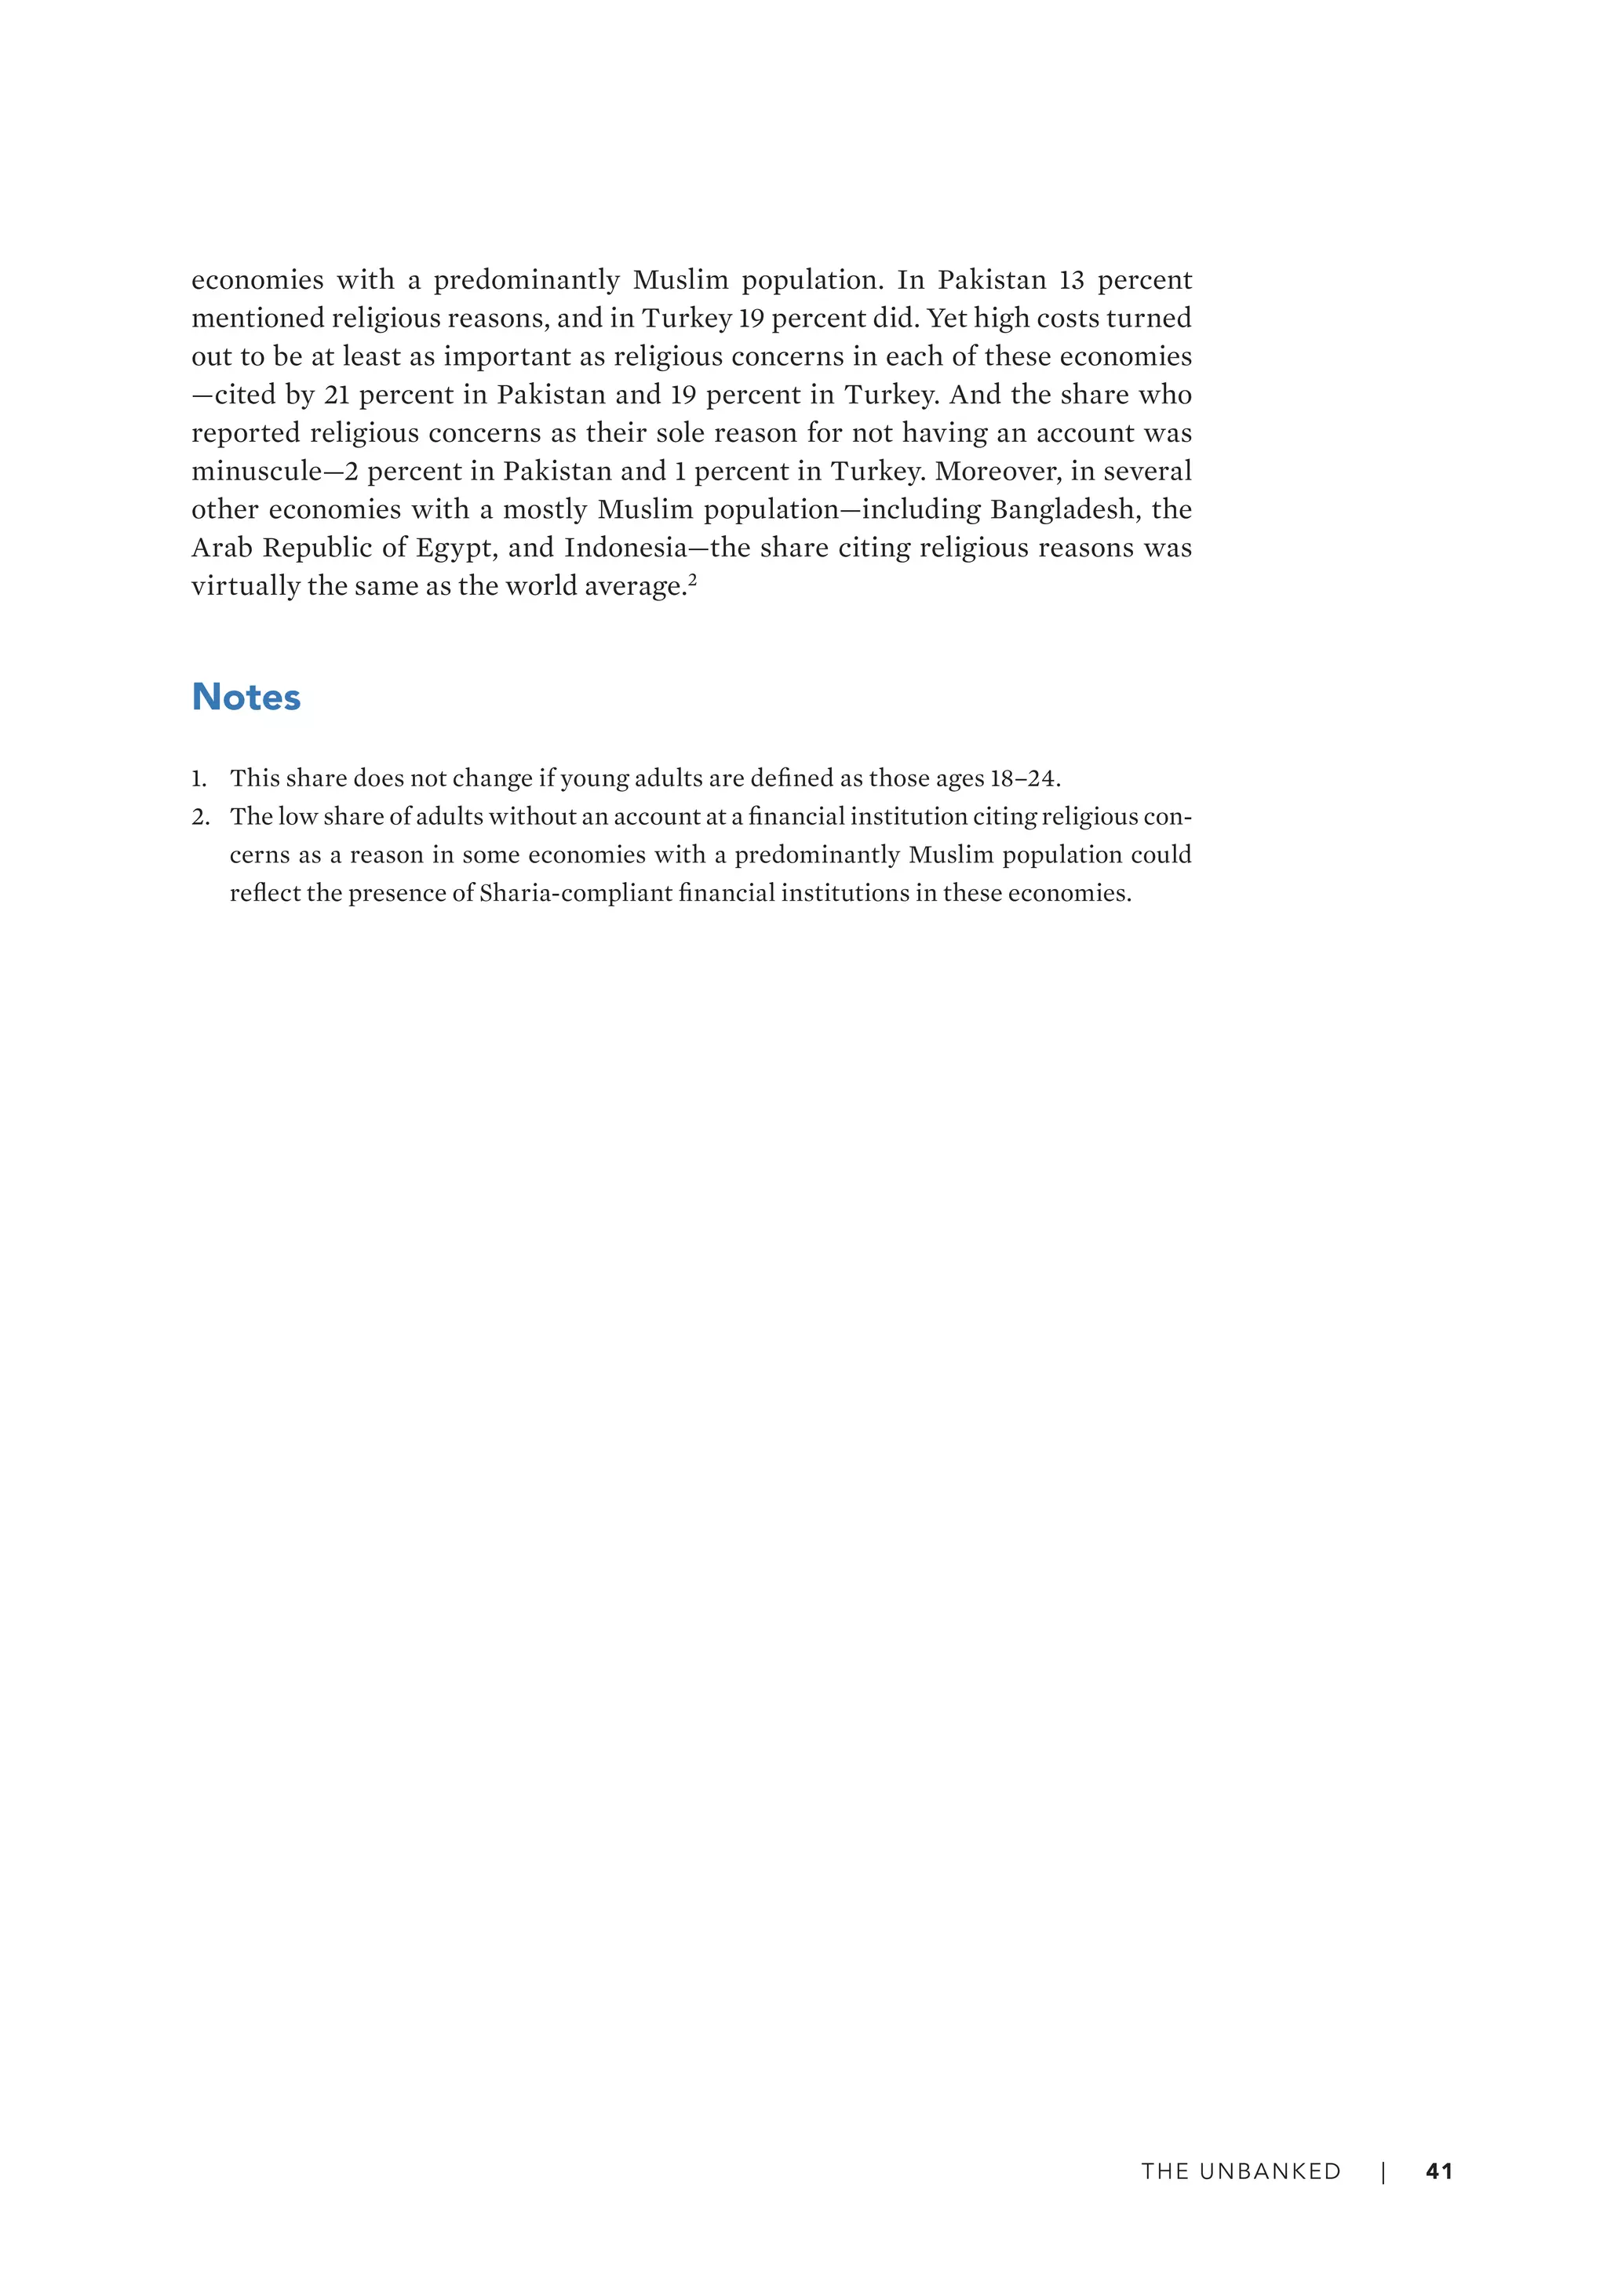
Globally, about 1.7 billion adults remain unbanked without a bank account. Women are overrepresented among the unbanked, comprising 56% of the unbanked population. Those without accounts tend to be poorer, younger, and less educated than average. The most commonly cited barrier to account ownership is lack of enough money, reported by nearly two-thirds of unbanked adults. Distance to financial institutions and documentation requirements also prevent many from opening accounts.
#TimeToCare (India Supplement) | Oxfam IndiaOxfam India
With growing inequality, it has become pertinent to address the ever-growing gap between the rich and the poor. Over the last decade, academics, policymakers and multilateral institutions have been striving to draw attention to the growing importance of the subject of shared prosperity. https://www.oxfamindia.org/workingpaper/timetocare-india-supplement
Datos de La población mundial 2018. (Population Reference Bureau) 2018 world-...Juan Martín Martín
Datos de la Población Mundial en 2018 (en inglés). Datos de todos los países del Mundo. gráficos, pirámides de población, natalidad, mortalidad, fecundidad, esperanza de vida, maternidad, envejecimiento, previsiones mundiales, etc.
Multivariate Analysis of Head Count Per Capita Poverty Rate across the 36 Sta...ijtsrd
In this work, we examine that the poverty rate is being influenced by the rate of corruption, conflict and unemployment rate using data obtained from the National Bureau of Statistics 2003 04, 2009 10 and 2019. Using SPSS 23, the results show that corruption, conflict and unemployment rates are statistically significant with an F Statistics value of 1.706 0.185 critical value .Hence, both significantly influence the rate of poverty in Nigeria. The Coefficient Output Summary difference of the variables suggest a model which is fitted as where is poverty rate and the variations in the rate of corruption, conflict and unemployment. The results also show that the poverty rate in Nigeria increases with increases inthe level of corruption, conflict and unemployment rate across the 36 States in Nigeria. Owan, Raphael Asu | Dr. Willie, Clement Etti | Asu Isaac Asu "Multivariate Analysis of Head Count Per Capita Poverty Rate across the 36 States in Nigeria" Published in International Journal of Trend in Scientific Research and Development (ijtsrd), ISSN: 2456-6470, Volume-5 | Issue-6 , October 2021, URL: https://www.ijtsrd.com/papers/ijtsrd46460.pdf Paper URL : https://www.ijtsrd.com/humanities-and-the-arts/other/46460/multivariate-analysis-of-head-count-per-capita-poverty-rate-across-the-36-states-in-nigeria/owan-raphael-asu
It gives a complete idea of various ways to reduce the gap between the rich and poor people in India and finding the ways of such an inequality in income
Malcolm Potts Crisis in the Sahel: Where Population and Climate Change Are Co...LIDC
rofessor Malcolm Potts, renowned in the field of public health, gave a one-off keynote lecture for LIDC. The lecture, at the London School of Hygiene and Tropical Medicine, focused on the emerging humanitarian disaster in the Sahel. It has been central to the work of his team for several years.
An overview of poverty levels within ethnic communities in the US. Governmental attempts at a baseline. Five types of capital formation within a capitalist infrastructure as pathways out. This is the basis of the video at https://vimeo.com/vivgrigg/uspoverty
Datos de la población mundial 2015. (Population Reference Bureau) 2015 worl...Juan Martín Martín
Datos de la Población Mundial en 2015. Datos de todos los países del Mundo. gráficos, pirámides de población, natalidad, mortalidad, fecundidad, esperanza de vida, maternidad, envejecimiento, previsiones mundiales, etc.
Legal statement on cryptoassets and smart contract uk jurisdiction taskforceRein Mahatma
The Legal Statement has been prepared by Lawrence Akka QC, David Quest QC, Matthew
Lavy and Sam Goodman, all of whom are experts in this field. It is not my role as a judge,
nor that of the UKJT or its parent, the UK’s LawTech Delivery Panel, to endorse the contents
of the Legal Statement. Instead, the UKJT has promoted several rounds of public and
private consultation so as to ensure that the drafting team were considering the right legal
questions, and had the benefit of the most respected expert, technical, legal, judicial and
academic opinion.
The objective of the Legal Statement is to provide the best possible answers to the critical
legal questions under English law. I am sure that it will demonstrate the ability of the
common law in general, and English law in particular, to respond consistently and flexibly
to new commercial mechanisms
According to the blueprint, 140 government service applications are already on the blockchain. These applications are divided into three categories: "data sharing and exchange", "business collaborative processing" and "electronic certificate and certificate storage". The official in charge of the blueprint said:
Bridging the Digital Gap Brad Spiegel Macon, GA Initiative.pptxBrad Spiegel Macon GA
Brad Spiegel Macon GA’s journey exemplifies the profound impact that one individual can have on their community. Through his unwavering dedication to digital inclusion, he’s not only bridging the gap in Macon but also setting an example for others to follow.
APNIC Foundation, presented by Ellisha Heppner at the PNG DNS Forum 2024APNIC
Ellisha Heppner, Grant Management Lead, presented an update on APNIC Foundation to the PNG DNS Forum held from 6 to 10 May, 2024 in Port Moresby, Papua New Guinea.
Italy Agriculture Equipment Market Outlook to 2027harveenkaur52
Agriculture and Animal Care
Ken Research has an expertise in Agriculture and Animal Care sector and offer vast collection of information related to all major aspects such as Agriculture equipment, Crop Protection, Seed, Agriculture Chemical, Fertilizers, Protected Cultivators, Palm Oil, Hybrid Seed, Animal Feed additives and many more.
Our continuous study and findings in agriculture sector provide better insights to companies dealing with related product and services, government and agriculture associations, researchers and students to well understand the present and expected scenario.
Our Animal care category provides solutions on Animal Healthcare and related products and services, including, animal feed additives, vaccination
Meet up Milano 14 _ Axpo Italia_ Migration from Mule3 (On-prem) to.pdfFlorence Consulting
Quattordicesimo Meetup di Milano, tenutosi a Milano il 23 Maggio 2024 dalle ore 17:00 alle ore 18:30 in presenza e da remoto.
Abbiamo parlato di come Axpo Italia S.p.A. ha ridotto il technical debt migrando le proprie APIs da Mule 3.9 a Mule 4.4 passando anche da on-premises a CloudHub 1.0.
Understanding User Behavior with Google Analytics.pdfSEO Article Boost
Unlocking the full potential of Google Analytics is crucial for understanding and optimizing your website’s performance. This guide dives deep into the essential aspects of Google Analytics, from analyzing traffic sources to understanding user demographics and tracking user engagement.
Traffic Sources Analysis:
Discover where your website traffic originates. By examining the Acquisition section, you can identify whether visitors come from organic search, paid campaigns, direct visits, social media, or referral links. This knowledge helps in refining marketing strategies and optimizing resource allocation.
User Demographics Insights:
Gain a comprehensive view of your audience by exploring demographic data in the Audience section. Understand age, gender, and interests to tailor your marketing strategies effectively. Leverage this information to create personalized content and improve user engagement and conversion rates.
Tracking User Engagement:
Learn how to measure user interaction with your site through key metrics like bounce rate, average session duration, and pages per session. Enhance user experience by analyzing engagement metrics and implementing strategies to keep visitors engaged.
Conversion Rate Optimization:
Understand the importance of conversion rates and how to track them using Google Analytics. Set up Goals, analyze conversion funnels, segment your audience, and employ A/B testing to optimize your website for higher conversions. Utilize ecommerce tracking and multi-channel funnels for a detailed view of your sales performance and marketing channel contributions.
Custom Reports and Dashboards:
Create custom reports and dashboards to visualize and interpret data relevant to your business goals. Use advanced filters, segments, and visualization options to gain deeper insights. Incorporate custom dimensions and metrics for tailored data analysis. Integrate external data sources to enrich your analytics and make well-informed decisions.
This guide is designed to help you harness the power of Google Analytics for making data-driven decisions that enhance website performance and achieve your digital marketing objectives. Whether you are looking to improve SEO, refine your social media strategy, or boost conversion rates, understanding and utilizing Google Analytics is essential for your success.
Instagram has become one of the most popular social media platforms, allowing people to share photos, videos, and stories with their followers. Sometimes, though, you might want to view someone's story without them knowing.
Data unbanked indonesia 2017 findex full report chapter2
1. | 35
2 THE UNBANKED
Globally, about 1.7 billion adults remain unbanked—without an account at a
financial institution or through a mobile money provider. In 2014 that number
was 2 billion.
Because account ownership is nearly universal in high-income economies, virtu-
ally all unbanked adults live in developing economies. China and India, despite
having relatively high account ownership, claim large shares of the global
unbanked population because of their sheer size. Home to 225 million adults
without an account, China has the world’s largest unbanked population, fol-
lowed by India (190 million), Pakistan (100 million), and Indonesia (95 million)
(map 2.1). Indeed, these four economies, together with three others—Nigeria,
Mexico, and Bangladesh—are home to nearly half the world’s unbanked popula-
tion (figure 2.1).
MAP 2.1
Globally, 1.7 billion adults lack an account
Adults without an account, 2017
1 million
10 million
100 million
200 million
Source: Global Findex database.
Note: Data are not displayed for economies where the share of adults without an account is 5 percent or less.
2. 36 | FINDEX 2017
Who the unbanked are
Women are overrepresented among the world’s unbanked. About 980 million do
not have an account, 56 percent of all unbanked adults globally (figure 2.2).
Women are also overrepresented among the unbanked in most economies. This
is true even in economies that have successfully increased account ownership
and have a relatively small share of adults who are unbanked. In Kenya, where
only about a fifth of adults are unbanked, about two‑thirds of them are women
(figure 2.3). Women make up nearly 60 percent of unbanked adults in China and
India—and an even higher share in Turkey. Things are not much different in
economies where half or more of adults remain unbanked: in Bangladesh 65 per-
cent of unbanked adults are women, and in Colombia 56 percent are.
Those without an account, men as well as women, tend to be concentrated among
poorer households. Globally, about a quarter of unbanked adults live in the poor-
est 20 percent of households within their economy, about twice the share living
in the richest 20 percent (figure 2.4).
Sorting households within each economy into just two groups—the poorest
40 percent and the richest 60 percent—provides another perspective. World-
wide, half of unbanked adults come from the poorest 40 percent of households
within their economy, while the other half live in the richest 60 percent. This
global pattern is replicated in many economies where half or more of adults are
unbanked, such as Colombia, Ethiopia, Indonesia, and Nigeria. In these econo-
mies unbanked adults are just as likely to come from poorer households as from
wealthier ones.
But in economies that have expanded account ownership to two-thirds or more
of adults, poor adults are more overrepresented among the unbanked (fig-
ure 2.5). In China, for example, where about a fifth of all adults are unbanked,
FIGURE 2.1
Nearly half of all unbanked adults live in just seven
economies
Adults without an account by economy (%), 2017
Bangladesh
Mexico
India
Indonesia
China
Pakistan
Rest of world
Nigeria
54
13
11
6
6
4
3
3
Source: Global Findex database.
3. The unbanked | 37
FIGURE 2.2
Worldwide, most unbanked adults
are women
Adults without an account by gender (%), 2017
44
56 Women
Men
Source: Global Findex database.
FIGURE 2.3
Women are overrepresented among the
unbanked in most economies
Adults without an account (%), 2017
Pakistan
Nigeria
Indonesia
Ethiopia
Colombia
Bangladesh
Turkey
Kenya
India
China
Brazil
Women Men
0 20 40 60 80
Economies with half or more of adults unbanked
Economies with a third or less of adults unbanked
Source: Global Findex database.
FIGURE 2.4
Twice as many unbanked adults live
in the poorest households in their
economy as in the richest ones
Adults without an account by within‑economy
income quintile (%), 2017
Q1:
27
Q2:
23
Q3:
20
Q4:
17
Q5:
13
Poorest
Richest
Source: Global Findex database.
FIGURE 2.5
In economies where a small share of
adults remain unbanked, most of the
unbanked are poor
Adults without an account (%), 2017
Pakistan
Nigeria
Indonesia
Ethiopia
Colombia
Bangladesh
Turkey
Kenya
India
China
Brazil
Poorest 40% Richest 60%
of households of households
0 20 40 60 80
Economies with half or more of adults unbanked
Economies with a third or less of adults unbanked
Source: Global Findex database.
4. 38 | FINDEX 2017
65 percent of this group belongs to the poorest
40 percent of households. In Brazil, where a little
less than a third of adults are unbanked, 58 per-
cent of these adults live in the poorest 40 percent
of households.
Unbanked adults are disproportionately young.
Globally, 30 percent of unbanked adults are
between 15 and 24 years old (figure 2.6).1
Among
all adults in developing economies, only 23 per-
cent fall in that age group. The unbanked pop-
ulation is even younger in economies where the
share of unbanked adults is relatively small. In
Brazil, India, and Kenya about 4 in 10 unbanked
adults are in the age group 15–24.
Unbanked adults tend to have low educational
attainment. Globally, 62 percent of the unbanked
have a primary education or less, compared with about half of adults overall in
developing economies. This share is even higher in some economies, such as
Ethiopia, where 92 percent of unbanked adults have a primary education or less
—as well as Tanzania (86 percent) and Pakistan (75 percent). Worldwide, only
38 percent of the unbanked have completed high school or postsecondary edu-
cation (figure 2.7).
A slight majority of unbanked adults are either employed or seeking work. Yet
compared with other adults, those who are unbanked are more likely to be out
of the labor force. Among all adults in developing economies, 37 percent are out
of the labor force. Among unbanked adults, that share is 10 percentage points
higher (figure 2.8).
FIGURE 2.7
Most unbanked adults have a primary
education or less
Adults without an account by educational attainment
(%), 2017
38
62 Primary education
or less
High school or
postsecondary
Source: Global Findex database.
FIGURE 2.6
Three in 10 unbanked adults are between
the ages of 15 and 24
Adults without an account by age group (%), 2017
70
30 Ages 15–24
Age 25+
Source: Global Findex database.
FIGURE 2.8
Almost half of unbanked adults are out of
the labor force
Adults without an account by labor force participation
(%), 2017
53
47 Out of
labor force
Employed or
seeking work
Sources: Global Findex database; Gallup World Poll 2017.
5. The unbanked | 39
These global numbers obscure gender inequal-
ity in labor force participation among unbanked
adults. The majority of unbanked men—
68 percent—are employed or seeking work.
For unbanked women the picture is flipped:
59 percent are out of the labor force altogether
(figure 2.9).
Among unbanked adults who are economically
active, self-employment is the most common
form of work. Indeed, more than a quarter of all
unbanked adults reported being self-employed,
while less than a fifth reported working for
wages (figure 2.10). The reverse is true for adults
overall in the developing world: the share work-
ing for wages, at 31 percent, is slightly larger than
the share who are self-employed.
Why people remain unbanked
Globally, 31 percent of adults are unbanked. To help shed light on the reasons for
this, the 2017 Global Findex survey asked adults without an account at a finan-
cial institution why they do not have one. Respondents could offer more than one
reason, and most gave two.
The most commonly cited barrier was lack of enough money. Nearly two-thirds
of adults without an account at a financial institution said that they have too
little money to use one, and roughly one in five cited this as their sole reason
FIGURE 2.9
Among the unbanked, women are less likely than men to participate in the labor force
Adults without an account by gender and labor force participation (%), 2017
41
59
MEN WOMEN
Out of
labor force
Employed or
seeking work
68
32 Out of
labor force
Employed or
seeking work
Sources: Global Findex database; Gallup World Poll 2017.
FIGURE 2.10
Self-employment is the most common
form of work for unbanked adults
Adults without an account by employment status (%),
2017
47 Out of
labor force
6 Unemployed
28 Self-employed
18 In wage
employment
Sources: Global Findex database; Gallup World Poll 2017.
6. 40 | FINDEX 2017
for not having one (figure 2.11). No other rea-
son was cited as the sole barrier by more than
5 percent.
Worldwide, 30 percent of adults without an
account at a financial institution said that they do
not need one, making this the second most com-
mon reason cited. Yet only 3 percent cited it as
their only reason for not having an account. This
suggests that among those reporting lack of need
as one of several reasons, some might be open to
using financial services if the services are acces-
sible and relevant to their lives.
Cost is another important barrier, cited by
26 percent of adults without an account at a
financial institution. But the share reporting that
accounts are too expensive was twice as high
in Latin America and the Caribbean. In Brazil,
Colombia, and Peru almost 60 percent cited cost
as a barrier.
A similar global share, 26 percent, said that they do not have an account because
a family member already has one. In some economies women were more likely
than men to cite this reason. Among those without an account in Turkey, 72 per-
cent of women mentioned this reason, while 51 percent of men did. In China the
share for women was 35 percent, and for men 27 percent.
Distance is a barrier for many: 22 percent of adults without an account said that
financial institutions are too far away. In some economies the share was higher,
with about 33 percent citing distance as a barrier in Brazil, Indonesia, and
Kenya—and 41 percent doing so in the Philippines.
Documentation requirements also hamper account ownership. Twenty per-
cent of adults without an account at a financial institution reported lacking the
documentation needed to open one. Higher shares cited this barrier in such
economies as Zambia (35 percent), the Philippines (45 percent), and Zimbabwe
(49 percent).
Distrust in the financial system features as a greater barrier in some regions than
in others. Globally, 16 percent of adults without an account at a financial institu-
tion cited this barrier—but the share was more than twice as high in Europe and
Central Asia and in Latin America and the Caribbean.
While only 6 percent of adults without an account at a financial institution
cited religious concerns as a reason, the share was substantially higher in some
FIGURE 2.11
Lack of enough money is the most
commonly cited barrier to account
ownership
Adults without a financial institution account reporting
barrier as a reason for not having one (%), 2017
0 20 40 60 80
Religious reasons
Lack of trust
Lack of necessary
documentation
Financial institutions
too far away
Family member already
has an account
Accounts too expensive
Do not need an account
Not enough money
Cited as sole reason Cited with other reasons
Source: Global Findex database.
Note: Respondents could choose more than one reason.
7. The unbanked | 41
economies with a predominantly Muslim population. In Pakistan 13 percent
mentioned religious reasons, and in Turkey 19 percent did. Yet high costs turned
out to be at least as important as religious concerns in each of these economies
—cited by 21 percent in Pakistan and 19 percent in Turkey. And the share who
reported religious concerns as their sole reason for not having an account was
minuscule—2 percent in Pakistan and 1 percent in Turkey. Moreover, in several
other economies with a mostly Muslim population—including Bangladesh, the
Arab Republic of Egypt, and Indonesia—the share citing religious reasons was
virtually the same as the world average.2
Notes
1. This share does not change if young adults are defined as those ages 18–24.
2. The low share of adults without an account at a financial institution citing religious con-
cerns as a reason in some economies with a predominantly Muslim population could
reflect the presence of Sharia-compliant financial institutions in these economies.