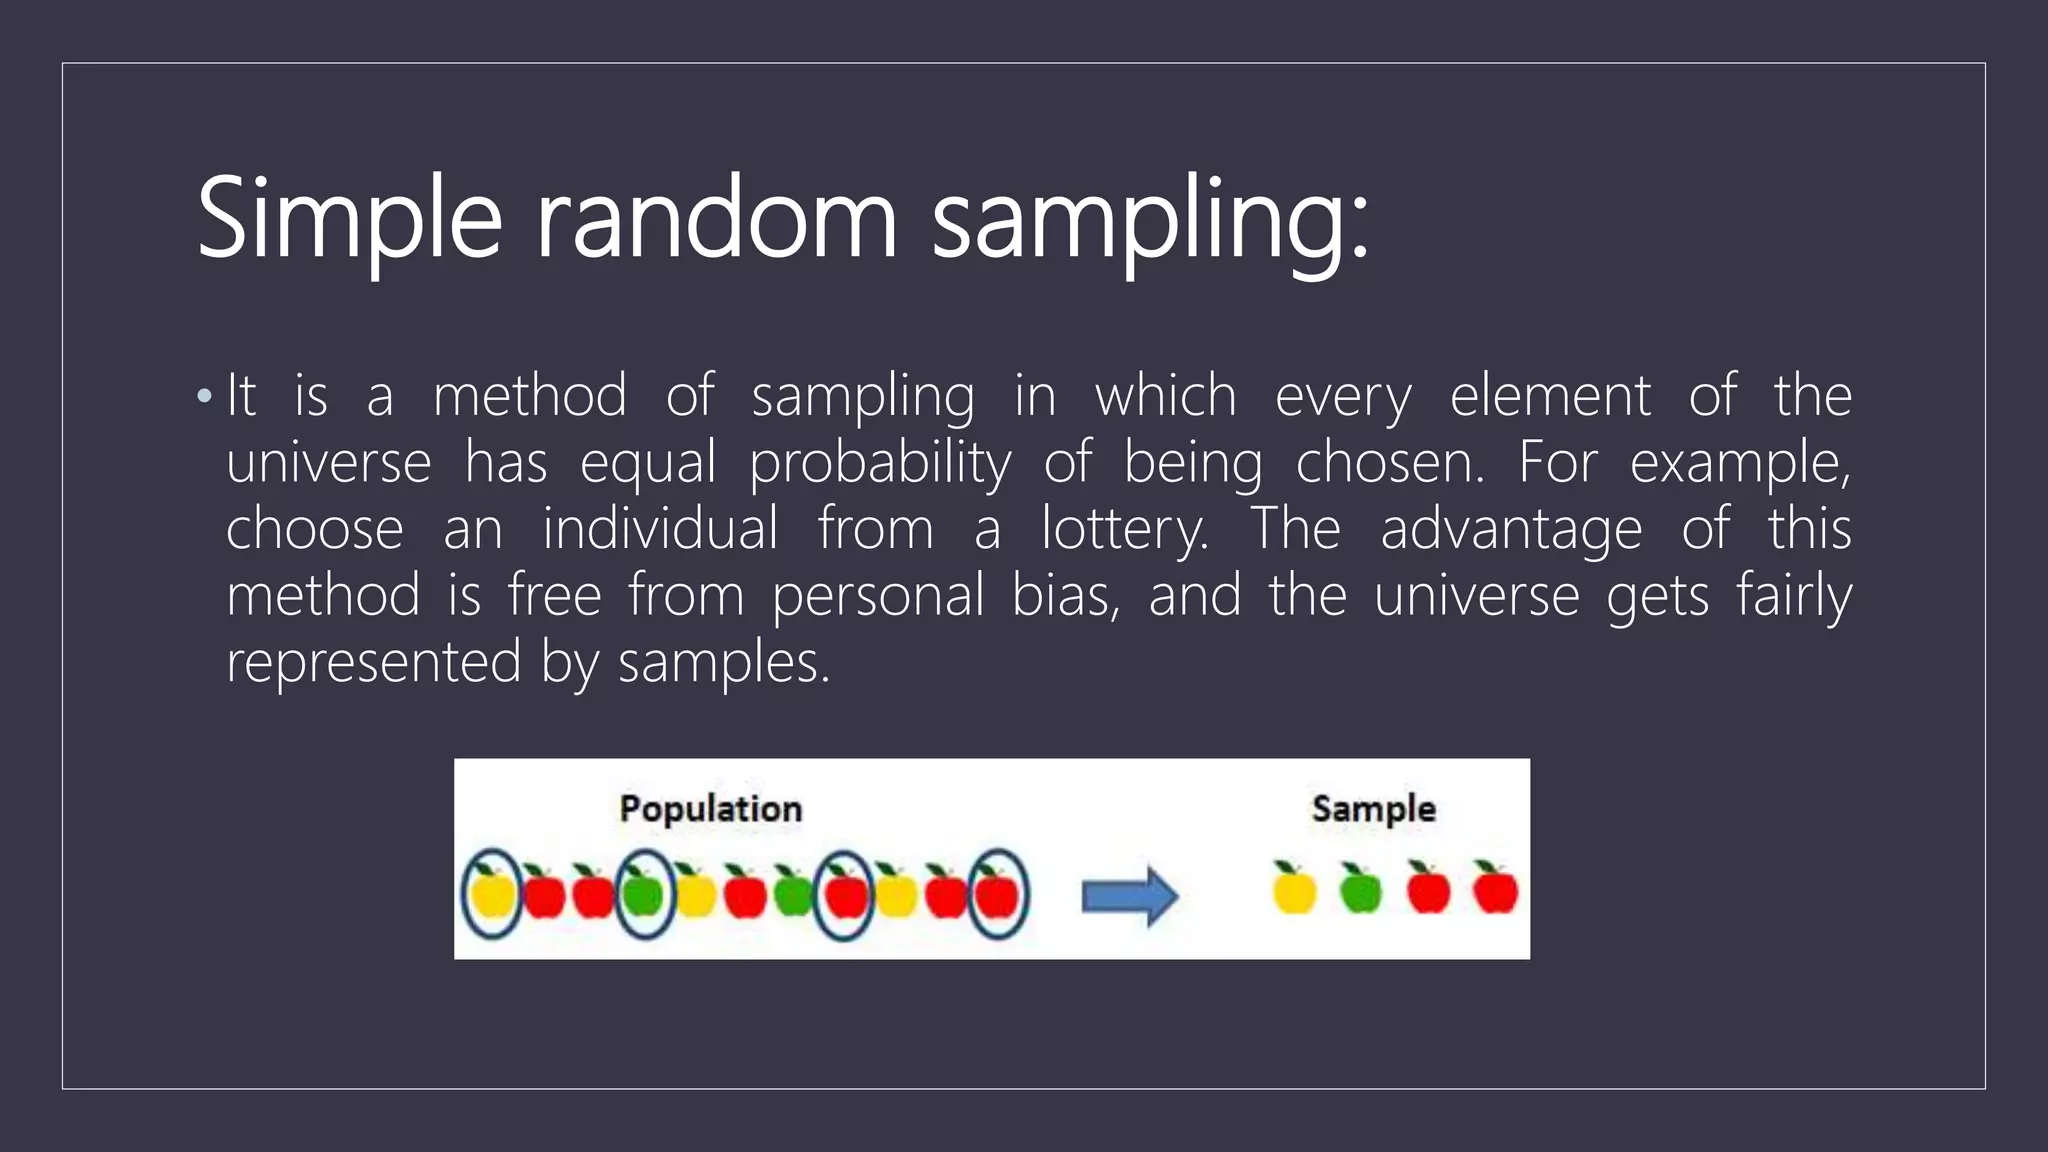
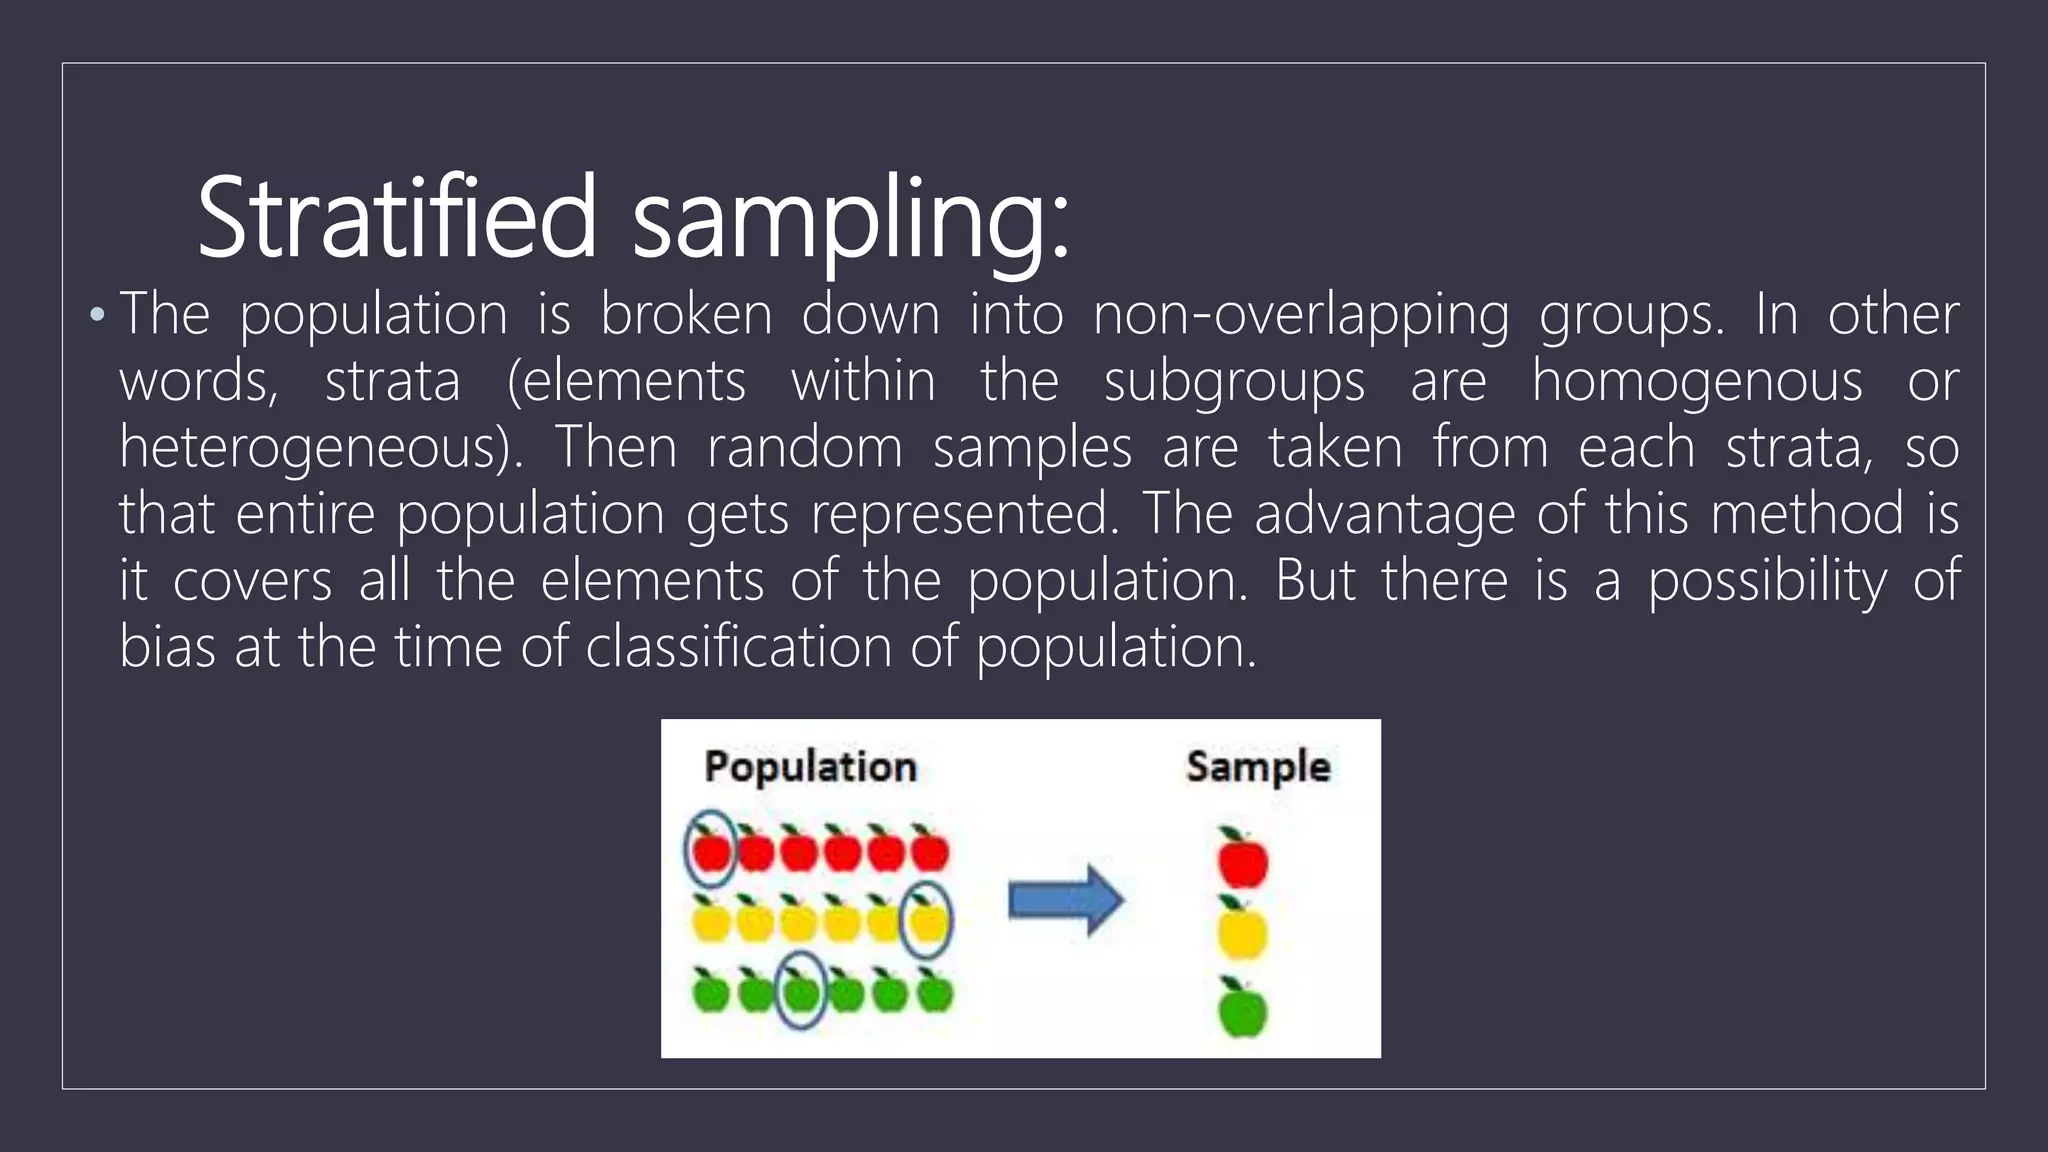
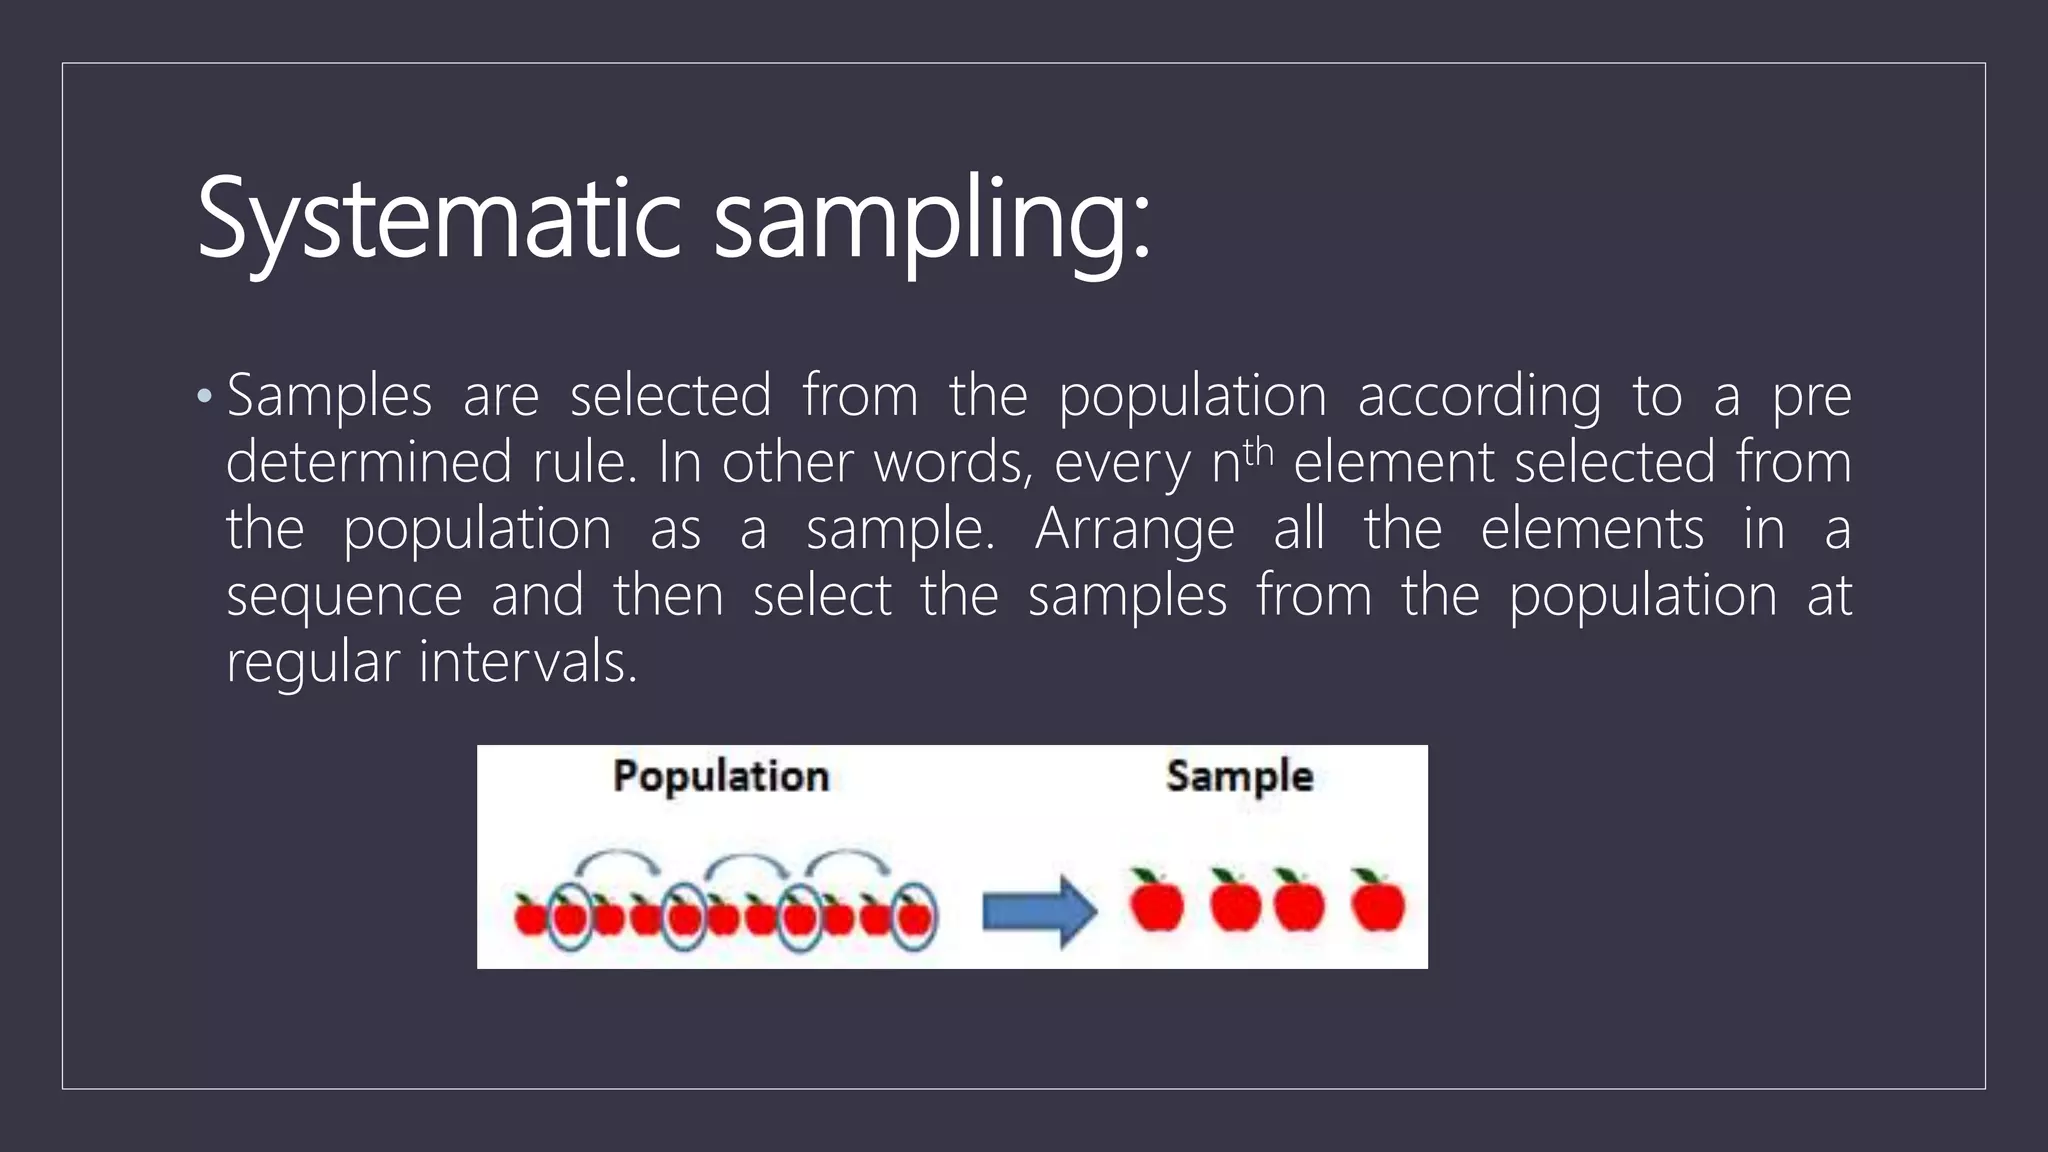
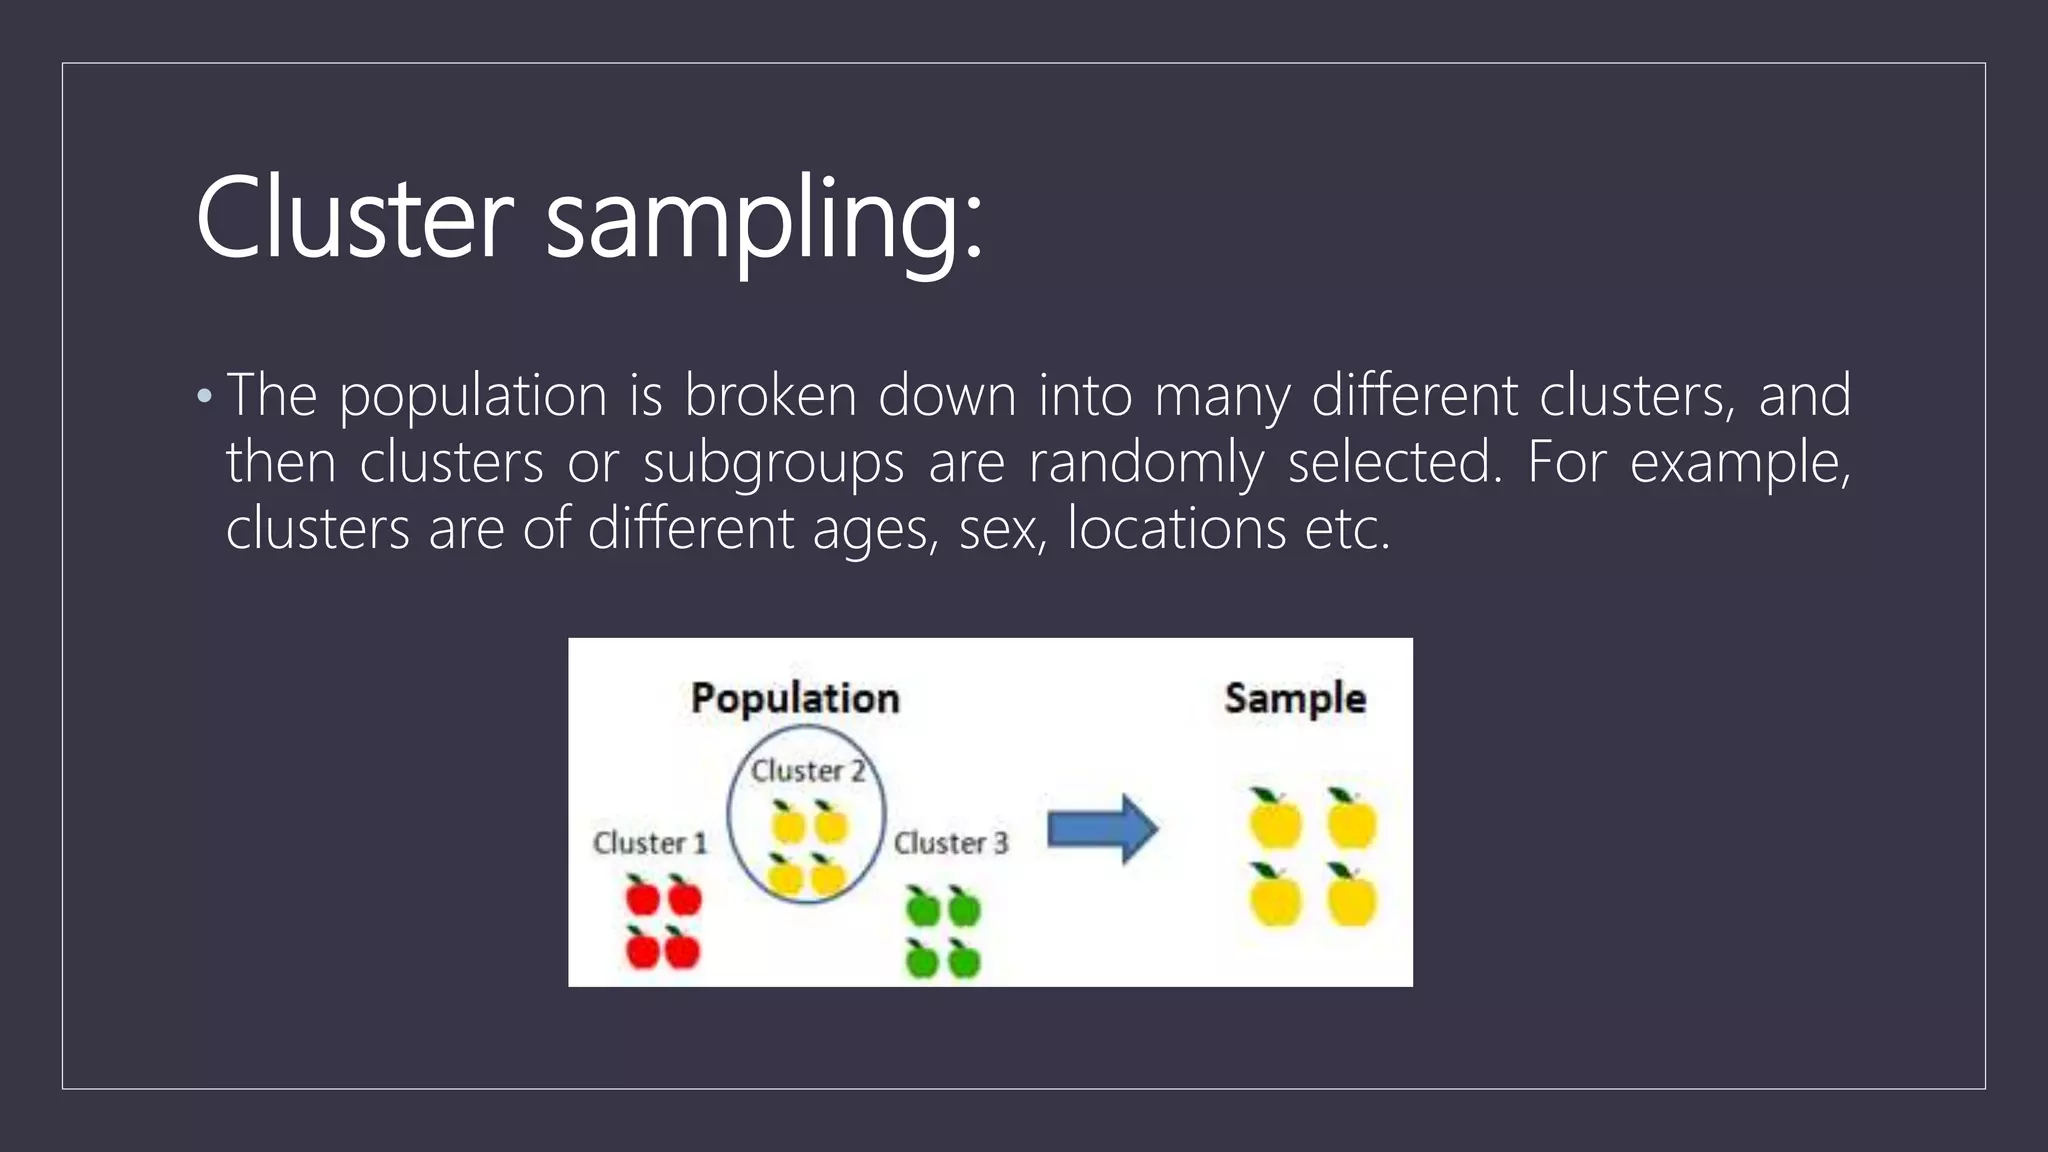
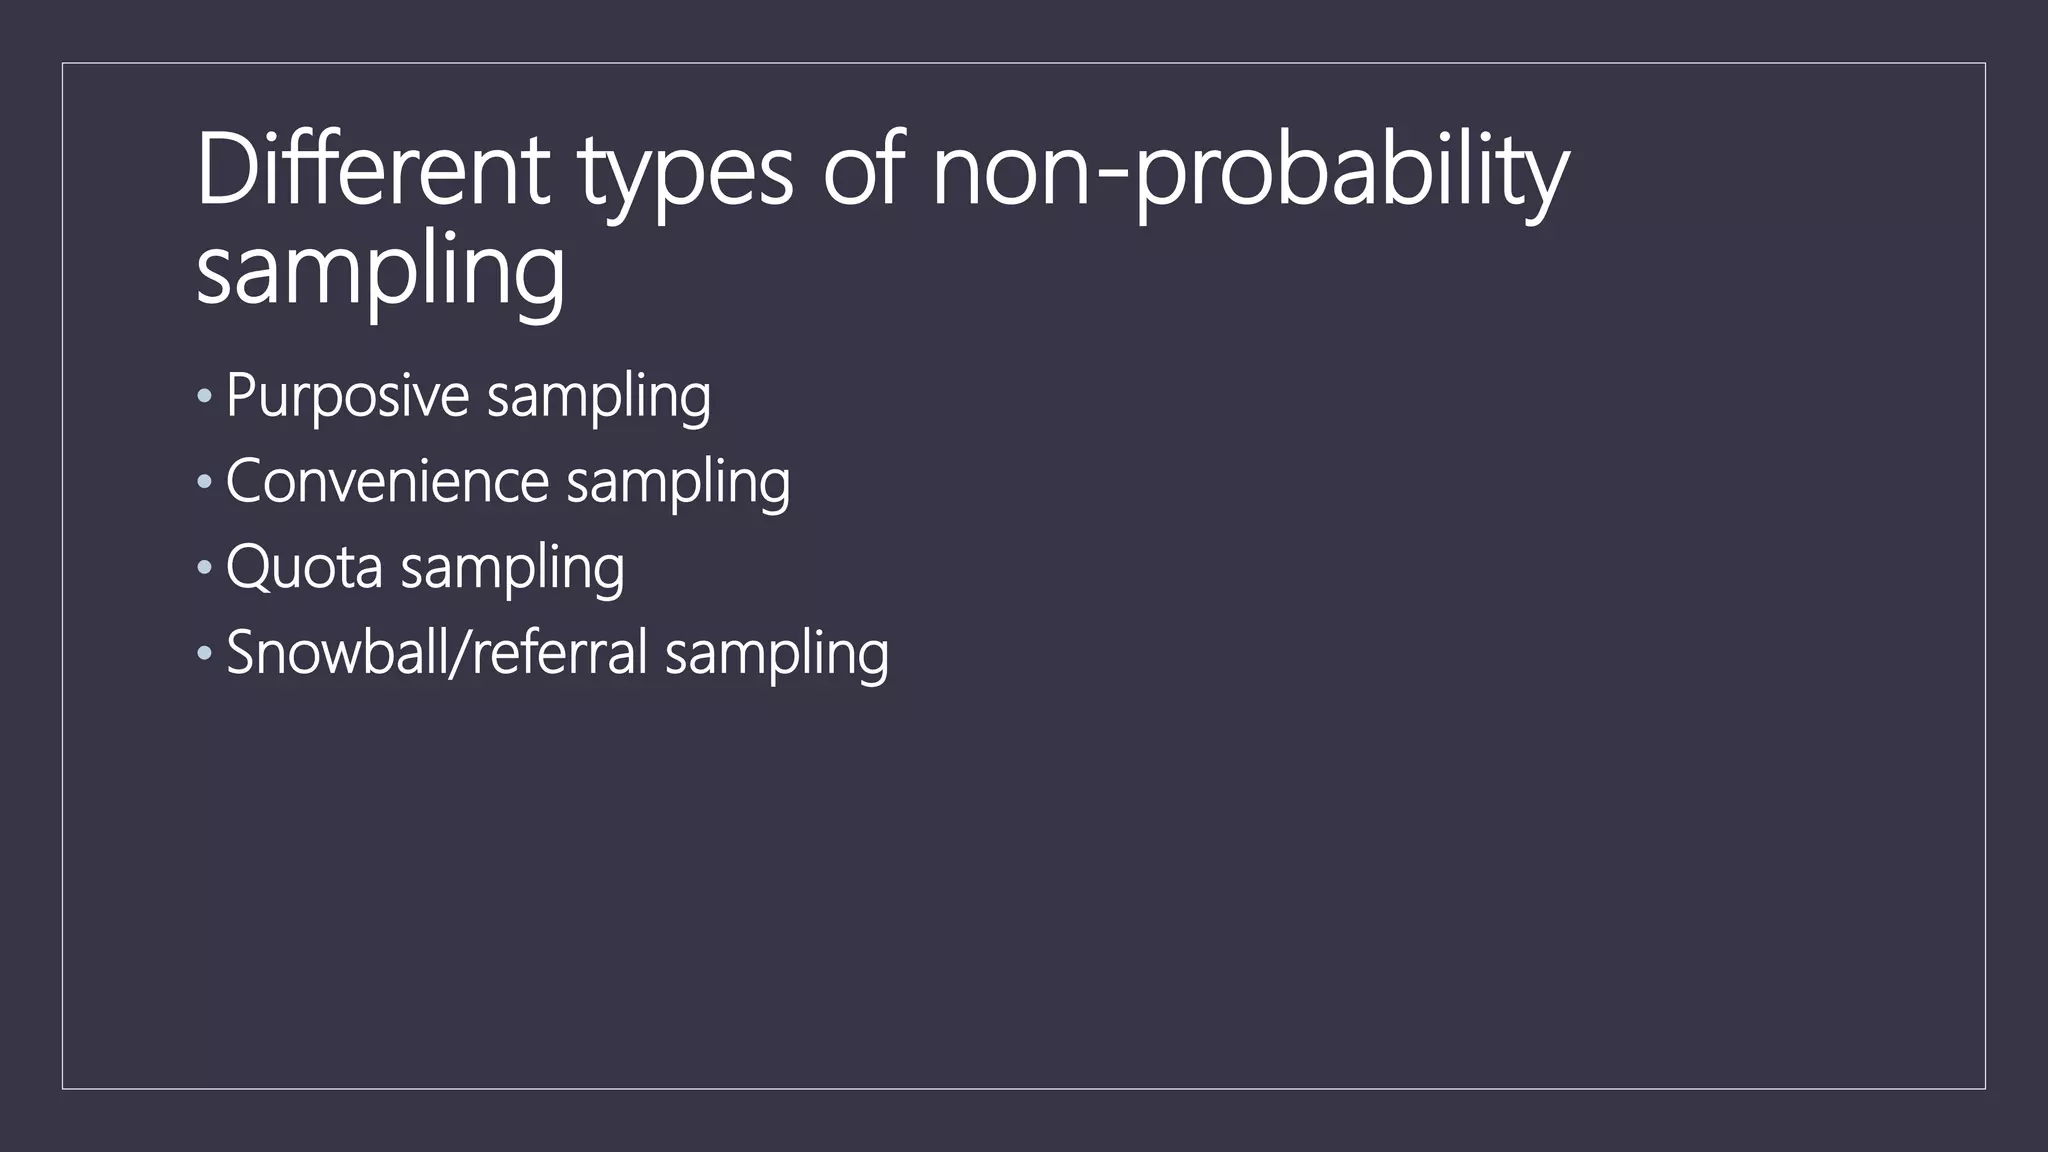
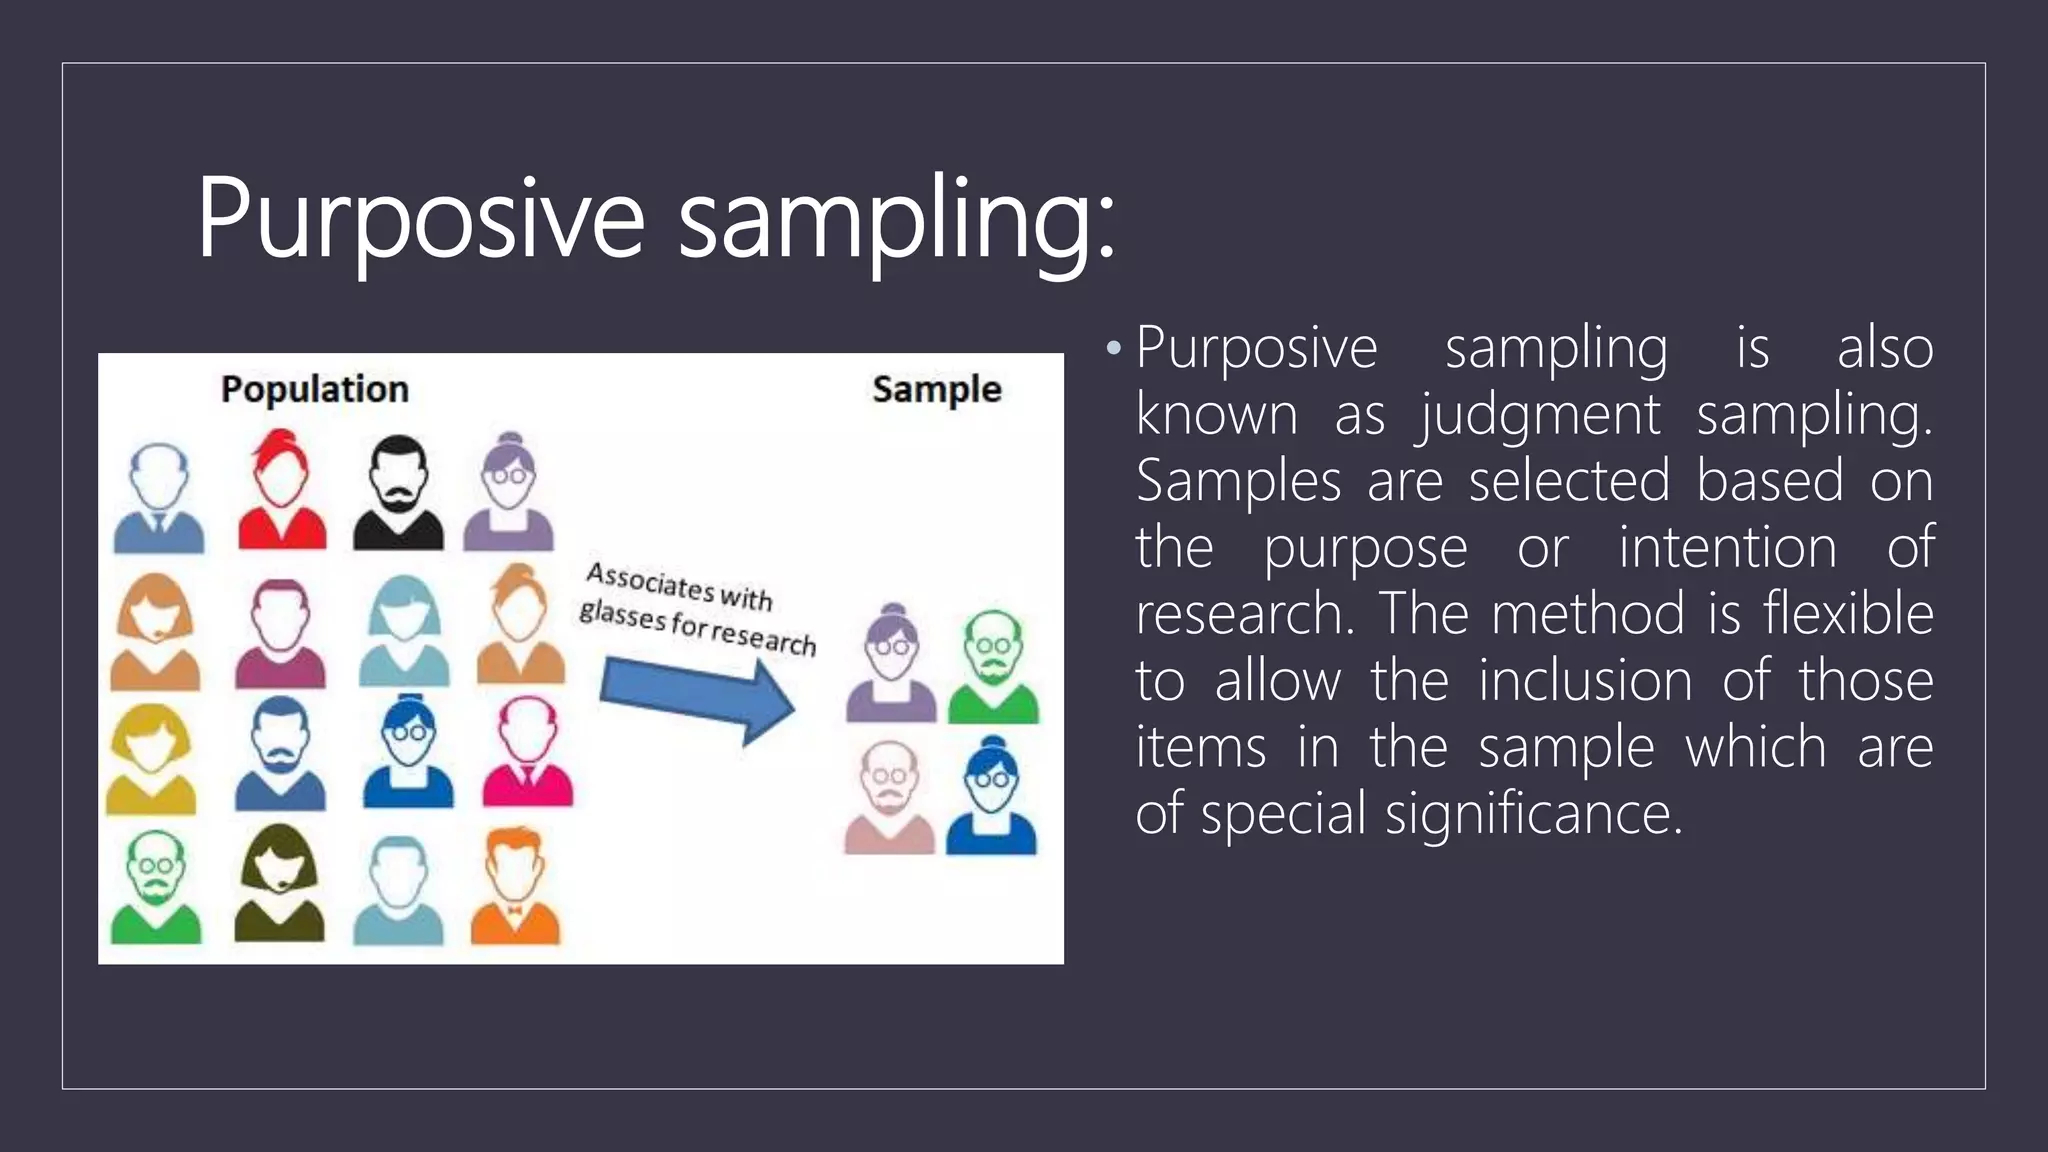
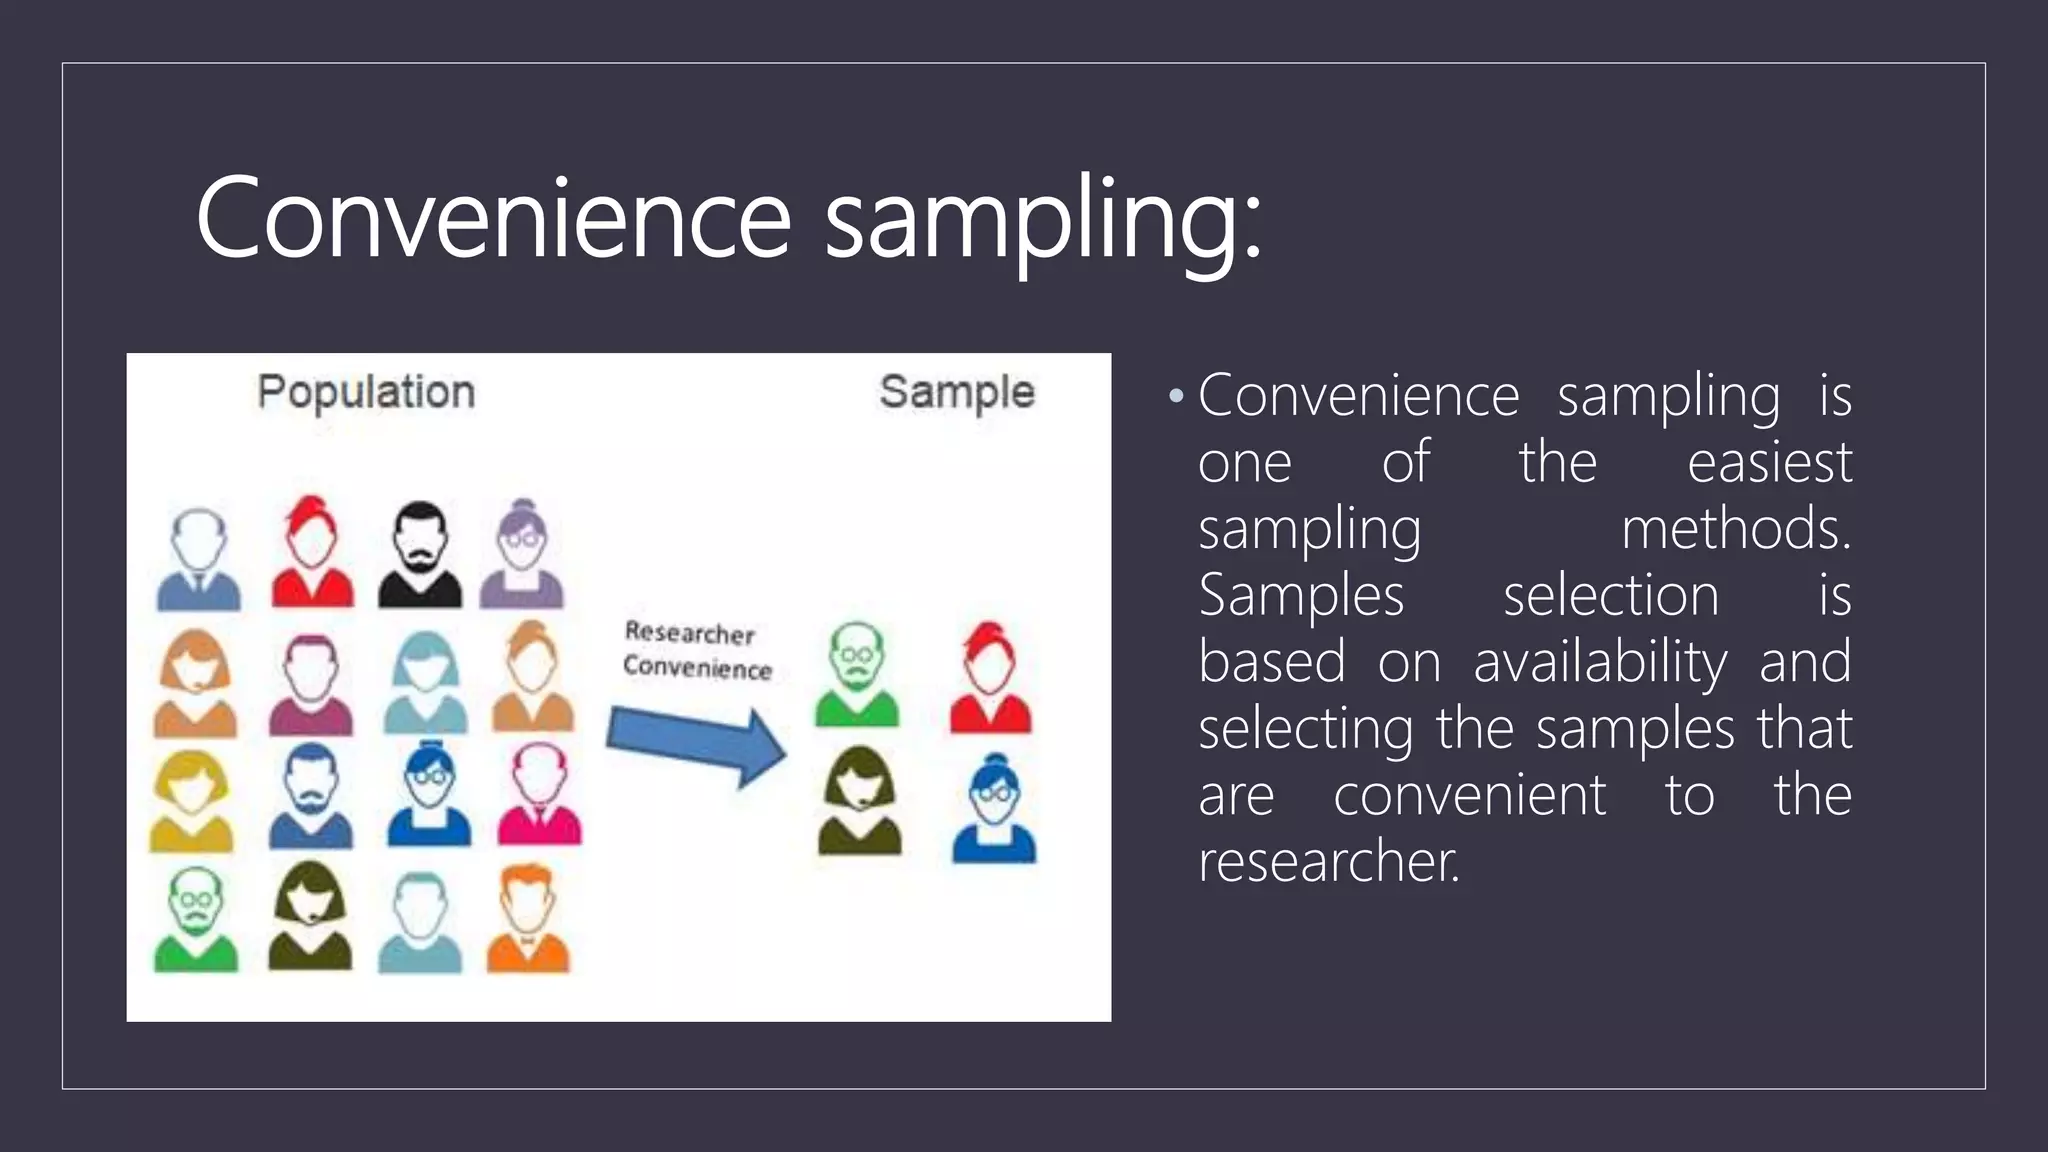
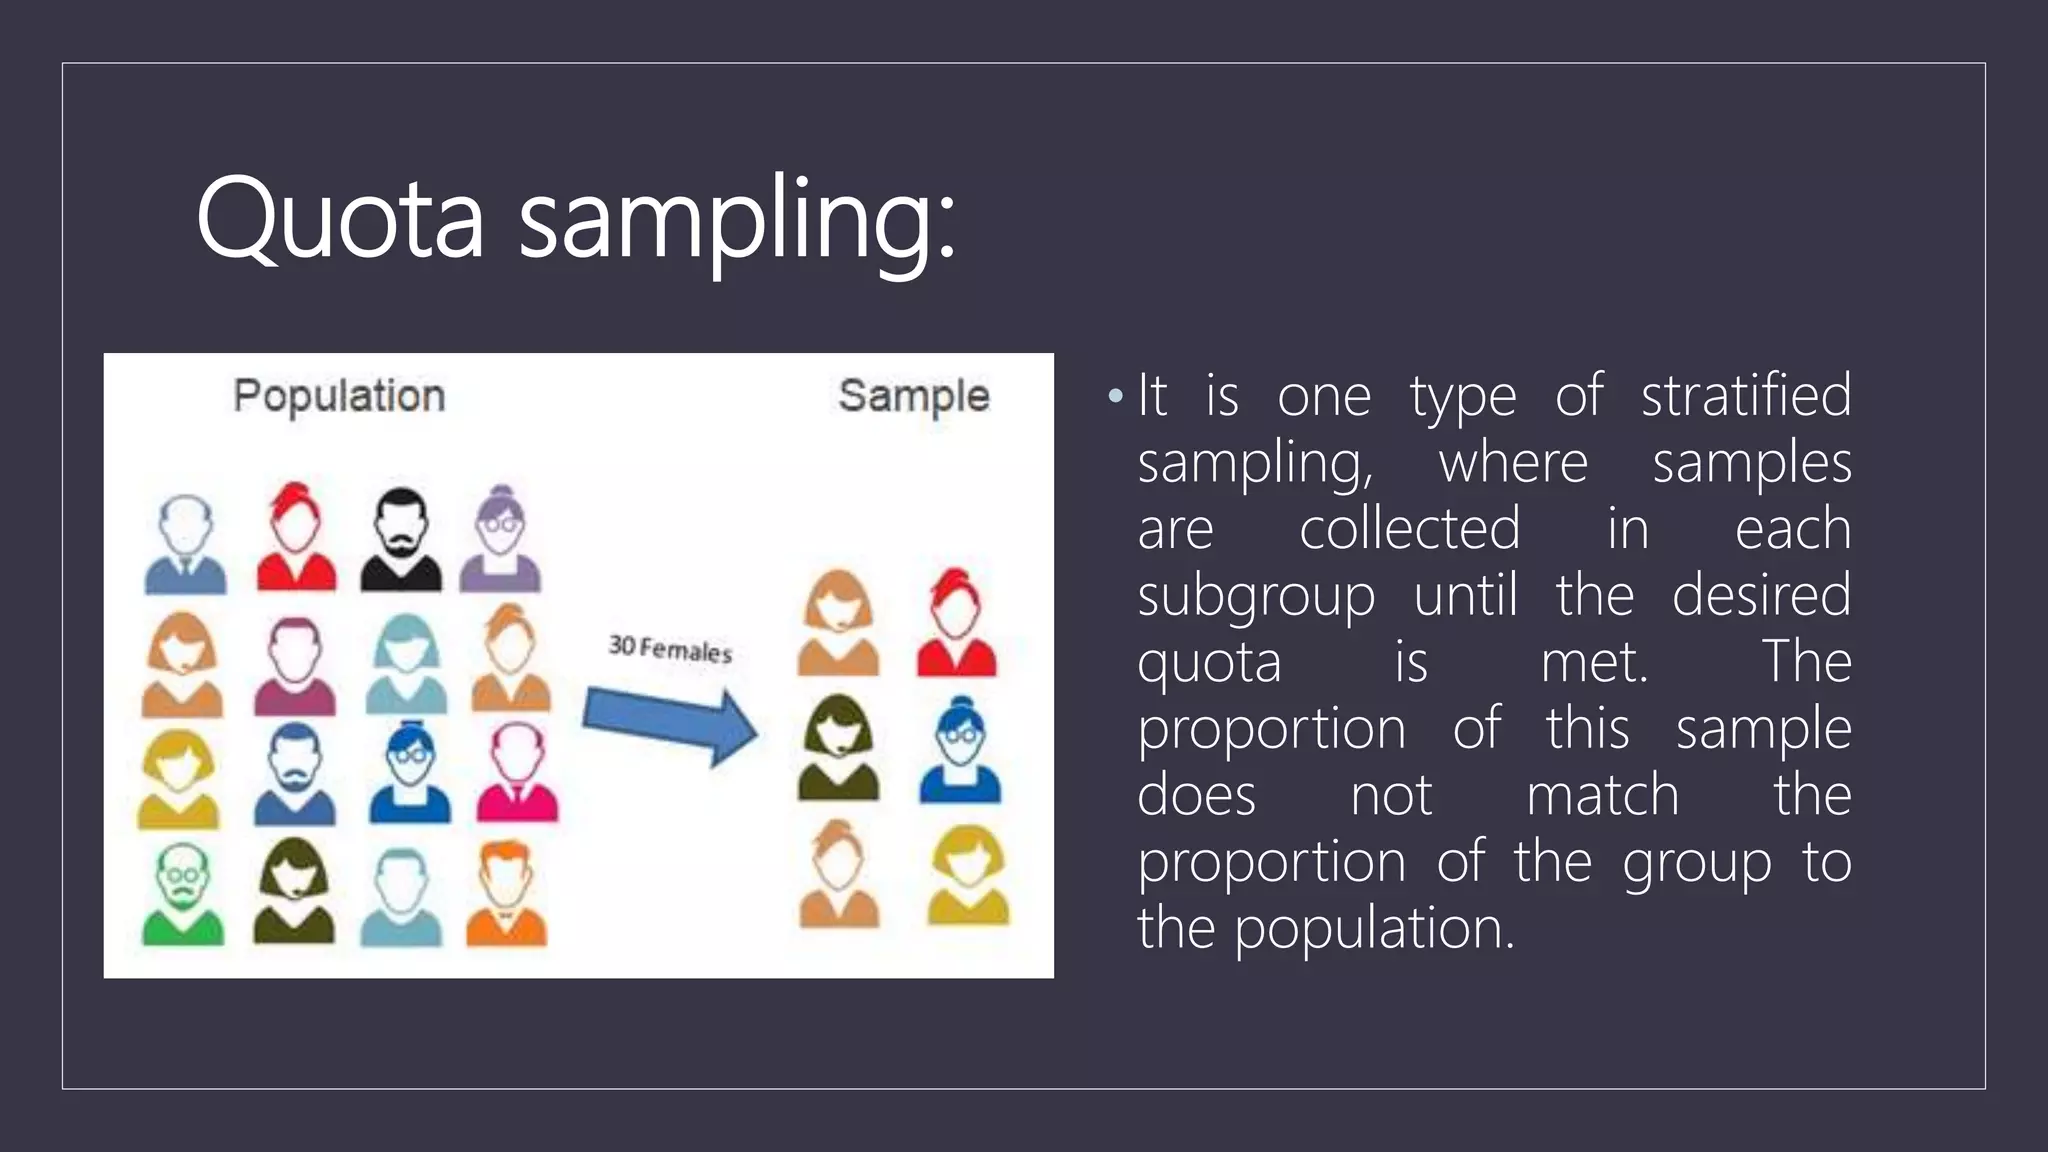
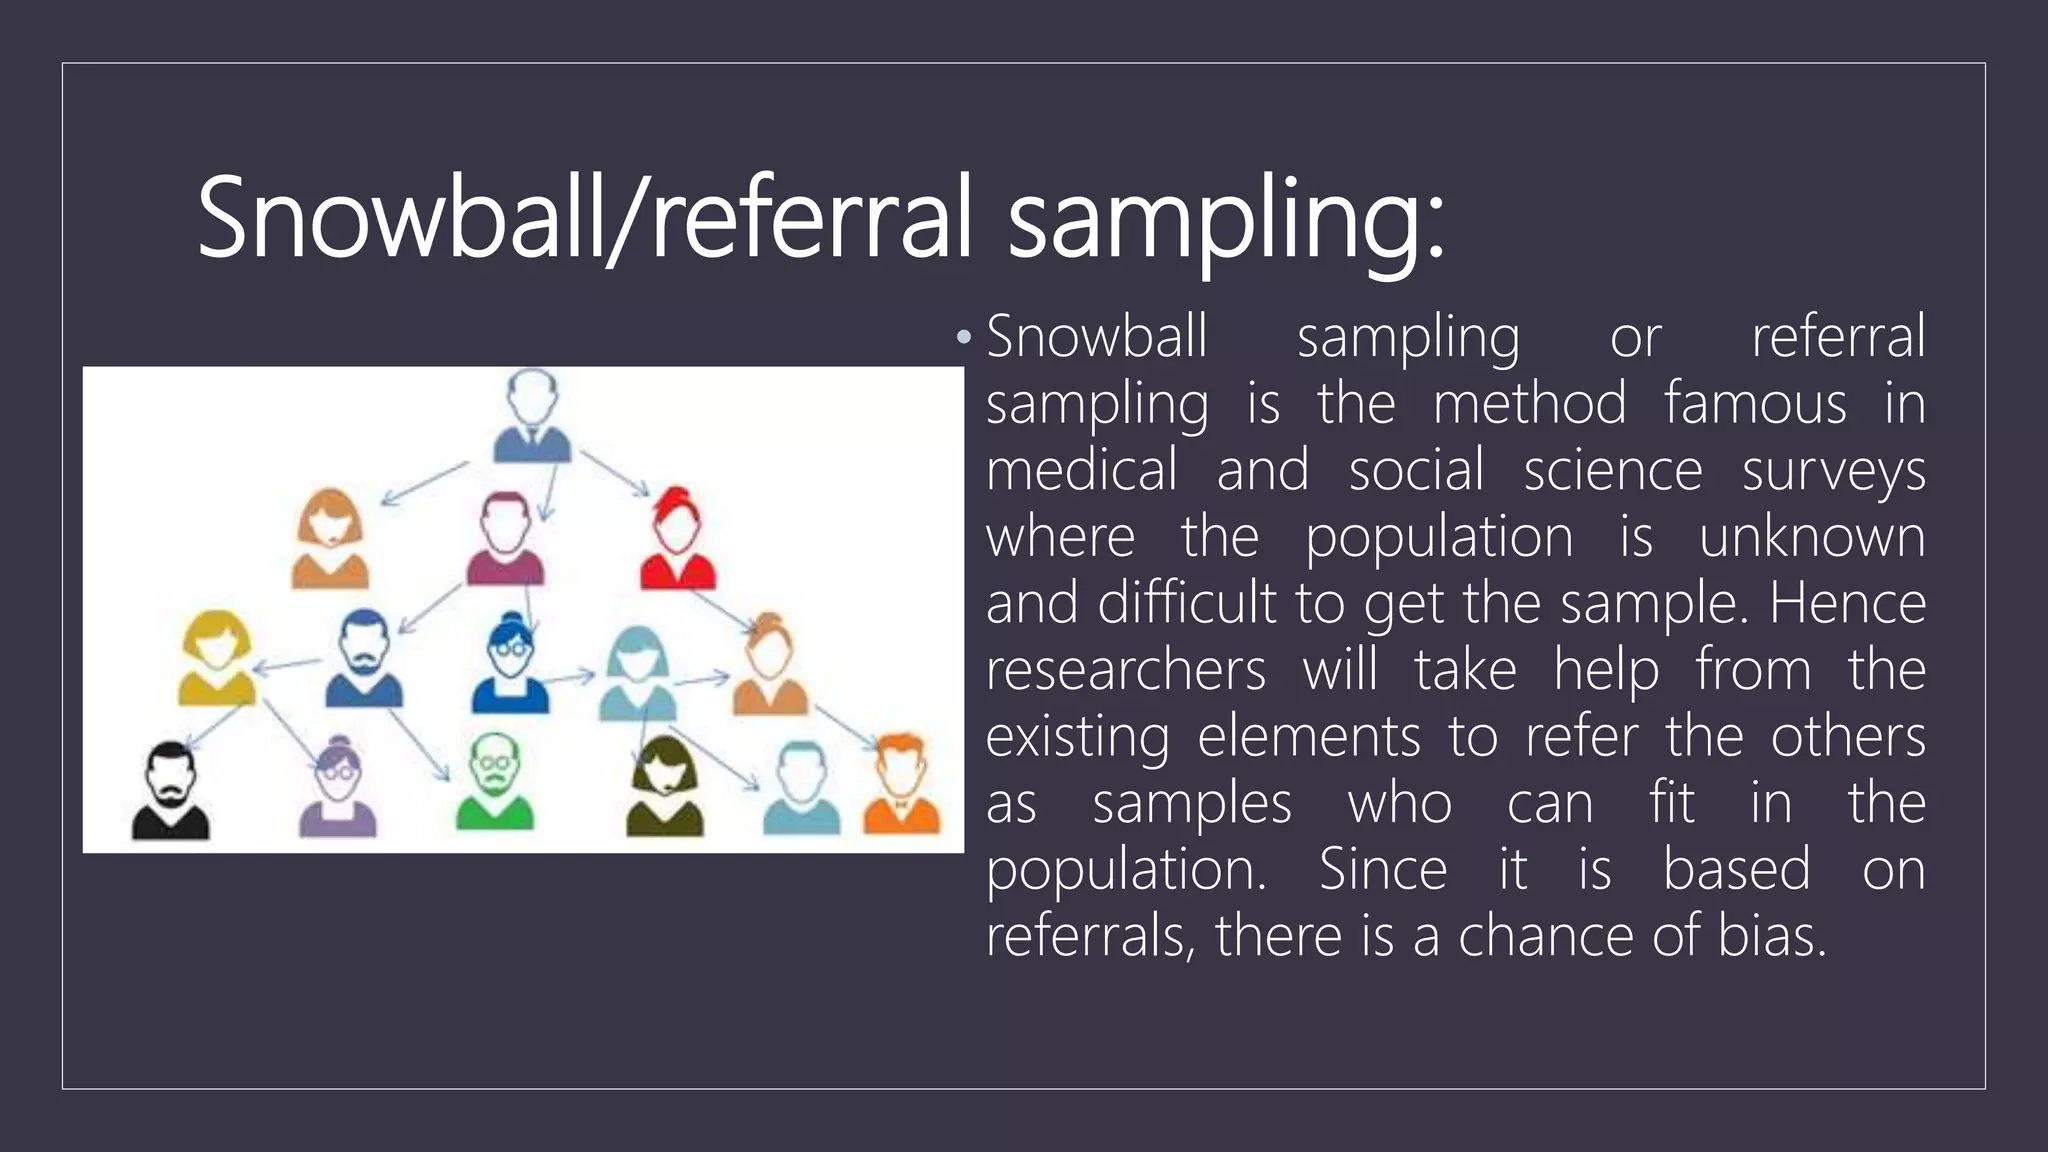
Data sampling is a statistical technique used to select a representative subset of data to identify patterns in a larger dataset. It allows analysts to work with a small, manageable sample while still producing accurate results. Probability sampling methods like simple random sampling aim to give every element an equal chance of selection to avoid bias, while non-probability methods like convenience sampling select available elements. Sample size and method choice impact sampling error and representation of the full data.
Sampling is procedure or process of selecting some units from the population with some common characteristics and is primarily concerned with the collection of data of some selected units of the population.
A sample design is a definite plan for obtaining a sample from a given population. It refers to the technique or the procedure the researcher would adopt in selecting items for the sample. Sample design may as well lay down the number of items to be included in the sample i.e., the size of the sample. Sample design is determined before data are collected. There are many sample designs from which a researcher can choose. Some designs are relatively more precise and easier to apply than others. Researcher must select/prepare a sample design which should be reliable and appropriate for his research study.
Population in statistics means the whole of the information which comes under the preview of statistical investigation.
In other words, an aggregate of objects animate or in animate under study is the population.
It is also known as “Universe”.
Qualitative sampling design is a key step in qualitative research, especially for rural development, researchers
this document provides the necessary details on the procedures to follow
Levelwise PageRank with Loop-Based Dead End Handling Strategy : SHORT REPORT ...Subhajit Sahu
Abstract — Levelwise PageRank is an alternative method of PageRank computation which decomposes the input graph into a directed acyclic block-graph of strongly connected components, and processes them in topological order, one level at a time. This enables calculation for ranks in a distributed fashion without per-iteration communication, unlike the standard method where all vertices are processed in each iteration. It however comes with a precondition of the absence of dead ends in the input graph. Here, the native non-distributed performance of Levelwise PageRank was compared against Monolithic PageRank on a CPU as well as a GPU. To ensure a fair comparison, Monolithic PageRank was also performed on a graph where vertices were split by components. Results indicate that Levelwise PageRank is about as fast as Monolithic PageRank on the CPU, but quite a bit slower on the GPU. Slowdown on the GPU is likely caused by a large submission of small workloads, and expected to be non-issue when the computation is performed on massive graphs.
Show drafts
volume_up
Empowering the Data Analytics Ecosystem: A Laser Focus on Value
The data analytics ecosystem thrives when every component functions at its peak, unlocking the true potential of data. Here's a laser focus on key areas for an empowered ecosystem:
1. Democratize Access, Not Data:
Granular Access Controls: Provide users with self-service tools tailored to their specific needs, preventing data overload and misuse.
Data Catalogs: Implement robust data catalogs for easy discovery and understanding of available data sources.
2. Foster Collaboration with Clear Roles:
Data Mesh Architecture: Break down data silos by creating a distributed data ownership model with clear ownership and responsibilities.
Collaborative Workspaces: Utilize interactive platforms where data scientists, analysts, and domain experts can work seamlessly together.
3. Leverage Advanced Analytics Strategically:
AI-powered Automation: Automate repetitive tasks like data cleaning and feature engineering, freeing up data talent for higher-level analysis.
Right-Tool Selection: Strategically choose the most effective advanced analytics techniques (e.g., AI, ML) based on specific business problems.
4. Prioritize Data Quality with Automation:
Automated Data Validation: Implement automated data quality checks to identify and rectify errors at the source, minimizing downstream issues.
Data Lineage Tracking: Track the flow of data throughout the ecosystem, ensuring transparency and facilitating root cause analysis for errors.
5. Cultivate a Data-Driven Mindset:
Metrics-Driven Performance Management: Align KPIs and performance metrics with data-driven insights to ensure actionable decision making.
Data Storytelling Workshops: Equip stakeholders with the skills to translate complex data findings into compelling narratives that drive action.
Benefits of a Precise Ecosystem:
Sharpened Focus: Precise access and clear roles ensure everyone works with the most relevant data, maximizing efficiency.
Actionable Insights: Strategic analytics and automated quality checks lead to more reliable and actionable data insights.
Continuous Improvement: Data-driven performance management fosters a culture of learning and continuous improvement.
Sustainable Growth: Empowered by data, organizations can make informed decisions to drive sustainable growth and innovation.
By focusing on these precise actions, organizations can create an empowered data analytics ecosystem that delivers real value by driving data-driven decisions and maximizing the return on their data investment.
As Europe's leading economic powerhouse and the fourth-largest hashtag#economy globally, Germany stands at the forefront of innovation and industrial might. Renowned for its precision engineering and high-tech sectors, Germany's economic structure is heavily supported by a robust service industry, accounting for approximately 68% of its GDP. This economic clout and strategic geopolitical stance position Germany as a focal point in the global cyber threat landscape.
In the face of escalating global tensions, particularly those emanating from geopolitical disputes with nations like hashtag#Russia and hashtag#China, hashtag#Germany has witnessed a significant uptick in targeted cyber operations. Our analysis indicates a marked increase in hashtag#cyberattack sophistication aimed at critical infrastructure and key industrial sectors. These attacks range from ransomware campaigns to hashtag#AdvancedPersistentThreats (hashtag#APTs), threatening national security and business integrity.
🔑 Key findings include:
🔍 Increased frequency and complexity of cyber threats.
🔍 Escalation of state-sponsored and criminally motivated cyber operations.
🔍 Active dark web exchanges of malicious tools and tactics.
Our comprehensive report delves into these challenges, using a blend of open-source and proprietary data collection techniques. By monitoring activity on critical networks and analyzing attack patterns, our team provides a detailed overview of the threats facing German entities.
This report aims to equip stakeholders across public and private sectors with the knowledge to enhance their defensive strategies, reduce exposure to cyber risks, and reinforce Germany's resilience against cyber threats.
Data Centers - Striving Within A Narrow Range - Research Report - MCG - May 2...pchutichetpong
M Capital Group (“MCG”) expects to see demand and the changing evolution of supply, facilitated through institutional investment rotation out of offices and into work from home (“WFH”), while the ever-expanding need for data storage as global internet usage expands, with experts predicting 5.3 billion users by 2023. These market factors will be underpinned by technological changes, such as progressing cloud services and edge sites, allowing the industry to see strong expected annual growth of 13% over the next 4 years.
Whilst competitive headwinds remain, represented through the recent second bankruptcy filing of Sungard, which blames “COVID-19 and other macroeconomic trends including delayed customer spending decisions, insourcing and reductions in IT spending, energy inflation and reduction in demand for certain services”, the industry has seen key adjustments, where MCG believes that engineering cost management and technological innovation will be paramount to success.
MCG reports that the more favorable market conditions expected over the next few years, helped by the winding down of pandemic restrictions and a hybrid working environment will be driving market momentum forward. The continuous injection of capital by alternative investment firms, as well as the growing infrastructural investment from cloud service providers and social media companies, whose revenues are expected to grow over 3.6x larger by value in 2026, will likely help propel center provision and innovation. These factors paint a promising picture for the industry players that offset rising input costs and adapt to new technologies.
According to M Capital Group: “Specifically, the long-term cost-saving opportunities available from the rise of remote managing will likely aid value growth for the industry. Through margin optimization and further availability of capital for reinvestment, strong players will maintain their competitive foothold, while weaker players exit the market to balance supply and demand.”
Adjusting primitives for graph : SHORT REPORT / NOTESSubhajit Sahu
Graph algorithms, like PageRank Compressed Sparse Row (CSR) is an adjacency-list based graph representation that is
Multiply with different modes (map)
1. Performance of sequential execution based vs OpenMP based vector multiply.
2. Comparing various launch configs for CUDA based vector multiply.
Sum with different storage types (reduce)
1. Performance of vector element sum using float vs bfloat16 as the storage type.
Sum with different modes (reduce)
1. Performance of sequential execution based vs OpenMP based vector element sum.
2. Performance of memcpy vs in-place based CUDA based vector element sum.
3. Comparing various launch configs for CUDA based vector element sum (memcpy).
4. Comparing various launch configs for CUDA based vector element sum (in-place).
Sum with in-place strategies of CUDA mode (reduce)
1. Comparing various launch configs for CUDA based vector element sum (in-place).
2. • Data sampling is a statistical analysis technique used to select,
manipulate and analyze a representative subset of data points to
identify patterns and trends in the larger data set being examined. It
enables data scientists, predictive modelers and other data analysts to
work with a small, manageable amount of data about a
statistical population to build and run analytical models more quickly,
while still producing accurate findings.
• Sampling can be particularly useful with data sets that are too large to
efficiently analyze in full -- for example, in big data
analytics applications or surveys, Identifying and analyzing a
representative sample is more efficient and cost-effective than
surveying the entirety of the data or population.
3. Populations and Samples
• Population: Population is the group of elements which has
common characteristics. It is a collection of observations
about which we would like to make inferences.
• Sample: A sample is the subset of population
• Sampling: a collection of samples from the population is a
sampling. In other words, sampling units are an overlapping
collection of elements from the population.
4. • An important consideration, though, is the size of the required
data sample and the possibility of introducing a sampling error. In
some cases, a small sample can reveal the most important
information about a data set. In others, using a larger sample can
increase the likelihood of accurately representing the data as a
whole, even though the increased size of the sample may impede
ease of manipulation and interpretation.
5. Sampling Error
• Sampling error is the deviation between the estimate of an ideal
sample and the true population.
• The core assumption of data sampling is that samples are a
subset of the population, and the sample mean is equal to the
mean of the population.
• To the degree that doesn’t happen is the term Sampling Error
• We can reduce sampling error by following sampling best
practices, like having a large enough sample size, choosing the
right kind of sampling to do, and avoiding sampling bias.
6. Data Sampling Methods
When taking a sample from a larger population you must
make sure that the samples are an appropriate size and
without bias.
There are two types of sampling
• Probability sampling
• Non-probability sampling
7. Probability Sampling:
Every element in the sample population has an equal chance of
being selected. A sampling method is biased if every member of
the population doesn’t have equal likelihood of being in the
sample.
Different types of probability sampling
• Simple random sampling
• Stratified sampling
• Systematic sampling
• Cluster sampling
8. Simple random sampling:
• It is a method of sampling in which every element of the
universe has equal probability of being chosen. For example,
choose an individual from a lottery. The advantage of this
method is free from personal bias, and the universe gets fairly
represented by samples.
9. Stratified sampling:
• The population is broken down into non-overlapping groups. In other
words, strata (elements within the subgroups are homogenous or
heterogeneous). Then random samples are taken from each strata, so
that entire population gets represented. The advantage of this method is
it covers all the elements of the population. But there is a possibility of
bias at the time of classification of population.
10. Systematic sampling:
• Samples are selected from the population according to a pre
determined rule. In other words, every nth element selected from
the population as a sample. Arrange all the elements in a
sequence and then select the samples from the population at
regular intervals.
11. Cluster sampling:
• The population is broken down into many different clusters, and
then clusters or subgroups are randomly selected. For example,
clusters are of different ages, sex, locations etc.
12. Different types of non-probability
sampling
• Purposive sampling
• Convenience sampling
• Quota sampling
• Snowball/referral sampling
13. Purposive sampling:
• Purposive sampling is also
known as judgment sampling.
Samples are selected based on
the purpose or intention of
research. The method is flexible
to allow the inclusion of those
items in the sample which are
of special significance.
14. Convenience sampling:
• Convenience sampling is
one of the easiest
sampling methods.
Samples selection is
based on availability and
selecting the samples that
are convenient to the
researcher.
15. Quota sampling:
• It is one type of stratified
sampling, where samples
are collected in each
subgroup until the desired
quota is met. The
proportion of this sample
does not match the
proportion of the group to
the population.
16. Snowball/referral sampling:
• Snowball sampling or referral
sampling is the method famous in
medical and social science surveys
where the population is unknown
and difficult to get the sample. Hence
researchers will take help from the
existing elements to refer the others
as samples who can fit in the
population. Since it is based on
referrals, there is a chance of bias.
17. Kinds of Sampling Bias
Sampling bias is a bias in which samples are collected in such a
way that some elements of the intended population have less or
more sampling probability than the others.
Following are the different types of sampling bias
• Response Bias: A response or data bias is a systematic bias that
occurs during data collection that influences the response.
18. • Voluntary response Bias: Occurs when individuals can chose to
participate.
• Non response Bias: Non response bias occurs when units
selected as part of the sampling procedure do not respond in
whole or part.
• Convenience Bias: When sample is taken from individuals that
are conveniently available.