Download to read offline

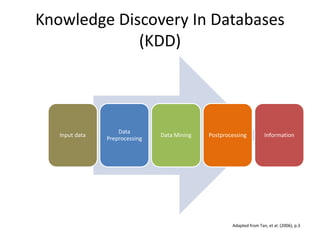
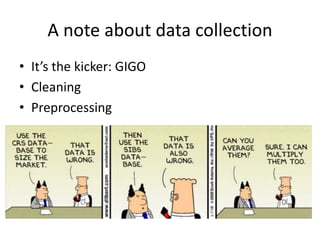
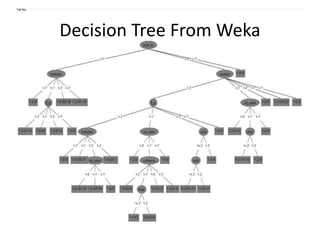
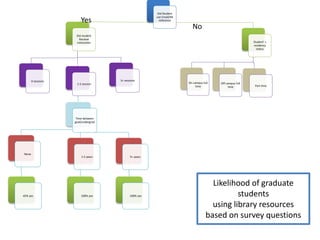
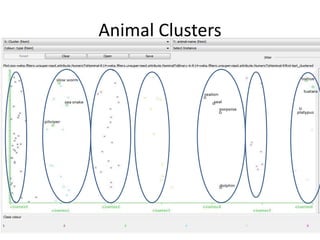
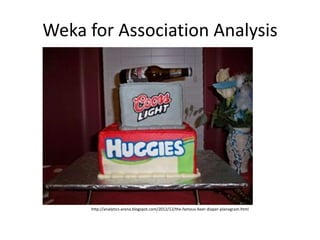
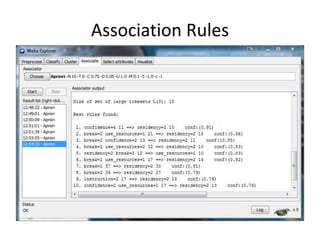
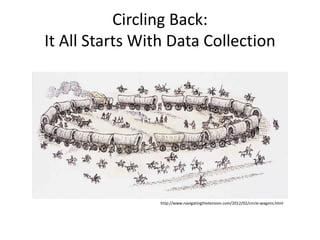

The document discusses the possibilities of data mining for libraries, highlighting the process of knowledge discovery in databases and tools like Weka for prediction, classification, and association analysis. It emphasizes the importance of data collection and preprocessing for effective data mining. Resources and tutorials related to data mining and the use of Weka are also provided.