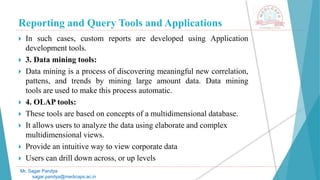
SlideShare a Scribd company logo
1 of 86
MEDI-CAPS UNIVERSITY
Faculty of Engineering
Mr. Sagar Pandya
Information Technology Department
sagar.pandya@medicaps.ac.in
Data Mining and Warehousing
Mr. Sagar Pandya
Information Technology Department
sagar.pandya@medicaps.ac.in
Course Code Course Name Hours Per Week Total
Credits
L T P
IT3ED02 Data Mining and Warehousing 3 0 0 3
IT3ED02 Data Mining and Warehousing 3-0-0
Mr. Sagar Pandya
sagar.pandya@medicaps.ac.in
 Unit 1. Introduction
 Unit 2. Data Mining
 Unit 3. Association and Classification
 Unit 4. Clustering
 Unit 5. Business Analysis
Reference Books
Text Books
 Han, Kamber and Pi, Data Mining Concepts & Techniques, Morgan Kaufmann,
India, 2012.
 Mohammed Zaki and Wagner Meira Jr., Data Mining and Analysis:
Fundamental Concepts and Algorithms, Cambridge University Press.
 Z. Markov, Daniel T. Larose Data Mining the Web, Jhon wiley & son, USA.
Reference Books
 Sam Anahory and Dennis Murray, Data Warehousing in the Real World,
Pearson Education Asia.
 W. H. Inmon, Building the Data Warehouse, 4th Ed Wiley India.
and many others
Mr. Sagar Pandya
sagar.pandya@medicaps.ac.in
Unit-5 Business Analysis
 Reporting and Query Tools and Application-
 Tool Categories-
 Need for Applications-SAS,KNIME, ORANGE, ETL,
 Data Quality,
 OLAP,
 Dimensional Modelling, Multidimensional Model,
 Multidimensional vs Multirelational
 OLAP, OLAP Tools
Mr. Sagar Pandya
sagar.pandya@medicaps.ac.in
Reporting and Query Tools and Applications
Mr. Sagar Pandya
sagar.pandya@medicaps.ac.in
• A querying and reporting tool helps you run regular reports, create
organized listings, and perform cross-tabular reporting and querying.
 Query Tools
 One of the primary objects of data warehousing is to provide
information to businesses to make strategic decisions.
 Query tools allow users to interact with the data warehouse system.
 These tools fall into four different categories:
1. Query and reporting tools
2. Application Development tools
3. Data mining tools
4. OLAP tools
Reporting and Query Tools and Applications
Mr. Sagar Pandya
sagar.pandya@medicaps.ac.in
 1. Query and reporting tools:
 Query and reporting tools can be further divided into
• Reporting tools
• Managed query tools
 Reporting tools:
 Reporting tools can be further divided into production reporting tools
and desktop report writer.
1. Report writers: This kind of reporting tool are tools designed for end-
users for their analysis.
2. Production reporting: This kind of tools allows organizations to
generate regular operational reports.
3. It also supports high volume batch jobs like printing and calculating.
Reporting and Query Tools and Applications
Mr. Sagar Pandya
sagar.pandya@medicaps.ac.in
 Some popular reporting tools are Brio, Business Objects, Oracle,
PowerSoft, SAS Institute.
 Managed query tools:
 Managed query tools shield end user from the Complexities of SQL
and database structure by inserting a meta layer between user and the
database.
 Meta layer :Software that provides subject oriented views of a
database and supports point and click creation of SQL
 2. Application development tools:
 First deployed on main frame system.
 Sometimes built-in graphical and analytical tools do not satisfy the
analytical needs of an organization.
Reporting and Query Tools and Applications
Mr. Sagar Pandya
sagar.pandya@medicaps.ac.in
 In such cases, custom reports are developed using Application
development tools.
 3. Data mining tools:
 Data mining is a process of discovering meaningful new correlation,
pattens, and trends by mining large amount data. Data mining
tools are used to make this process automatic.
 4. OLAP tools:
 These tools are based on concepts of a multidimensional database.
 It allows users to analyze the data using elaborate and complex
multidimensional views.
 Provide an intuitive way to view corporate data
 Users can drill down across, or up levels
Reporting and Query Tools and Applications
Mr. Sagar Pandya
sagar.pandya@medicaps.ac.in
• A querying and reporting tool helps you run regular reports, create
organized listings, and perform cross-tabular reporting and querying.
Basic query and reporting “Tell me what happened.”
Business analysis (OLAP) “Tell me what happened
and why.”
Data mining “Tell me what may happen”
or “Tell me something
interesting.”
Dashboards and
scorecards
“Tell me how I’m doing
currently and against my
plan.”
Reporting and Query Tools and Applications
Mr. Sagar Pandya
sagar.pandya@medicaps.ac.in
 Need For Applications:
 Some tools and apps can format the retrieved data into easy-to-read
reports, while others concentrate on the on-screen presentation As the
complexity of questions grows this tools may rapidly become Inefficient.
 Consider various access types to the data stored in a data warehouse
 Simple tabular form reporting
 Ad hoc user specified queries
 Predefined repeatable queries
 Complex queries with multi table joins ,multilevel subqueries, and
sophisticated search criteria.
 Ranking
 Multivariable analysis
Reporting and Query Tools and Applications
Mr. Sagar Pandya
sagar.pandya@medicaps.ac.in
 Time series analysis, Complex textual search
 Data visualization, graphing, charting and pivoting
 Interactive Drill down reporting an analysis
 AI techniques for testing of hypothesis
 Information Mapping, Statistical analysis
 Interactive drill-down reporting and analysis
 The first four types of access are covered by the combine category of tools
we will call query and reporting tools.
 There are three types of reporting
 Creation and viewing of standard reports
 Definition and creation of ad hoc reports
 Data exploration
Reporting and Query Tools and Applications
Mr. Sagar Pandya
sagar.pandya@medicaps.ac.in
 Cognos Impromptu
 What is impromptu?
 Impromptu is an interactive database reporting tool.
 It allows Power Users to query data without programming
knowledge.
 It is only capable of reading the data.
 Impromptu’s main features includes,
 Interactive reporting capability
 Enterprise-wide scalability
 Superior user interface
 Fastest time to result
 Lowest cost of ownership
Reporting and Query Tools and Applications
Mr. Sagar Pandya
sagar.pandya@medicaps.ac.in
 IBM Cognos Business Intelligence is a web based reporting and
analytic tool.
 It is used to perform data aggregation and create user friendly
detailed reports.
 Reports can contain Graphs, Multiple Pages, Different Tabs and
Interactive Prompts.
 These reports can be viewed on web browsers, or on hand held
devices like tablets and smartphones.
 Cognos also provides you an option to export the report in XML or
PDF format or you can view the reports in XML format.
 You can also schedule the report to run in the background at specific
time period so it saves the time to view the daily report as you don’t
need to run the report every time.
Reporting and Query Tools and Applications
Mr. Sagar Pandya
sagar.pandya@medicaps.ac.in
 IBM Cognos provides a wide range of features and can be
considered as an enterprise software to provide flexible reporting
environment and can be used for large and medium enterprises.
 It meets the need of Power Users, Analysts, Business Managers and
Company Executives.
 Power users and analysts want to create adhoc reports and can create
multiple views of the same data.
 Business Executives want to see summarize data in dashboard styles,
cross tabs and visualizations.
 Cognos BI reporting allows you to bring the data from multiple
databases into a single set of reports.
 IBM Cognos provides wide range of features as compared to other
BI tools in the market.
OLAP
Mr. Sagar Pandya
sagar.pandya@medicaps.ac.in
 OLAP stands for Online Analytical Processing.
 OLAP (Online Analytical Processing) is the technology behind
many Business Intelligence (BI) applications.
 OLAP is a powerful technology for data discovery, including
capabilities for limitless report viewing, complex analytical
calculations, and predictive “what if” scenario (budget, forecast)
planning.
 It uses database tables (fact and dimension tables) to enable
multidimensional viewing, analysis and querying of large amounts of
data.
 E.g. OLAP technology could provide management with fast answers
to complex queries on their operational data or enable them to
analyze their company’s historical data for trends and patterns.
OLAP
Mr. Sagar Pandya
sagar.pandya@medicaps.ac.in
 Online Analytical Processing (OLAP) applications and tools are
those that are designed to ask ―complex queries of large
multidimensional collections of data.
 How is OLAP Technology Used?
 OLAP is an acronym for Online Analytical Processing. OLAP
performs multidimensional analysis of business data and provides the
capability for complex calculations, trend analysis, and sophisticated
data modeling.
 It is the foundation for many kinds of business applications for
Business Performance Management, Planning, Budgeting,
Forecasting, Financial Reporting, Analysis, Simulation Models,
Knowledge Discovery, and Data Warehouse Reporting.
OLAP
Mr. Sagar Pandya
sagar.pandya@medicaps.ac.in
 Unlike relational databases, OLAP tools do not store individual
transaction records in two-dimensional, row-by-column format, like
a worksheet, but instead use multidimensional database structures—
known as Cubes in OLAP terminology—to store arrays of
consolidated information.
 The data and formulas are stored in an optimized multidimensional
database, while views of the data are created on demand.
 OLAP technology implementations depend not only on the type of
software, but also on underlying data sources and the intended
business objective(s).
 Each industry or business area is specific and requires some degree
of customized modeling to create multidimensional “cubes” for data
loading and reporting building, at minimum.
OLAP CUBE
Mr. Sagar Pandya
sagar.pandya@medicaps.ac.in
 At the core of the OLAP concept, is an OLAP Cube. The OLAP cube
is a data structure optimized for very quick data analysis.
 The OLAP Cube consists of numeric facts called measures which are
categorized by dimensions. OLAP Cube is also called the hypercube.
OLAP CUBE
Mr. Sagar Pandya
sagar.pandya@medicaps.ac.in
 Usually, data operations and analysis are performed using the simple
spreadsheet, where data values are arranged in row and column
format. This is ideal for two-dimensional data.
 However, OLAP contains multidimensional data, with data usually
obtained from a different and unrelated source.
 Using a spreadsheet is not an optimal option.
 The cube can store and analyze multidimensional data in a logical
and orderly manner.
 OLAP cubes have two main purposes. The first is to provide
business users with a data model more intuitive to them than a
tabular model. This model is called a Dimensional Model.
 The second purpose is to enable fast query response that is usually
difficult to achieve using tabular models.
OLAP CUBE
Mr. Sagar Pandya
sagar.pandya@medicaps.ac.in
 How does it work?
 A Data warehouse would extract information from multiple data
sources and formats like text files, excel sheet, multimedia files, etc.
 The extracted data is cleaned and transformed. Data is loaded into an
OLAP server (or OLAP cube) where information is pre-calculated in
advance for further analysis.
 Fundamentally, OLAP has a very simple concept.
 It pre-calculates most of the queries that are typically very hard to
execute over tabular databases, namely aggregation, joining, and
grouping.
 These queries are calculated during a process that is usually called
'building' or 'processing' of the OLAP cube.
Basic analytical operations of OLAP
Mr. Sagar Pandya
sagar.pandya@medicaps.ac.in
 Four types of analytical operations in OLAP are:
 Roll-up
 Drill-down
 Slice and dice
 Pivot (rotate)
 1) Roll-up:
 Roll-up is also known as "consolidation" or "aggregation."
 The Roll-up operation can be performed in 2 ways:
 Reducing dimensions
 Climbing up concept hierarchy. Concept hierarchy is a system of
grouping things based on their order or level.
 Consider the following diagram
Basic analytical operations of OLAP
Mr. Sagar Pandya
sagar.pandya@medicaps.ac.in
Basic analytical operations of OLAP
Mr. Sagar Pandya
sagar.pandya@medicaps.ac.in
 In this example, cities New jersey and Lost Angles and rolled up into
country USA
 The sales figure of New Jersey and Los Angeles are 440 and 1560
respectively. They become 2000 after roll-up
 In this aggregation process, data is location hierarchy moves up from
city to the country.
 In the roll-up process at least one or more dimensions need to be
removed. In this example, Quarter dimension is removed.
 2) Drill-down
 In drill-down data is fragmented into smaller parts. It is the opposite
of the rollup process. It can be done via, Moving down the concept
hierarchy or Increasing a dimension.
Basic analytical operations of OLAP
Mr. Sagar Pandya
sagar.pandya@medicaps.ac.in
Basic analytical operations of OLAP
Mr. Sagar Pandya
sagar.pandya@medicaps.ac.in
 Quarter Q1 is drilled down to months January, February, and March.
Corresponding sales are also registers.
 In this example, dimension months are added.
 3) Slice:
 Here, one dimension is selected, and a new sub-cube is created.
 Dimension Time is Sliced with Q1 as the filter.
 A new cube is created altogether.
Basic analytical operations of OLAP
Mr. Sagar Pandya
sagar.pandya@medicaps.ac.in
Basic analytical operations of OLAP
Mr. Sagar Pandya
sagar.pandya@medicaps.ac.in
 Dice:
 This operation is similar to a slice. The difference in dice is you
select 2 or more dimensions that result in the creation of a sub-cube.
Basic analytical operations of OLAP
Mr. Sagar Pandya
sagar.pandya@medicaps.ac.in
Basic analytical operations of OLAP
Mr. Sagar Pandya
sagar.pandya@medicaps.ac.in
 4) Pivot
 In Pivot, you rotate the data axes to provide a substitute presentation
of data.
 In the following example, the pivot is based on item types.
Basic analytical operations of OLAP
Mr. Sagar Pandya
sagar.pandya@medicaps.ac.in
OLAP
Mr. Sagar Pandya
sagar.pandya@medicaps.ac.in
 The main characteristics of OLAP are as follows:
 Multidimensional conceptual view: OLAP systems let business
users have a dimensional and logical view of the data in the data
warehouse. It helps in carrying slice and dice operations.
 Multi-User Support: Since the OLAP techniques are shared, the
OLAP operation should provide normal database operations,
containing retrieval, update, adequacy control, integrity, and security.
 Accessibility: OLAP acts as a mediator between data warehouses
and front-end. The OLAP operations should be sitting between data
sources (e.g., data warehouses) and an OLAP front-end.
 Storing OLAP results: OLAP results are kept separate from data
sources.
OLAP
Mr. Sagar Pandya
sagar.pandya@medicaps.ac.in
 OLAP provides for distinguishing between zero values and missing
values so that aggregates are computed correctly.
 OLAP system should ignore all missing values and compute correct
aggregate values.
 OLAP facilitate interactive query and complex analysis for the users.
 OLAP allows users to drill down for greater details or roll up for
aggregations of metrics along a single business dimension or across
multiple dimension.
 OLAP provides the ability to perform intricate calculations and
comparisons.
 OLAP presents results in a number of meaningful ways, including
charts and graphs.
OLAP
Mr. Sagar Pandya
sagar.pandya@medicaps.ac.in
 Advantages of OLAP
 OLAP is a platform for all type of business includes planning,
budgeting, reporting, and analysis.
 Information and calculations are consistent in an OLAP cube. This is
a crucial benefit.
 Quickly create and analyze "What if" scenarios
 Easily search OLAP database for broad or specific terms.
 OLAP provides the building blocks for business modeling tools,
Data mining tools, performance reporting tools.
 Allows users to do slice and dice cube data all by various
dimensions, measures, and filters.
OLAP
Mr. Sagar Pandya
sagar.pandya@medicaps.ac.in
 It is good for analyzing time series.
 Finding some clusters and outliers is easy with OLAP.
 It is a powerful visualization online analytical process system which
provides faster response times.
 Disadvantages of OLAP
 OLAP requires organizing data into a star or snowflake schema.
These schemas are complicated to implement and administer.
 You cannot have large number of dimensions in a single OLAP cube.
 Transactional data cannot be accessed with OLAP system.
 Any modification in an OLAP cube needs a full update of the cube.
This is a time-consuming process
OLAP
Mr. Sagar Pandya
sagar.pandya@medicaps.ac.in
 Types of OLAP systems
 OLAP Hierarchical Structure
ROLAP
Mr. Sagar Pandya
sagar.pandya@medicaps.ac.in
 ROLAP works with data that exist in a relational database.
 Facts and dimension tables are stored as relational tables.
 It also allows multidimensional analysis of data and is the fastest
growing OLAP.
 This methodology relies on manipulating the data stored in the
relational database to give the appearance of traditional OLAP’s
slicing and dicing functionality.
 In essence, each action of slicing and dicing is equivalent to adding a
―WHERE clause in the SQL statement. Data stored in relational
tables.
 Relational OLAP servers are placed between relational back-end
server and client front-end tools.
ROLAP
Mr. Sagar Pandya
sagar.pandya@medicaps.ac.in
 To store and manage the warehouse data, the relational OLAP uses
relational or extended-relational DBMS.
 ROLAP includes the following −
• Implementation of aggregation navigation logic
• Optimization for each DBMS back-end
• Additional tools and services
 Points to Remember
• ROLAP servers are highly scalable.
• ROLAP tools analyze large volumes of data across multiple
dimensions.
• ROLAP tools store and analyze highly volatile and changeable data.
ROLAP
Mr. Sagar Pandya
sagar.pandya@medicaps.ac.in
 Relational OLAP Architecture
 ROLAP Architecture includes the following components
• Database server.
• ROLAP server.
• Front-end tool.
 Relational OLAP (ROLAP) is the latest and fastest-growing OLAP
technology segment in the market.
 This method allows multiple multidimensional views of two-
dimensional relational tables to be created, avoiding structuring
record around the desired view.
 Some products in this segment have supported reliable SQL engines
to help the complexity of multidimensional analysis.
ROLAP
Mr. Sagar Pandya
sagar.pandya@medicaps.ac.in
ROLAP
Mr. Sagar Pandya
sagar.pandya@medicaps.ac.in
 Advantages of ROLAP model:
1. High data efficiency. It offers high data efficiency because query performance
and access language are optimized particularly for the multidimensional data
analysis.
2. Scalability. This type of OLAP system offers scalability for managing large
volumes of data, and even when the data is steadily increasing.
 Drawbacks of ROLAP model:
1. Demand for higher resources: ROLAP needs high utilization of manpower,
software, and hardware resources.
2. Aggregately data limitations. ROLAP tools use SQL for all calculation of
aggregate data. However, there are no set limits to the for handling computations.
3. Slow query performance. Query performance in this model is slow when
compared with MOLAP
MOLAP
Mr. Sagar Pandya
sagar.pandya@medicaps.ac.in
 Multidimensional OLAP
 MOLAP uses array-based multidimensional storage engines to
display multidimensional views of data. Basically, they use an OLAP
cube.
 This is the more traditional way of OLAP analysis.
 In MOLAP, data is stored in a multidimensional cube.
 The storage is not in the relational database, but in proprietary
formats. That is, data stored in array-based structures.
 MOLAP is used for limited data volumes and in this data is stored in
multidimensional array.
 In MOLAP, Dynamic multidimensional view of data is created.
MOLAP
Mr. Sagar Pandya
sagar.pandya@medicaps.ac.in
 Points to Remember −
 In MOLAP, operations are called processing.
• MOLAP tools process information with consistent response time
regardless of level of summarizing or calculations selected.
• MOLAP tools need to avoid many of the complexities of creating a
relational database to store data for analysis.
• MOLAP tools need fastest possible performance.
• MOLAP server adopts two level of storage representation to handle
dense and sparse data sets.
• Denser sub-cubes are identified and stored as array structure.
• Sparse sub-cubes employ compression technology.
MOLAP
Mr. Sagar Pandya
sagar.pandya@medicaps.ac.in
MOLAP
Mr. Sagar Pandya
sagar.pandya@medicaps.ac.in
 MOLAP Architecture
 MOLAP Architecture includes the following components
• Database server.
• MOLAP server.
• Front-end tool.
 MOLAP structure primarily reads the precompiled data. MOLAP
structure has limited capabilities to dynamically create aggregations
or to evaluate results which have not been pre-calculated and stored.
 The main difference between ROLAP and MOLAP is that, In
ROLAP, Data is fetched from data-warehouse. On the other hand, in
MOLAP, Data is fetched from MDDBs database. The common term
between these two is OLAP.
MOLAP
Mr. Sagar Pandya
sagar.pandya@medicaps.ac.in
 Advantages:
 Excellent performance: MOLAP cubes are built for fast data
retrieval, and are optimal for slicing and dicing operations.
 Can perform complex calculations: All calculations have been pre-
generated when the cube is created. Hence, complex calculations are
not only doable, but they return quickly.
 Disadvantages:
 Limited in the amount of data it can handle: Because all calculations
are performed when the cube is built, it is not possible to include a
large amount of data in the cube itself.
 This is not to say that the data in the cube cannot be derived from a
large amount of data. Indeed, this is possible. But in this case, only
summary-level information will be included in the cube itself.
MOLAP
Mr. Sagar Pandya
sagar.pandya@medicaps.ac.in
 Requires additional investment: Cube technology are often
proprietary and do not already exist in the organization.
 Therefore, to adopt MOLAP technology, chances are additional
investments in human and capital resources are needed.
 MOLAP are not capable of containing detailed data.
 The storage utilization may be low if the data set is sparse.
 MOLAP Solutions may be lengthy, particularly on large data
volumes.
 MOLAP products may face issues while updating and querying
models when dimensions are more than ten.
 MOLAP is not capable of containing detailed data.
 The storage utilization can be low if the data set is highly scattered.
MOLAP
Mr. Sagar Pandya
sagar.pandya@medicaps.ac.in
 MOLAP Tools
• Essbase - Tools from Oracle that has a multidimensional database.
• Express Server - Web-based environment that runs on Oracle
database.
• Yellowfin - Business analytics tools for creating reports and
dashboards.
• Clear Analytics - Clear analytics is an Excel-based business solution.
• SAP Business Intelligence - Business analytics solutions from SAP
ROLAP vs MOLAP
Mr. Sagar Pandya
sagar.pandya@medicaps.ac.in
S. No. ROLAP MOLAP
1.
ROLAP stands
for Relational Online
Analytical Processing.
While MOLAP stands
for Multidimensional Online
Analytical Processing.
2.
ROLAP is used for large
data volumes.
While it is used for limited data
volumes.
3.
The access of ROLAP is
slow.
While the access of MOLAP is
fast.
4.
In ROLAP, Data is stored in
relation tables.
While in MOLAP, Data is
stored in multidimensional
array.
ROLAP vs MOLAP
Mr. Sagar Pandya
sagar.pandya@medicaps.ac.in
S. No. ROLAP MOLAP
5.
In ROLAP, Data is fetched
from data-warehouse.
While in MOLAP, Data is
fetched from MDDBs
database.
6.
In ROLAP, Complicated
SQL queries are used.
While in MOLAP, Sparse
matrix is used.
7.
In ROLAP, Static
multidimensional view of
data is created.
While in MOLAP, Dynamic
multidimensional view of data
is created.
8.
MOLAP is best suited for
inexperienced users, since it
is very easy to use.
ROLAP is best suited for
experienced users.
HOLAP
Mr. Sagar Pandya
sagar.pandya@medicaps.ac.in
 Hybrid OLAP is a mixture of both ROLAP and MOLAP.
 It offers fast computation of MOLAP and higher scalability of
ROLAP. HOLAP uses two databases.
1. Aggregated or computed data is stored in a multidimensional OLAP
cube
2. Detailed information is stored in a relational database.
 HOLAP technologies attempt to combine the advantages of MOLAP
and ROLAP. For summary type information, HOLAP leverages cube
technology for faster performance.
 HOLAP also can drill through from the cube down to the relational
tables for delineated data.
 The Microsoft SQL Server 2000 provides a hybrid OLAP server.
HOLAP
Mr. Sagar Pandya
sagar.pandya@medicaps.ac.in
 Benefits of Hybrid OLAP:
 HOLAP provide benefits of both MOLAP and ROLAP.
 This kind of OLAP helps to economize the disk space, and it also
remains compact which helps to avoid issues related to access speed
and convenience.
 Hybrid HOLAP's uses cube technology which allows faster
performance for all types of data.
 ROLAP are instantly updated and HOLAP users have access to this
real-time instantly updated data.
 MOLAP brings cleaning and conversion of data thereby improving
data relevance. This brings best of both worlds.
HOLAP
Mr. Sagar Pandya
sagar.pandya@medicaps.ac.in
 Drawbacks of Hybrid OLAP:
 Greater complexity level: The major drawback in HOLAP systems is
that it supports both ROLAP and MOLAP tools and applications.
Thus, it is very complicated.
 Potential overlaps: There are higher chances of overlapping
especially into their functionalities.
Other types of OLAP
Mr. Sagar Pandya
sagar.pandya@medicaps.ac.in
 Desktop OLAP (DOLAP):
 In Desktop OLAP, a user downloads a part of the data from the database locally,
or on their desktop and analyze it. DOLAP is relatively cheaper to deploy as it
offers very few functionalities compares to other OLAP systems.
 Web OLAP (WOLAP):
 Web OLAP which is OLAP system accessible via the web browser. WOLAP is
a three-tiered architecture. It consists of three components: client, middleware,
and a database server.
 Mobile OLAP (MOLAP): Mobile OLAP helps users to access and analyze
OLAP data using their mobile devices.
 Spatial OLAP (SOLAP): SOLAP is created to facilitate management of both
spatial and non-spatial data in a Geographic Information system (GIS)
Dimensional Modelling
Mr. Sagar Pandya
sagar.pandya@medicaps.ac.in
 Dimensional modeling represents data with a cube operation, making
more suitable logical data representation with OLAP data management.
 The perception of Dimensional Modeling was developed by Ralph
Kimball and is consist of "fact" and "dimension" tables.
 In dimensional modeling, the transaction record is divided into either
"facts," which are frequently numerical transaction data, or
"dimensions," which are the reference information that gives context to
the facts.
 For example, a sale transaction can be damage into facts such as the
number of products ordered and the price paid for the products, and
into dimensions such as order date, user name, product number, order
ship-to, and bill-to locations, and salesman responsible for receiving
the order.
Dimensional Modelling
Mr. Sagar Pandya
sagar.pandya@medicaps.ac.in
 Dimensional Modeling (DM) is a data structure technique optimized
for data storage in a Data warehouse.
 The advantage of using this model is that we can store data in such a
way that it is easier to store and retrieve the data once stored in a data
warehouse.
 Dimensional model is the data model used by many OLAP systems.
 Objectives of Dimensional Modeling
 The purposes of dimensional modeling are:
1. To produce database architecture that is easy for end-clients to
understand and write queries.
2. To maximize the efficiency of queries. It achieves these goals by
minimizing the number of tables and relationships between them.
Dimensional Modelling
Mr. Sagar Pandya
sagar.pandya@medicaps.ac.in
 Elements of Dimensional Modeling:
 Fact
 It is a collection of associated data items, consisting of measures and
context data. It typically represents business items or business
transactions.
 Dimensions
 It is a collection of data which describe one business dimension.
Dimensions decide the contextual background for the facts, and they
are the framework over which OLAP is performed.
 Measure
 It is a numeric attribute of a fact, representing the performance or
behavior of the business relative to the dimensions.
Dimensional Modelling
Mr. Sagar Pandya
sagar.pandya@medicaps.ac.in
Dimensional Modelling
Mr. Sagar Pandya
sagar.pandya@medicaps.ac.in
 Steps to Create Dimensional Data Modeling:
 Step-1: Identifying the business objective –
 The first step is to identify the business objective. Sales, HR,
Marketing, etc. are some examples as per the need of the
organization.
 Since it is the most important step of Data Modelling the selection of
business objective also depends on the quality of data available for
that process.
 Step-2: Identifying Granularity –
 Granularity is the lowest level of information stored in the table. The
level of detail for business problem and its solution is described by
Grain.
Dimensional Modelling
Mr. Sagar Pandya
sagar.pandya@medicaps.ac.in
 During this stage, you answer questions like
 Do we need to store all the available products or just a few types of
products? This decision is based on the business processes selected
for Data warehouse.
 Do we store the product sale information on a monthly, weekly, daily
or hourly basis? This decision depends on the nature of reports
requested by executives.
 How do the above two choices affect the database size?
 Example of Grain:
 The CEO at an MNC wants to find the sales for specific products in
different locations on a daily basis.
 So, the grain is "product sale information by location by the day."
Dimensional Modelling
Mr. Sagar Pandya
sagar.pandya@medicaps.ac.in
 Step-3: Identifying Dimensions and its Attributes –
 Dimensions are objects or things.
 Dimensions are nouns like date, store, inventory, etc. These
dimensions are where all the data should be stored.
 For example, the date dimension may contain data like a year, month
and weekday.
 Dimensions categorize and describe data warehouse facts and
measures in a way that support meaningful answers to business
questions.
 A data warehouse organizes descriptive attributes as columns in
dimension tables. For Example, the data dimension may contain data
like a year, month and weekday.
Dimensional Modelling
Mr. Sagar Pandya
sagar.pandya@medicaps.ac.in
 Example of Dimensions:
 The CEO at an MNC wants to find the sales for specific products in
different locations on a daily basis.
 Dimensions: Product, Location and Time
 Attributes: For Product: Product key (Foreign Key), Name, Type,
Specifications
 Hierarchies: For Location: Country, State, City, Street Address,
Name
 Step-4: Identifying the Fact –
 The measurable data is hold by the fact table. Most of the fact table
rows are numerical values like price or cost per unit, etc.
Dimensional Modelling
Mr. Sagar Pandya
sagar.pandya@medicaps.ac.in
 Example of Facts:
 The CEO at an MNC wants to find the sales for specific products in
different locations on a daily basis.
 The fact here is Sum of Sales by product by location by time.
 Step 5) Build Schema
 In this step, you implement the Dimension Model. A schema is
nothing but the database structure (arrangement of tables). There are
two popular schemas:
 Star Schema
 The star schema architecture is easy to design. It is called a star
schema because diagram resembles a star, with points radiating from
a center.
Dimensional Modelling
Mr. Sagar Pandya
sagar.pandya@medicaps.ac.in
 The center of the star consists of the fact table, and the points of the
star is dimension tables.
 The fact tables in a star schema which is third normal form whereas
dimensional tables are de-normalized.
 Snowflake Schema
 The snowflake schema is an extension of the star schema. In a
snowflake schema, each dimension are normalized and connected to
more dimension tables.
Dimensional Modelling
Mr. Sagar Pandya
sagar.pandya@medicaps.ac.in
 Rules for Dimensional Modelling: Following are the rules and
principles of Dimensional Modeling:
• Load atomic data into dimensional structures.
• Build dimensional models around business processes.
• Ensure that all facts in a single fact table are at the same grain or
level of detail.
• It's essential to store report labels and filter domain values in
dimension tables
• Need to ensure that dimension tables use a surrogate key
• Need to ensure that every fact table has associated dimension table.
• Continuously balance requirements and realities to deliver business
solution to support their decision-making
Dimensional Modelling
Mr. Sagar Pandya
sagar.pandya@medicaps.ac.in
 Benefits of Dimensional Modeling
 Standardization of dimensions allows easy reporting across areas of the
business.
 Dimension tables store the history of the dimensional information.
 It allows to introduce entirely new dimension without major disruptions to
the fact table.
 Dimensional also to store data in such a fashion that it is easier to retrieve
the information from the data once the data is stored in the database.
 Compared to the normalized model dimensional table are easier to
understand.
 Information is grouped into clear and simple business categories.
 The dimensional model also helps to boost query performance.
Dimensional Modelling
Mr. Sagar Pandya
sagar.pandya@medicaps.ac.in
 The dimensional model is very understandable by the business. This model is
based on business terms, so that the business knows what each fact, dimension,
or attribute means.
 It is more denormalized therefore it is optimized for querying. Dimensional
models are deformalized and optimized for fast data querying. Many relational
database platforms recognize this model and optimize query execution plans to
aid in performance.
 Dimensional modelling in data warehouse creates a schema which is optimized
for high performance. It means fewer joins and helps with minimized data
redundancy.
 Dimensional models can comfortably accommodate change. Dimension tables
can have more columns added to them without affecting existing business
intelligence applications using these tables.
Multi-dimensional Model
Mr. Sagar Pandya
sagar.pandya@medicaps.ac.in
 A multidimensional model views data in the form of a data-cube.
 Mostly, data warehousing supports two or three-dimensional cubes.
 A data cube enables data to be modeled and viewed in multiple
dimensions. It is defined by dimensions and facts.
 A data cube allows data to be viewed in multiple dimensions.
 A dimensions are entities with respect to which an organization
wants to keep records.
 For example in store sales record, dimensions allow the store to keep
track of things like monthly sales of items and the branches and
locations.
 A multidimensional databases helps to provide data-related answers
to complex business queries quickly and accurately.
Multi-dimensional Model
Mr. Sagar Pandya
sagar.pandya@medicaps.ac.in
 Data warehouses and Online Analytical Processing (OLAP) tools are
based on a multidimensional data model.
 OLAP in data warehousing enables users to view data from different
angles and dimensions.
 A multidimensional data model is organized around a central theme,
for example, sales.
 This theme is represented by a fact table.
 Facts are numerical measures.
 The fact table contains the names of the facts or measures of the
related dimensional tables.
 Consider the data of a shop for items sold per quarter in the city of
Delhi. The data is shown in the table.
Multi-dimensional Model
Mr. Sagar Pandya
sagar.pandya@medicaps.ac.in
 In this 2D representation, the sales for Delhi are shown for the time
dimension (organized in quarters) and the item dimension (classified
according to the types of an item sold). The fact or measure displayed in
rupee_sold (in thousands).
Multi-dimensional Model
Mr. Sagar Pandya
sagar.pandya@medicaps.ac.in
 Now, if we want to view the sales data with a third dimension, For example,
suppose the data according to time and item, as well as the location is
considered for the cities Chennai, Kolkata, Mumbai, and Delhi.
 These 3D data are shown in the table. The 3D data of the table are
represented as a series of 2D tables.
Multi-dimensional Model
Mr. Sagar Pandya
sagar.pandya@medicaps.ac.in
Multi-dimensional Model
Mr. Sagar Pandya
sagar.pandya@medicaps.ac.in
 Conceptually, it may also be represented by the same data in the form of a
3D data cube, as shown in fig:
Data Cube
 When data is grouped or combined in multidimensional matrices
called Data Cubes. The data cube method has a few alternative
names or a few variants, such as "Multidimensional databases,"
"materialized views," and "OLAP (On-Line Analytical Processing)."
, Medi-Caps University, Indore
Data Cube
 Example: In the 2-D representation, we will look at the All
Electronics sales data for items sold per quarter in the city of
Vancouver. The measured display in dollars sold (in thousands).
, Medi-Caps University, Indore
Data Cube
 3-Dimensional Cuboids
 Let suppose we would like to view the sales data with a third
dimension. For example, suppose we would like to view the data
according to time, item as well as the location for the cities Chicago,
New York, Toronto, and Vancouver. The measured display in dollars
sold (in thousands). These 3-D data are shown in the table. The 3-D
data of the table are represented as a series of 2-D tables.
, Medi-Caps University, Indore
Data Cube
 Conceptually, we may represent the same data in the form of 3-D
data cubes, as shown in fig:
, Medi-Caps University, Indore
Data Cube
 Let us suppose that we would like to view our sales data with an
additional fourth dimension, such as a supplier.
 In data warehousing, the data cubes are n-dimensional.
 The cuboid which holds the lowest level of summarization is called a
base cuboid.
 For example, the 4-D cuboid in the figure is the base cuboid for the
given time, item, location, and supplier dimensions.
 Figure is shown a 4-D data cube representation of sales data,
according to the dimensions time, item, location, and supplier. The
measure displayed is dollars sold (in thousands).
, Medi-Caps University, Indore
Data Cube
, Medi-Caps University, Indore
Data Cube
, Medi-Caps University, Indore
 The topmost 0-D cuboid, which holds the highest level of
summarization, is known as the apex cuboid.
 In this example, this is the total sales, or dollars sold, summarized
over all four dimensions.
 The lattice of cuboid forms a data cube.
 The figure shows the lattice of cuboids creating 4-D data cubes for
the dimension time, item, location, and supplier.
 Each cuboid represents a different degree of summarization.
Data Cube
, Medi-Caps University, Indore
Summary
Mr. Sagar Pandya
sagar.pandya@medicaps.ac.in
• OLAP is a technology that enables analysts to extract and view
business data from different points of view.
• At the core of the OLAP concept, is an OLAP Cube.
• Various business applications and other data operations require the
use of OLAP Cube.
• There are primary five types of analytical operations in OLAP 1)
Roll-up 2) Drill-down 3) Slice 4) Dice and 5) Pivot
• Three types of widely used OLAP systems are MOLAP, ROLAP, and
Hybrid OLAP.
• Desktop OLAP, Web OLAP, and Mobile OLAP are some other types
of OLAP systems.
Summary
Mr. Sagar Pandya
sagar.pandya@medicaps.ac.in
• A dimensional model is a data structure technique optimized for Data
warehousing tools.
• Facts are the measurements/metrics or facts from your business process.
• Dimension provides the context surrounding a business process event.
• Attributes are the various characteristics of the dimension modelling.
• A fact table is a primary table in a dimensional model.
• A dimension table contains dimensions of a fact.
• There are three types of facts 1. Additive 2. Non-additive 3. Semi-
additive
• Types of Dimensions are Conformed, Outrigger, Shrunken, Role-playing,
Dimension to Dimension Table, Junk, Degenerate, Swappable and Step
Dimensions.
Summary
Mr. Sagar Pandya
sagar.pandya@medicaps.ac.in
• Five steps of Dimensional modeling are 1. Identify Business Process 2.
Identify Grain (level of detail) 3. Identify Dimensions 4. Identify Facts 5.
Build Star
• For Dimensional modelling in data warehouse, there is a need to ensure
that every fact table has an associated date dimension table.
Questions
Thank You
Great God, Medi-Caps, All the attendees
Mr. Sagar Pandya
sagar.pandya@medicaps.ac.in
www.sagarpandya.tk
LinkedIn: /in/seapandya
Twitter: @seapandya
Facebook: /seapandya

More Related Content

Similar to data mining and warehousing computer science

IRJET- Business Intelligence using Hadoop
IRJET-  	  Business Intelligence using HadoopIRJET-  	  Business Intelligence using Hadoop
IRJET- Business Intelligence using HadoopIRJET Journal
 
25 Best Data Mining Tools in 2022
25 Best Data Mining Tools in 202225 Best Data Mining Tools in 2022
25 Best Data Mining Tools in 2022Kavika Roy
 
What is Data analytics? How is data analytics a better career option?
What is Data analytics? How is data analytics a better career option?What is Data analytics? How is data analytics a better career option?
What is Data analytics? How is data analytics a better career option?Aspire Techsoft Academy
 
Big data analytics in banking sector
Big data analytics in banking sectorBig data analytics in banking sector
Big data analytics in banking sectorAnil Rana
 
IRJET- Comparative Analysis of Various Tools for Data Mining and Big Data...
IRJET-  	  Comparative Analysis of Various Tools for Data Mining and Big Data...IRJET-  	  Comparative Analysis of Various Tools for Data Mining and Big Data...
IRJET- Comparative Analysis of Various Tools for Data Mining and Big Data...IRJET Journal
 
Business analysis in data warehousing
Business analysis in data warehousingBusiness analysis in data warehousing
Business analysis in data warehousingHimanshu
 
Easy Analytics on AWS with Amazon Redshift, Amazon QuickSight, and Amazon Mac...
Easy Analytics on AWS with Amazon Redshift, Amazon QuickSight, and Amazon Mac...Easy Analytics on AWS with Amazon Redshift, Amazon QuickSight, and Amazon Mac...
Easy Analytics on AWS with Amazon Redshift, Amazon QuickSight, and Amazon Mac...Amazon Web Services
 
Case Studies: Enterprise BI vs Self-Service Analytics Tools: Real Life Consid...
Case Studies: Enterprise BI vs Self-Service Analytics Tools: Real Life Consid...Case Studies: Enterprise BI vs Self-Service Analytics Tools: Real Life Consid...
Case Studies: Enterprise BI vs Self-Service Analytics Tools: Real Life Consid...Senturus
 
Data modelling tool in CASE
Data modelling tool in CASEData modelling tool in CASE
Data modelling tool in CASEManju Pillai
 
Tools for Unstructured Data Analytics
Tools for Unstructured Data AnalyticsTools for Unstructured Data Analytics
Tools for Unstructured Data AnalyticsRavi Teja
 
March 2016 PHXTUG Meeting
March 2016 PHXTUG MeetingMarch 2016 PHXTUG Meeting
March 2016 PHXTUG MeetingMichael Perillo
 
Higher_Ed_Whitepaper
Higher_Ed_WhitepaperHigher_Ed_Whitepaper
Higher_Ed_WhitepaperMatt Brueck
 
Higher Ed_Whitepaper
Higher Ed_WhitepaperHigher Ed_Whitepaper
Higher Ed_WhitepaperCarlos Scott
 

Similar to data mining and warehousing computer science (20)

IRJET- Business Intelligence using Hadoop
IRJET-  	  Business Intelligence using HadoopIRJET-  	  Business Intelligence using Hadoop
IRJET- Business Intelligence using Hadoop
 
25 Best Data Mining Tools in 2022
25 Best Data Mining Tools in 202225 Best Data Mining Tools in 2022
25 Best Data Mining Tools in 2022
 
What is Data analytics? How is data analytics a better career option?
What is Data analytics? How is data analytics a better career option?What is Data analytics? How is data analytics a better career option?
What is Data analytics? How is data analytics a better career option?
 
Module 1
Module  1Module  1
Module 1
 
Big data analytics in banking sector
Big data analytics in banking sectorBig data analytics in banking sector
Big data analytics in banking sector
 
IRJET- Comparative Analysis of Various Tools for Data Mining and Big Data...
IRJET-  	  Comparative Analysis of Various Tools for Data Mining and Big Data...IRJET-  	  Comparative Analysis of Various Tools for Data Mining and Big Data...
IRJET- Comparative Analysis of Various Tools for Data Mining and Big Data...
 
Business Visualization: Dashboard & Storyboarding
Business Visualization: Dashboard & StoryboardingBusiness Visualization: Dashboard & Storyboarding
Business Visualization: Dashboard & Storyboarding
 
Business analysis in data warehousing
Business analysis in data warehousingBusiness analysis in data warehousing
Business analysis in data warehousing
 
Machine Data Analytics
Machine Data AnalyticsMachine Data Analytics
Machine Data Analytics
 
Easy Analytics on AWS with Amazon Redshift, Amazon QuickSight, and Amazon Mac...
Easy Analytics on AWS with Amazon Redshift, Amazon QuickSight, and Amazon Mac...Easy Analytics on AWS with Amazon Redshift, Amazon QuickSight, and Amazon Mac...
Easy Analytics on AWS with Amazon Redshift, Amazon QuickSight, and Amazon Mac...
 
BIG DATA and USE CASES
BIG DATA and USE CASESBIG DATA and USE CASES
BIG DATA and USE CASES
 
Case Studies: Enterprise BI vs Self-Service Analytics Tools: Real Life Consid...
Case Studies: Enterprise BI vs Self-Service Analytics Tools: Real Life Consid...Case Studies: Enterprise BI vs Self-Service Analytics Tools: Real Life Consid...
Case Studies: Enterprise BI vs Self-Service Analytics Tools: Real Life Consid...
 
Data modelling tool in CASE
Data modelling tool in CASEData modelling tool in CASE
Data modelling tool in CASE
 
A CRUD Matrix
A CRUD MatrixA CRUD Matrix
A CRUD Matrix
 
Tools for Unstructured Data Analytics
Tools for Unstructured Data AnalyticsTools for Unstructured Data Analytics
Tools for Unstructured Data Analytics
 
BI
BIBI
BI
 
Resume
ResumeResume
Resume
 
March 2016 PHXTUG Meeting
March 2016 PHXTUG MeetingMarch 2016 PHXTUG Meeting
March 2016 PHXTUG Meeting
 
Higher_Ed_Whitepaper
Higher_Ed_WhitepaperHigher_Ed_Whitepaper
Higher_Ed_Whitepaper
 
Higher Ed_Whitepaper
Higher Ed_WhitepaperHigher Ed_Whitepaper
Higher Ed_Whitepaper
 

More from Medicaps University

More from Medicaps University (14)

Unit - 5 Pipelining.pptx
Unit - 5 Pipelining.pptxUnit - 5 Pipelining.pptx
Unit - 5 Pipelining.pptx
 
Unit-4 (IO Interface).pptx
Unit-4 (IO Interface).pptxUnit-4 (IO Interface).pptx
Unit-4 (IO Interface).pptx
 
UNIT-3 Complete PPT.pptx
UNIT-3 Complete PPT.pptxUNIT-3 Complete PPT.pptx
UNIT-3 Complete PPT.pptx
 
UNIT-2.pptx
UNIT-2.pptxUNIT-2.pptx
UNIT-2.pptx
 
UNIT-1 CSA.pptx
UNIT-1 CSA.pptxUNIT-1 CSA.pptx
UNIT-1 CSA.pptx
 
Scheduling
SchedulingScheduling
Scheduling
 
Distributed File Systems
Distributed File SystemsDistributed File Systems
Distributed File Systems
 
Clock synchronization
Clock synchronizationClock synchronization
Clock synchronization
 
Distributed Objects and Remote Invocation
Distributed Objects and Remote InvocationDistributed Objects and Remote Invocation
Distributed Objects and Remote Invocation
 
Distributed Systems
Distributed SystemsDistributed Systems
Distributed Systems
 
Clustering - K-Means, DBSCAN
Clustering - K-Means, DBSCANClustering - K-Means, DBSCAN
Clustering - K-Means, DBSCAN
 
Association and Classification Algorithm
Association and Classification AlgorithmAssociation and Classification Algorithm
Association and Classification Algorithm
 
Data Mining
Data MiningData Mining
Data Mining
 
Data Warehousing (Need,Application,Architecture,Benefits), Data Mart, Schema,...
Data Warehousing (Need,Application,Architecture,Benefits), Data Mart, Schema,...Data Warehousing (Need,Application,Architecture,Benefits), Data Mart, Schema,...
Data Warehousing (Need,Application,Architecture,Benefits), Data Mart, Schema,...
 

Recently uploaded

Top Rated Pune Call Girls Budhwar Peth ⟟ 6297143586 ⟟ Call Me For Genuine Se...
Top Rated  Pune Call Girls Budhwar Peth ⟟ 6297143586 ⟟ Call Me For Genuine Se...Top Rated  Pune Call Girls Budhwar Peth ⟟ 6297143586 ⟟ Call Me For Genuine Se...
Top Rated Pune Call Girls Budhwar Peth ⟟ 6297143586 ⟟ Call Me For Genuine Se...Call Girls in Nagpur High Profile
 
the ladakh protest in leh ladakh 2024 sonam wangchuk.pptx
the ladakh protest in leh ladakh 2024 sonam wangchuk.pptxthe ladakh protest in leh ladakh 2024 sonam wangchuk.pptx
the ladakh protest in leh ladakh 2024 sonam wangchuk.pptxhumanexperienceaaa
 
Sheet Pile Wall Design and Construction: A Practical Guide for Civil Engineer...
Sheet Pile Wall Design and Construction: A Practical Guide for Civil Engineer...Sheet Pile Wall Design and Construction: A Practical Guide for Civil Engineer...
Sheet Pile Wall Design and Construction: A Practical Guide for Civil Engineer...Dr.Costas Sachpazis
 
Call for Papers - African Journal of Biological Sciences, E-ISSN: 2663-2187, ...
Call for Papers - African Journal of Biological Sciences, E-ISSN: 2663-2187, ...Call for Papers - African Journal of Biological Sciences, E-ISSN: 2663-2187, ...
Call for Papers - African Journal of Biological Sciences, E-ISSN: 2663-2187, ...Christo Ananth
 
Porous Ceramics seminar and technical writing
Porous Ceramics seminar and technical writingPorous Ceramics seminar and technical writing
Porous Ceramics seminar and technical writingrakeshbaidya232001
 
College Call Girls Nashik Nehal 7001305949 Independent Escort Service Nashik
College Call Girls Nashik Nehal 7001305949 Independent Escort Service NashikCollege Call Girls Nashik Nehal 7001305949 Independent Escort Service Nashik
College Call Girls Nashik Nehal 7001305949 Independent Escort Service NashikCall Girls in Nagpur High Profile
 
Introduction to Multiple Access Protocol.pptx
Introduction to Multiple Access Protocol.pptxIntroduction to Multiple Access Protocol.pptx
Introduction to Multiple Access Protocol.pptxupamatechverse
 
Call Girls Service Nashik Vaishnavi 7001305949 Independent Escort Service Nashik
Call Girls Service Nashik Vaishnavi 7001305949 Independent Escort Service NashikCall Girls Service Nashik Vaishnavi 7001305949 Independent Escort Service Nashik
Call Girls Service Nashik Vaishnavi 7001305949 Independent Escort Service NashikCall Girls in Nagpur High Profile
 
Extrusion Processes and Their Limitations
Extrusion Processes and Their LimitationsExtrusion Processes and Their Limitations
Extrusion Processes and Their Limitations120cr0395
 
Software Development Life Cycle By Team Orange (Dept. of Pharmacy)
Software Development Life Cycle By  Team Orange (Dept. of Pharmacy)Software Development Life Cycle By  Team Orange (Dept. of Pharmacy)
Software Development Life Cycle By Team Orange (Dept. of Pharmacy)Suman Mia
 
Structural Analysis and Design of Foundations: A Comprehensive Handbook for S...
Structural Analysis and Design of Foundations: A Comprehensive Handbook for S...Structural Analysis and Design of Foundations: A Comprehensive Handbook for S...
Structural Analysis and Design of Foundations: A Comprehensive Handbook for S...Dr.Costas Sachpazis
 
Decoding Kotlin - Your guide to solving the mysterious in Kotlin.pptx
Decoding Kotlin - Your guide to solving the mysterious in Kotlin.pptxDecoding Kotlin - Your guide to solving the mysterious in Kotlin.pptx
Decoding Kotlin - Your guide to solving the mysterious in Kotlin.pptxJoão Esperancinha
 
SPICE PARK APR2024 ( 6,793 SPICE Models )
SPICE PARK APR2024 ( 6,793 SPICE Models )SPICE PARK APR2024 ( 6,793 SPICE Models )
SPICE PARK APR2024 ( 6,793 SPICE Models )Tsuyoshi Horigome
 
Introduction and different types of Ethernet.pptx
Introduction and different types of Ethernet.pptxIntroduction and different types of Ethernet.pptx
Introduction and different types of Ethernet.pptxupamatechverse
 
UNIT-III FMM. DIMENSIONAL ANALYSIS
UNIT-III FMM.        DIMENSIONAL ANALYSISUNIT-III FMM.        DIMENSIONAL ANALYSIS
UNIT-III FMM. DIMENSIONAL ANALYSISrknatarajan
 
(RIA) Call Girls Bhosari ( 7001035870 ) HI-Fi Pune Escorts Service
(RIA) Call Girls Bhosari ( 7001035870 ) HI-Fi Pune Escorts Service(RIA) Call Girls Bhosari ( 7001035870 ) HI-Fi Pune Escorts Service
(RIA) Call Girls Bhosari ( 7001035870 ) HI-Fi Pune Escorts Serviceranjana rawat
 
Booking open Available Pune Call Girls Koregaon Park 6297143586 Call Hot Ind...
Booking open Available Pune Call Girls Koregaon Park  6297143586 Call Hot Ind...Booking open Available Pune Call Girls Koregaon Park  6297143586 Call Hot Ind...
Booking open Available Pune Call Girls Koregaon Park 6297143586 Call Hot Ind...Call Girls in Nagpur High Profile
 
APPLICATIONS-AC/DC DRIVES-OPERATING CHARACTERISTICS
APPLICATIONS-AC/DC DRIVES-OPERATING CHARACTERISTICSAPPLICATIONS-AC/DC DRIVES-OPERATING CHARACTERISTICS
APPLICATIONS-AC/DC DRIVES-OPERATING CHARACTERISTICSKurinjimalarL3
 

Recently uploaded (20)

Top Rated Pune Call Girls Budhwar Peth ⟟ 6297143586 ⟟ Call Me For Genuine Se...
Top Rated  Pune Call Girls Budhwar Peth ⟟ 6297143586 ⟟ Call Me For Genuine Se...Top Rated  Pune Call Girls Budhwar Peth ⟟ 6297143586 ⟟ Call Me For Genuine Se...
Top Rated Pune Call Girls Budhwar Peth ⟟ 6297143586 ⟟ Call Me For Genuine Se...
 
the ladakh protest in leh ladakh 2024 sonam wangchuk.pptx
the ladakh protest in leh ladakh 2024 sonam wangchuk.pptxthe ladakh protest in leh ladakh 2024 sonam wangchuk.pptx
the ladakh protest in leh ladakh 2024 sonam wangchuk.pptx
 
Sheet Pile Wall Design and Construction: A Practical Guide for Civil Engineer...
Sheet Pile Wall Design and Construction: A Practical Guide for Civil Engineer...Sheet Pile Wall Design and Construction: A Practical Guide for Civil Engineer...
Sheet Pile Wall Design and Construction: A Practical Guide for Civil Engineer...
 
Call for Papers - African Journal of Biological Sciences, E-ISSN: 2663-2187, ...
Call for Papers - African Journal of Biological Sciences, E-ISSN: 2663-2187, ...Call for Papers - African Journal of Biological Sciences, E-ISSN: 2663-2187, ...
Call for Papers - African Journal of Biological Sciences, E-ISSN: 2663-2187, ...
 
Porous Ceramics seminar and technical writing
Porous Ceramics seminar and technical writingPorous Ceramics seminar and technical writing
Porous Ceramics seminar and technical writing
 
College Call Girls Nashik Nehal 7001305949 Independent Escort Service Nashik
College Call Girls Nashik Nehal 7001305949 Independent Escort Service NashikCollege Call Girls Nashik Nehal 7001305949 Independent Escort Service Nashik
College Call Girls Nashik Nehal 7001305949 Independent Escort Service Nashik
 
Introduction to Multiple Access Protocol.pptx
Introduction to Multiple Access Protocol.pptxIntroduction to Multiple Access Protocol.pptx
Introduction to Multiple Access Protocol.pptx
 
Call Girls Service Nashik Vaishnavi 7001305949 Independent Escort Service Nashik
Call Girls Service Nashik Vaishnavi 7001305949 Independent Escort Service NashikCall Girls Service Nashik Vaishnavi 7001305949 Independent Escort Service Nashik
Call Girls Service Nashik Vaishnavi 7001305949 Independent Escort Service Nashik
 
Roadmap to Membership of RICS - Pathways and Routes
Roadmap to Membership of RICS - Pathways and RoutesRoadmap to Membership of RICS - Pathways and Routes
Roadmap to Membership of RICS - Pathways and Routes
 
DJARUM4D - SLOT GACOR ONLINE | SLOT DEMO ONLINE
DJARUM4D - SLOT GACOR ONLINE | SLOT DEMO ONLINEDJARUM4D - SLOT GACOR ONLINE | SLOT DEMO ONLINE
DJARUM4D - SLOT GACOR ONLINE | SLOT DEMO ONLINE
 
Extrusion Processes and Their Limitations
Extrusion Processes and Their LimitationsExtrusion Processes and Their Limitations
Extrusion Processes and Their Limitations
 
Software Development Life Cycle By Team Orange (Dept. of Pharmacy)
Software Development Life Cycle By  Team Orange (Dept. of Pharmacy)Software Development Life Cycle By  Team Orange (Dept. of Pharmacy)
Software Development Life Cycle By Team Orange (Dept. of Pharmacy)
 
Structural Analysis and Design of Foundations: A Comprehensive Handbook for S...
Structural Analysis and Design of Foundations: A Comprehensive Handbook for S...Structural Analysis and Design of Foundations: A Comprehensive Handbook for S...
Structural Analysis and Design of Foundations: A Comprehensive Handbook for S...
 
Decoding Kotlin - Your guide to solving the mysterious in Kotlin.pptx
Decoding Kotlin - Your guide to solving the mysterious in Kotlin.pptxDecoding Kotlin - Your guide to solving the mysterious in Kotlin.pptx
Decoding Kotlin - Your guide to solving the mysterious in Kotlin.pptx
 
SPICE PARK APR2024 ( 6,793 SPICE Models )
SPICE PARK APR2024 ( 6,793 SPICE Models )SPICE PARK APR2024 ( 6,793 SPICE Models )
SPICE PARK APR2024 ( 6,793 SPICE Models )
 
Introduction and different types of Ethernet.pptx
Introduction and different types of Ethernet.pptxIntroduction and different types of Ethernet.pptx
Introduction and different types of Ethernet.pptx
 
UNIT-III FMM. DIMENSIONAL ANALYSIS
UNIT-III FMM.        DIMENSIONAL ANALYSISUNIT-III FMM.        DIMENSIONAL ANALYSIS
UNIT-III FMM. DIMENSIONAL ANALYSIS
 
(RIA) Call Girls Bhosari ( 7001035870 ) HI-Fi Pune Escorts Service
(RIA) Call Girls Bhosari ( 7001035870 ) HI-Fi Pune Escorts Service(RIA) Call Girls Bhosari ( 7001035870 ) HI-Fi Pune Escorts Service
(RIA) Call Girls Bhosari ( 7001035870 ) HI-Fi Pune Escorts Service
 
Booking open Available Pune Call Girls Koregaon Park 6297143586 Call Hot Ind...
Booking open Available Pune Call Girls Koregaon Park  6297143586 Call Hot Ind...Booking open Available Pune Call Girls Koregaon Park  6297143586 Call Hot Ind...
Booking open Available Pune Call Girls Koregaon Park 6297143586 Call Hot Ind...
 
APPLICATIONS-AC/DC DRIVES-OPERATING CHARACTERISTICS
APPLICATIONS-AC/DC DRIVES-OPERATING CHARACTERISTICSAPPLICATIONS-AC/DC DRIVES-OPERATING CHARACTERISTICS
APPLICATIONS-AC/DC DRIVES-OPERATING CHARACTERISTICS
 

data mining and warehousing computer science

  • 1. MEDI-CAPS UNIVERSITY Faculty of Engineering Mr. Sagar Pandya Information Technology Department sagar.pandya@medicaps.ac.in
  • 2. Data Mining and Warehousing Mr. Sagar Pandya Information Technology Department sagar.pandya@medicaps.ac.in Course Code Course Name Hours Per Week Total Credits L T P IT3ED02 Data Mining and Warehousing 3 0 0 3
  • 3. IT3ED02 Data Mining and Warehousing 3-0-0 Mr. Sagar Pandya sagar.pandya@medicaps.ac.in  Unit 1. Introduction  Unit 2. Data Mining  Unit 3. Association and Classification  Unit 4. Clustering  Unit 5. Business Analysis
  • 4. Reference Books Text Books  Han, Kamber and Pi, Data Mining Concepts & Techniques, Morgan Kaufmann, India, 2012.  Mohammed Zaki and Wagner Meira Jr., Data Mining and Analysis: Fundamental Concepts and Algorithms, Cambridge University Press.  Z. Markov, Daniel T. Larose Data Mining the Web, Jhon wiley & son, USA. Reference Books  Sam Anahory and Dennis Murray, Data Warehousing in the Real World, Pearson Education Asia.  W. H. Inmon, Building the Data Warehouse, 4th Ed Wiley India. and many others Mr. Sagar Pandya sagar.pandya@medicaps.ac.in
  • 5. Unit-5 Business Analysis  Reporting and Query Tools and Application-  Tool Categories-  Need for Applications-SAS,KNIME, ORANGE, ETL,  Data Quality,  OLAP,  Dimensional Modelling, Multidimensional Model,  Multidimensional vs Multirelational  OLAP, OLAP Tools Mr. Sagar Pandya sagar.pandya@medicaps.ac.in
  • 6. Reporting and Query Tools and Applications Mr. Sagar Pandya sagar.pandya@medicaps.ac.in • A querying and reporting tool helps you run regular reports, create organized listings, and perform cross-tabular reporting and querying.  Query Tools  One of the primary objects of data warehousing is to provide information to businesses to make strategic decisions.  Query tools allow users to interact with the data warehouse system.  These tools fall into four different categories: 1. Query and reporting tools 2. Application Development tools 3. Data mining tools 4. OLAP tools
  • 7. Reporting and Query Tools and Applications Mr. Sagar Pandya sagar.pandya@medicaps.ac.in  1. Query and reporting tools:  Query and reporting tools can be further divided into • Reporting tools • Managed query tools  Reporting tools:  Reporting tools can be further divided into production reporting tools and desktop report writer. 1. Report writers: This kind of reporting tool are tools designed for end- users for their analysis. 2. Production reporting: This kind of tools allows organizations to generate regular operational reports. 3. It also supports high volume batch jobs like printing and calculating.
  • 8. Reporting and Query Tools and Applications Mr. Sagar Pandya sagar.pandya@medicaps.ac.in  Some popular reporting tools are Brio, Business Objects, Oracle, PowerSoft, SAS Institute.  Managed query tools:  Managed query tools shield end user from the Complexities of SQL and database structure by inserting a meta layer between user and the database.  Meta layer :Software that provides subject oriented views of a database and supports point and click creation of SQL  2. Application development tools:  First deployed on main frame system.  Sometimes built-in graphical and analytical tools do not satisfy the analytical needs of an organization.
  • 9. Reporting and Query Tools and Applications Mr. Sagar Pandya sagar.pandya@medicaps.ac.in  In such cases, custom reports are developed using Application development tools.  3. Data mining tools:  Data mining is a process of discovering meaningful new correlation, pattens, and trends by mining large amount data. Data mining tools are used to make this process automatic.  4. OLAP tools:  These tools are based on concepts of a multidimensional database.  It allows users to analyze the data using elaborate and complex multidimensional views.  Provide an intuitive way to view corporate data  Users can drill down across, or up levels
  • 10. Reporting and Query Tools and Applications Mr. Sagar Pandya sagar.pandya@medicaps.ac.in • A querying and reporting tool helps you run regular reports, create organized listings, and perform cross-tabular reporting and querying. Basic query and reporting “Tell me what happened.” Business analysis (OLAP) “Tell me what happened and why.” Data mining “Tell me what may happen” or “Tell me something interesting.” Dashboards and scorecards “Tell me how I’m doing currently and against my plan.”
  • 11. Reporting and Query Tools and Applications Mr. Sagar Pandya sagar.pandya@medicaps.ac.in  Need For Applications:  Some tools and apps can format the retrieved data into easy-to-read reports, while others concentrate on the on-screen presentation As the complexity of questions grows this tools may rapidly become Inefficient.  Consider various access types to the data stored in a data warehouse  Simple tabular form reporting  Ad hoc user specified queries  Predefined repeatable queries  Complex queries with multi table joins ,multilevel subqueries, and sophisticated search criteria.  Ranking  Multivariable analysis
  • 12. Reporting and Query Tools and Applications Mr. Sagar Pandya sagar.pandya@medicaps.ac.in  Time series analysis, Complex textual search  Data visualization, graphing, charting and pivoting  Interactive Drill down reporting an analysis  AI techniques for testing of hypothesis  Information Mapping, Statistical analysis  Interactive drill-down reporting and analysis  The first four types of access are covered by the combine category of tools we will call query and reporting tools.  There are three types of reporting  Creation and viewing of standard reports  Definition and creation of ad hoc reports  Data exploration
  • 13. Reporting and Query Tools and Applications Mr. Sagar Pandya sagar.pandya@medicaps.ac.in  Cognos Impromptu  What is impromptu?  Impromptu is an interactive database reporting tool.  It allows Power Users to query data without programming knowledge.  It is only capable of reading the data.  Impromptu’s main features includes,  Interactive reporting capability  Enterprise-wide scalability  Superior user interface  Fastest time to result  Lowest cost of ownership
  • 14. Reporting and Query Tools and Applications Mr. Sagar Pandya sagar.pandya@medicaps.ac.in  IBM Cognos Business Intelligence is a web based reporting and analytic tool.  It is used to perform data aggregation and create user friendly detailed reports.  Reports can contain Graphs, Multiple Pages, Different Tabs and Interactive Prompts.  These reports can be viewed on web browsers, or on hand held devices like tablets and smartphones.  Cognos also provides you an option to export the report in XML or PDF format or you can view the reports in XML format.  You can also schedule the report to run in the background at specific time period so it saves the time to view the daily report as you don’t need to run the report every time.
  • 15. Reporting and Query Tools and Applications Mr. Sagar Pandya sagar.pandya@medicaps.ac.in  IBM Cognos provides a wide range of features and can be considered as an enterprise software to provide flexible reporting environment and can be used for large and medium enterprises.  It meets the need of Power Users, Analysts, Business Managers and Company Executives.  Power users and analysts want to create adhoc reports and can create multiple views of the same data.  Business Executives want to see summarize data in dashboard styles, cross tabs and visualizations.  Cognos BI reporting allows you to bring the data from multiple databases into a single set of reports.  IBM Cognos provides wide range of features as compared to other BI tools in the market.
  • 16. OLAP Mr. Sagar Pandya sagar.pandya@medicaps.ac.in  OLAP stands for Online Analytical Processing.  OLAP (Online Analytical Processing) is the technology behind many Business Intelligence (BI) applications.  OLAP is a powerful technology for data discovery, including capabilities for limitless report viewing, complex analytical calculations, and predictive “what if” scenario (budget, forecast) planning.  It uses database tables (fact and dimension tables) to enable multidimensional viewing, analysis and querying of large amounts of data.  E.g. OLAP technology could provide management with fast answers to complex queries on their operational data or enable them to analyze their company’s historical data for trends and patterns.
  • 17. OLAP Mr. Sagar Pandya sagar.pandya@medicaps.ac.in  Online Analytical Processing (OLAP) applications and tools are those that are designed to ask ―complex queries of large multidimensional collections of data.  How is OLAP Technology Used?  OLAP is an acronym for Online Analytical Processing. OLAP performs multidimensional analysis of business data and provides the capability for complex calculations, trend analysis, and sophisticated data modeling.  It is the foundation for many kinds of business applications for Business Performance Management, Planning, Budgeting, Forecasting, Financial Reporting, Analysis, Simulation Models, Knowledge Discovery, and Data Warehouse Reporting.
  • 18. OLAP Mr. Sagar Pandya sagar.pandya@medicaps.ac.in  Unlike relational databases, OLAP tools do not store individual transaction records in two-dimensional, row-by-column format, like a worksheet, but instead use multidimensional database structures— known as Cubes in OLAP terminology—to store arrays of consolidated information.  The data and formulas are stored in an optimized multidimensional database, while views of the data are created on demand.  OLAP technology implementations depend not only on the type of software, but also on underlying data sources and the intended business objective(s).  Each industry or business area is specific and requires some degree of customized modeling to create multidimensional “cubes” for data loading and reporting building, at minimum.
  • 19. OLAP CUBE Mr. Sagar Pandya sagar.pandya@medicaps.ac.in  At the core of the OLAP concept, is an OLAP Cube. The OLAP cube is a data structure optimized for very quick data analysis.  The OLAP Cube consists of numeric facts called measures which are categorized by dimensions. OLAP Cube is also called the hypercube.
  • 20. OLAP CUBE Mr. Sagar Pandya sagar.pandya@medicaps.ac.in  Usually, data operations and analysis are performed using the simple spreadsheet, where data values are arranged in row and column format. This is ideal for two-dimensional data.  However, OLAP contains multidimensional data, with data usually obtained from a different and unrelated source.  Using a spreadsheet is not an optimal option.  The cube can store and analyze multidimensional data in a logical and orderly manner.  OLAP cubes have two main purposes. The first is to provide business users with a data model more intuitive to them than a tabular model. This model is called a Dimensional Model.  The second purpose is to enable fast query response that is usually difficult to achieve using tabular models.
  • 21. OLAP CUBE Mr. Sagar Pandya sagar.pandya@medicaps.ac.in  How does it work?  A Data warehouse would extract information from multiple data sources and formats like text files, excel sheet, multimedia files, etc.  The extracted data is cleaned and transformed. Data is loaded into an OLAP server (or OLAP cube) where information is pre-calculated in advance for further analysis.  Fundamentally, OLAP has a very simple concept.  It pre-calculates most of the queries that are typically very hard to execute over tabular databases, namely aggregation, joining, and grouping.  These queries are calculated during a process that is usually called 'building' or 'processing' of the OLAP cube.
  • 22. Basic analytical operations of OLAP Mr. Sagar Pandya sagar.pandya@medicaps.ac.in  Four types of analytical operations in OLAP are:  Roll-up  Drill-down  Slice and dice  Pivot (rotate)  1) Roll-up:  Roll-up is also known as "consolidation" or "aggregation."  The Roll-up operation can be performed in 2 ways:  Reducing dimensions  Climbing up concept hierarchy. Concept hierarchy is a system of grouping things based on their order or level.  Consider the following diagram
  • 23. Basic analytical operations of OLAP Mr. Sagar Pandya sagar.pandya@medicaps.ac.in
  • 24. Basic analytical operations of OLAP Mr. Sagar Pandya sagar.pandya@medicaps.ac.in  In this example, cities New jersey and Lost Angles and rolled up into country USA  The sales figure of New Jersey and Los Angeles are 440 and 1560 respectively. They become 2000 after roll-up  In this aggregation process, data is location hierarchy moves up from city to the country.  In the roll-up process at least one or more dimensions need to be removed. In this example, Quarter dimension is removed.  2) Drill-down  In drill-down data is fragmented into smaller parts. It is the opposite of the rollup process. It can be done via, Moving down the concept hierarchy or Increasing a dimension.
  • 25. Basic analytical operations of OLAP Mr. Sagar Pandya sagar.pandya@medicaps.ac.in
  • 26. Basic analytical operations of OLAP Mr. Sagar Pandya sagar.pandya@medicaps.ac.in  Quarter Q1 is drilled down to months January, February, and March. Corresponding sales are also registers.  In this example, dimension months are added.  3) Slice:  Here, one dimension is selected, and a new sub-cube is created.  Dimension Time is Sliced with Q1 as the filter.  A new cube is created altogether.
  • 27. Basic analytical operations of OLAP Mr. Sagar Pandya sagar.pandya@medicaps.ac.in
  • 28. Basic analytical operations of OLAP Mr. Sagar Pandya sagar.pandya@medicaps.ac.in  Dice:  This operation is similar to a slice. The difference in dice is you select 2 or more dimensions that result in the creation of a sub-cube.
  • 29. Basic analytical operations of OLAP Mr. Sagar Pandya sagar.pandya@medicaps.ac.in
  • 30. Basic analytical operations of OLAP Mr. Sagar Pandya sagar.pandya@medicaps.ac.in  4) Pivot  In Pivot, you rotate the data axes to provide a substitute presentation of data.  In the following example, the pivot is based on item types.
  • 31. Basic analytical operations of OLAP Mr. Sagar Pandya sagar.pandya@medicaps.ac.in
  • 32. OLAP Mr. Sagar Pandya sagar.pandya@medicaps.ac.in  The main characteristics of OLAP are as follows:  Multidimensional conceptual view: OLAP systems let business users have a dimensional and logical view of the data in the data warehouse. It helps in carrying slice and dice operations.  Multi-User Support: Since the OLAP techniques are shared, the OLAP operation should provide normal database operations, containing retrieval, update, adequacy control, integrity, and security.  Accessibility: OLAP acts as a mediator between data warehouses and front-end. The OLAP operations should be sitting between data sources (e.g., data warehouses) and an OLAP front-end.  Storing OLAP results: OLAP results are kept separate from data sources.
  • 33. OLAP Mr. Sagar Pandya sagar.pandya@medicaps.ac.in  OLAP provides for distinguishing between zero values and missing values so that aggregates are computed correctly.  OLAP system should ignore all missing values and compute correct aggregate values.  OLAP facilitate interactive query and complex analysis for the users.  OLAP allows users to drill down for greater details or roll up for aggregations of metrics along a single business dimension or across multiple dimension.  OLAP provides the ability to perform intricate calculations and comparisons.  OLAP presents results in a number of meaningful ways, including charts and graphs.
  • 34. OLAP Mr. Sagar Pandya sagar.pandya@medicaps.ac.in  Advantages of OLAP  OLAP is a platform for all type of business includes planning, budgeting, reporting, and analysis.  Information and calculations are consistent in an OLAP cube. This is a crucial benefit.  Quickly create and analyze "What if" scenarios  Easily search OLAP database for broad or specific terms.  OLAP provides the building blocks for business modeling tools, Data mining tools, performance reporting tools.  Allows users to do slice and dice cube data all by various dimensions, measures, and filters.
  • 35. OLAP Mr. Sagar Pandya sagar.pandya@medicaps.ac.in  It is good for analyzing time series.  Finding some clusters and outliers is easy with OLAP.  It is a powerful visualization online analytical process system which provides faster response times.  Disadvantages of OLAP  OLAP requires organizing data into a star or snowflake schema. These schemas are complicated to implement and administer.  You cannot have large number of dimensions in a single OLAP cube.  Transactional data cannot be accessed with OLAP system.  Any modification in an OLAP cube needs a full update of the cube. This is a time-consuming process
  • 36. OLAP Mr. Sagar Pandya sagar.pandya@medicaps.ac.in  Types of OLAP systems  OLAP Hierarchical Structure
  • 37. ROLAP Mr. Sagar Pandya sagar.pandya@medicaps.ac.in  ROLAP works with data that exist in a relational database.  Facts and dimension tables are stored as relational tables.  It also allows multidimensional analysis of data and is the fastest growing OLAP.  This methodology relies on manipulating the data stored in the relational database to give the appearance of traditional OLAP’s slicing and dicing functionality.  In essence, each action of slicing and dicing is equivalent to adding a ―WHERE clause in the SQL statement. Data stored in relational tables.  Relational OLAP servers are placed between relational back-end server and client front-end tools.
  • 38. ROLAP Mr. Sagar Pandya sagar.pandya@medicaps.ac.in  To store and manage the warehouse data, the relational OLAP uses relational or extended-relational DBMS.  ROLAP includes the following − • Implementation of aggregation navigation logic • Optimization for each DBMS back-end • Additional tools and services  Points to Remember • ROLAP servers are highly scalable. • ROLAP tools analyze large volumes of data across multiple dimensions. • ROLAP tools store and analyze highly volatile and changeable data.
  • 39. ROLAP Mr. Sagar Pandya sagar.pandya@medicaps.ac.in  Relational OLAP Architecture  ROLAP Architecture includes the following components • Database server. • ROLAP server. • Front-end tool.  Relational OLAP (ROLAP) is the latest and fastest-growing OLAP technology segment in the market.  This method allows multiple multidimensional views of two- dimensional relational tables to be created, avoiding structuring record around the desired view.  Some products in this segment have supported reliable SQL engines to help the complexity of multidimensional analysis.
  • 41. ROLAP Mr. Sagar Pandya sagar.pandya@medicaps.ac.in  Advantages of ROLAP model: 1. High data efficiency. It offers high data efficiency because query performance and access language are optimized particularly for the multidimensional data analysis. 2. Scalability. This type of OLAP system offers scalability for managing large volumes of data, and even when the data is steadily increasing.  Drawbacks of ROLAP model: 1. Demand for higher resources: ROLAP needs high utilization of manpower, software, and hardware resources. 2. Aggregately data limitations. ROLAP tools use SQL for all calculation of aggregate data. However, there are no set limits to the for handling computations. 3. Slow query performance. Query performance in this model is slow when compared with MOLAP
  • 42. MOLAP Mr. Sagar Pandya sagar.pandya@medicaps.ac.in  Multidimensional OLAP  MOLAP uses array-based multidimensional storage engines to display multidimensional views of data. Basically, they use an OLAP cube.  This is the more traditional way of OLAP analysis.  In MOLAP, data is stored in a multidimensional cube.  The storage is not in the relational database, but in proprietary formats. That is, data stored in array-based structures.  MOLAP is used for limited data volumes and in this data is stored in multidimensional array.  In MOLAP, Dynamic multidimensional view of data is created.
  • 43. MOLAP Mr. Sagar Pandya sagar.pandya@medicaps.ac.in  Points to Remember −  In MOLAP, operations are called processing. • MOLAP tools process information with consistent response time regardless of level of summarizing or calculations selected. • MOLAP tools need to avoid many of the complexities of creating a relational database to store data for analysis. • MOLAP tools need fastest possible performance. • MOLAP server adopts two level of storage representation to handle dense and sparse data sets. • Denser sub-cubes are identified and stored as array structure. • Sparse sub-cubes employ compression technology.
  • 45. MOLAP Mr. Sagar Pandya sagar.pandya@medicaps.ac.in  MOLAP Architecture  MOLAP Architecture includes the following components • Database server. • MOLAP server. • Front-end tool.  MOLAP structure primarily reads the precompiled data. MOLAP structure has limited capabilities to dynamically create aggregations or to evaluate results which have not been pre-calculated and stored.  The main difference between ROLAP and MOLAP is that, In ROLAP, Data is fetched from data-warehouse. On the other hand, in MOLAP, Data is fetched from MDDBs database. The common term between these two is OLAP.
  • 46. MOLAP Mr. Sagar Pandya sagar.pandya@medicaps.ac.in  Advantages:  Excellent performance: MOLAP cubes are built for fast data retrieval, and are optimal for slicing and dicing operations.  Can perform complex calculations: All calculations have been pre- generated when the cube is created. Hence, complex calculations are not only doable, but they return quickly.  Disadvantages:  Limited in the amount of data it can handle: Because all calculations are performed when the cube is built, it is not possible to include a large amount of data in the cube itself.  This is not to say that the data in the cube cannot be derived from a large amount of data. Indeed, this is possible. But in this case, only summary-level information will be included in the cube itself.
  • 47. MOLAP Mr. Sagar Pandya sagar.pandya@medicaps.ac.in  Requires additional investment: Cube technology are often proprietary and do not already exist in the organization.  Therefore, to adopt MOLAP technology, chances are additional investments in human and capital resources are needed.  MOLAP are not capable of containing detailed data.  The storage utilization may be low if the data set is sparse.  MOLAP Solutions may be lengthy, particularly on large data volumes.  MOLAP products may face issues while updating and querying models when dimensions are more than ten.  MOLAP is not capable of containing detailed data.  The storage utilization can be low if the data set is highly scattered.
  • 48. MOLAP Mr. Sagar Pandya sagar.pandya@medicaps.ac.in  MOLAP Tools • Essbase - Tools from Oracle that has a multidimensional database. • Express Server - Web-based environment that runs on Oracle database. • Yellowfin - Business analytics tools for creating reports and dashboards. • Clear Analytics - Clear analytics is an Excel-based business solution. • SAP Business Intelligence - Business analytics solutions from SAP
  • 49. ROLAP vs MOLAP Mr. Sagar Pandya sagar.pandya@medicaps.ac.in S. No. ROLAP MOLAP 1. ROLAP stands for Relational Online Analytical Processing. While MOLAP stands for Multidimensional Online Analytical Processing. 2. ROLAP is used for large data volumes. While it is used for limited data volumes. 3. The access of ROLAP is slow. While the access of MOLAP is fast. 4. In ROLAP, Data is stored in relation tables. While in MOLAP, Data is stored in multidimensional array.
  • 50. ROLAP vs MOLAP Mr. Sagar Pandya sagar.pandya@medicaps.ac.in S. No. ROLAP MOLAP 5. In ROLAP, Data is fetched from data-warehouse. While in MOLAP, Data is fetched from MDDBs database. 6. In ROLAP, Complicated SQL queries are used. While in MOLAP, Sparse matrix is used. 7. In ROLAP, Static multidimensional view of data is created. While in MOLAP, Dynamic multidimensional view of data is created. 8. MOLAP is best suited for inexperienced users, since it is very easy to use. ROLAP is best suited for experienced users.
  • 51. HOLAP Mr. Sagar Pandya sagar.pandya@medicaps.ac.in  Hybrid OLAP is a mixture of both ROLAP and MOLAP.  It offers fast computation of MOLAP and higher scalability of ROLAP. HOLAP uses two databases. 1. Aggregated or computed data is stored in a multidimensional OLAP cube 2. Detailed information is stored in a relational database.  HOLAP technologies attempt to combine the advantages of MOLAP and ROLAP. For summary type information, HOLAP leverages cube technology for faster performance.  HOLAP also can drill through from the cube down to the relational tables for delineated data.  The Microsoft SQL Server 2000 provides a hybrid OLAP server.
  • 52. HOLAP Mr. Sagar Pandya sagar.pandya@medicaps.ac.in  Benefits of Hybrid OLAP:  HOLAP provide benefits of both MOLAP and ROLAP.  This kind of OLAP helps to economize the disk space, and it also remains compact which helps to avoid issues related to access speed and convenience.  Hybrid HOLAP's uses cube technology which allows faster performance for all types of data.  ROLAP are instantly updated and HOLAP users have access to this real-time instantly updated data.  MOLAP brings cleaning and conversion of data thereby improving data relevance. This brings best of both worlds.
  • 53. HOLAP Mr. Sagar Pandya sagar.pandya@medicaps.ac.in  Drawbacks of Hybrid OLAP:  Greater complexity level: The major drawback in HOLAP systems is that it supports both ROLAP and MOLAP tools and applications. Thus, it is very complicated.  Potential overlaps: There are higher chances of overlapping especially into their functionalities.
  • 54. Other types of OLAP Mr. Sagar Pandya sagar.pandya@medicaps.ac.in  Desktop OLAP (DOLAP):  In Desktop OLAP, a user downloads a part of the data from the database locally, or on their desktop and analyze it. DOLAP is relatively cheaper to deploy as it offers very few functionalities compares to other OLAP systems.  Web OLAP (WOLAP):  Web OLAP which is OLAP system accessible via the web browser. WOLAP is a three-tiered architecture. It consists of three components: client, middleware, and a database server.  Mobile OLAP (MOLAP): Mobile OLAP helps users to access and analyze OLAP data using their mobile devices.  Spatial OLAP (SOLAP): SOLAP is created to facilitate management of both spatial and non-spatial data in a Geographic Information system (GIS)
  • 55. Dimensional Modelling Mr. Sagar Pandya sagar.pandya@medicaps.ac.in  Dimensional modeling represents data with a cube operation, making more suitable logical data representation with OLAP data management.  The perception of Dimensional Modeling was developed by Ralph Kimball and is consist of "fact" and "dimension" tables.  In dimensional modeling, the transaction record is divided into either "facts," which are frequently numerical transaction data, or "dimensions," which are the reference information that gives context to the facts.  For example, a sale transaction can be damage into facts such as the number of products ordered and the price paid for the products, and into dimensions such as order date, user name, product number, order ship-to, and bill-to locations, and salesman responsible for receiving the order.
  • 56. Dimensional Modelling Mr. Sagar Pandya sagar.pandya@medicaps.ac.in  Dimensional Modeling (DM) is a data structure technique optimized for data storage in a Data warehouse.  The advantage of using this model is that we can store data in such a way that it is easier to store and retrieve the data once stored in a data warehouse.  Dimensional model is the data model used by many OLAP systems.  Objectives of Dimensional Modeling  The purposes of dimensional modeling are: 1. To produce database architecture that is easy for end-clients to understand and write queries. 2. To maximize the efficiency of queries. It achieves these goals by minimizing the number of tables and relationships between them.
  • 57. Dimensional Modelling Mr. Sagar Pandya sagar.pandya@medicaps.ac.in  Elements of Dimensional Modeling:  Fact  It is a collection of associated data items, consisting of measures and context data. It typically represents business items or business transactions.  Dimensions  It is a collection of data which describe one business dimension. Dimensions decide the contextual background for the facts, and they are the framework over which OLAP is performed.  Measure  It is a numeric attribute of a fact, representing the performance or behavior of the business relative to the dimensions.
  • 58. Dimensional Modelling Mr. Sagar Pandya sagar.pandya@medicaps.ac.in
  • 59. Dimensional Modelling Mr. Sagar Pandya sagar.pandya@medicaps.ac.in  Steps to Create Dimensional Data Modeling:  Step-1: Identifying the business objective –  The first step is to identify the business objective. Sales, HR, Marketing, etc. are some examples as per the need of the organization.  Since it is the most important step of Data Modelling the selection of business objective also depends on the quality of data available for that process.  Step-2: Identifying Granularity –  Granularity is the lowest level of information stored in the table. The level of detail for business problem and its solution is described by Grain.
  • 60. Dimensional Modelling Mr. Sagar Pandya sagar.pandya@medicaps.ac.in  During this stage, you answer questions like  Do we need to store all the available products or just a few types of products? This decision is based on the business processes selected for Data warehouse.  Do we store the product sale information on a monthly, weekly, daily or hourly basis? This decision depends on the nature of reports requested by executives.  How do the above two choices affect the database size?  Example of Grain:  The CEO at an MNC wants to find the sales for specific products in different locations on a daily basis.  So, the grain is "product sale information by location by the day."
  • 61. Dimensional Modelling Mr. Sagar Pandya sagar.pandya@medicaps.ac.in  Step-3: Identifying Dimensions and its Attributes –  Dimensions are objects or things.  Dimensions are nouns like date, store, inventory, etc. These dimensions are where all the data should be stored.  For example, the date dimension may contain data like a year, month and weekday.  Dimensions categorize and describe data warehouse facts and measures in a way that support meaningful answers to business questions.  A data warehouse organizes descriptive attributes as columns in dimension tables. For Example, the data dimension may contain data like a year, month and weekday.
  • 62. Dimensional Modelling Mr. Sagar Pandya sagar.pandya@medicaps.ac.in  Example of Dimensions:  The CEO at an MNC wants to find the sales for specific products in different locations on a daily basis.  Dimensions: Product, Location and Time  Attributes: For Product: Product key (Foreign Key), Name, Type, Specifications  Hierarchies: For Location: Country, State, City, Street Address, Name  Step-4: Identifying the Fact –  The measurable data is hold by the fact table. Most of the fact table rows are numerical values like price or cost per unit, etc.
  • 63. Dimensional Modelling Mr. Sagar Pandya sagar.pandya@medicaps.ac.in  Example of Facts:  The CEO at an MNC wants to find the sales for specific products in different locations on a daily basis.  The fact here is Sum of Sales by product by location by time.  Step 5) Build Schema  In this step, you implement the Dimension Model. A schema is nothing but the database structure (arrangement of tables). There are two popular schemas:  Star Schema  The star schema architecture is easy to design. It is called a star schema because diagram resembles a star, with points radiating from a center.
  • 64. Dimensional Modelling Mr. Sagar Pandya sagar.pandya@medicaps.ac.in  The center of the star consists of the fact table, and the points of the star is dimension tables.  The fact tables in a star schema which is third normal form whereas dimensional tables are de-normalized.  Snowflake Schema  The snowflake schema is an extension of the star schema. In a snowflake schema, each dimension are normalized and connected to more dimension tables.
  • 65. Dimensional Modelling Mr. Sagar Pandya sagar.pandya@medicaps.ac.in  Rules for Dimensional Modelling: Following are the rules and principles of Dimensional Modeling: • Load atomic data into dimensional structures. • Build dimensional models around business processes. • Ensure that all facts in a single fact table are at the same grain or level of detail. • It's essential to store report labels and filter domain values in dimension tables • Need to ensure that dimension tables use a surrogate key • Need to ensure that every fact table has associated dimension table. • Continuously balance requirements and realities to deliver business solution to support their decision-making
  • 66. Dimensional Modelling Mr. Sagar Pandya sagar.pandya@medicaps.ac.in  Benefits of Dimensional Modeling  Standardization of dimensions allows easy reporting across areas of the business.  Dimension tables store the history of the dimensional information.  It allows to introduce entirely new dimension without major disruptions to the fact table.  Dimensional also to store data in such a fashion that it is easier to retrieve the information from the data once the data is stored in the database.  Compared to the normalized model dimensional table are easier to understand.  Information is grouped into clear and simple business categories.  The dimensional model also helps to boost query performance.
  • 67. Dimensional Modelling Mr. Sagar Pandya sagar.pandya@medicaps.ac.in  The dimensional model is very understandable by the business. This model is based on business terms, so that the business knows what each fact, dimension, or attribute means.  It is more denormalized therefore it is optimized for querying. Dimensional models are deformalized and optimized for fast data querying. Many relational database platforms recognize this model and optimize query execution plans to aid in performance.  Dimensional modelling in data warehouse creates a schema which is optimized for high performance. It means fewer joins and helps with minimized data redundancy.  Dimensional models can comfortably accommodate change. Dimension tables can have more columns added to them without affecting existing business intelligence applications using these tables.
  • 68. Multi-dimensional Model Mr. Sagar Pandya sagar.pandya@medicaps.ac.in  A multidimensional model views data in the form of a data-cube.  Mostly, data warehousing supports two or three-dimensional cubes.  A data cube enables data to be modeled and viewed in multiple dimensions. It is defined by dimensions and facts.  A data cube allows data to be viewed in multiple dimensions.  A dimensions are entities with respect to which an organization wants to keep records.  For example in store sales record, dimensions allow the store to keep track of things like monthly sales of items and the branches and locations.  A multidimensional databases helps to provide data-related answers to complex business queries quickly and accurately.
  • 69. Multi-dimensional Model Mr. Sagar Pandya sagar.pandya@medicaps.ac.in  Data warehouses and Online Analytical Processing (OLAP) tools are based on a multidimensional data model.  OLAP in data warehousing enables users to view data from different angles and dimensions.  A multidimensional data model is organized around a central theme, for example, sales.  This theme is represented by a fact table.  Facts are numerical measures.  The fact table contains the names of the facts or measures of the related dimensional tables.  Consider the data of a shop for items sold per quarter in the city of Delhi. The data is shown in the table.
  • 70. Multi-dimensional Model Mr. Sagar Pandya sagar.pandya@medicaps.ac.in  In this 2D representation, the sales for Delhi are shown for the time dimension (organized in quarters) and the item dimension (classified according to the types of an item sold). The fact or measure displayed in rupee_sold (in thousands).
  • 71. Multi-dimensional Model Mr. Sagar Pandya sagar.pandya@medicaps.ac.in  Now, if we want to view the sales data with a third dimension, For example, suppose the data according to time and item, as well as the location is considered for the cities Chennai, Kolkata, Mumbai, and Delhi.  These 3D data are shown in the table. The 3D data of the table are represented as a series of 2D tables.
  • 72. Multi-dimensional Model Mr. Sagar Pandya sagar.pandya@medicaps.ac.in
  • 73. Multi-dimensional Model Mr. Sagar Pandya sagar.pandya@medicaps.ac.in  Conceptually, it may also be represented by the same data in the form of a 3D data cube, as shown in fig:
  • 74. Data Cube  When data is grouped or combined in multidimensional matrices called Data Cubes. The data cube method has a few alternative names or a few variants, such as "Multidimensional databases," "materialized views," and "OLAP (On-Line Analytical Processing)." , Medi-Caps University, Indore
  • 75. Data Cube  Example: In the 2-D representation, we will look at the All Electronics sales data for items sold per quarter in the city of Vancouver. The measured display in dollars sold (in thousands). , Medi-Caps University, Indore
  • 76. Data Cube  3-Dimensional Cuboids  Let suppose we would like to view the sales data with a third dimension. For example, suppose we would like to view the data according to time, item as well as the location for the cities Chicago, New York, Toronto, and Vancouver. The measured display in dollars sold (in thousands). These 3-D data are shown in the table. The 3-D data of the table are represented as a series of 2-D tables. , Medi-Caps University, Indore
  • 77. Data Cube  Conceptually, we may represent the same data in the form of 3-D data cubes, as shown in fig: , Medi-Caps University, Indore
  • 78. Data Cube  Let us suppose that we would like to view our sales data with an additional fourth dimension, such as a supplier.  In data warehousing, the data cubes are n-dimensional.  The cuboid which holds the lowest level of summarization is called a base cuboid.  For example, the 4-D cuboid in the figure is the base cuboid for the given time, item, location, and supplier dimensions.  Figure is shown a 4-D data cube representation of sales data, according to the dimensions time, item, location, and supplier. The measure displayed is dollars sold (in thousands). , Medi-Caps University, Indore
  • 79. Data Cube , Medi-Caps University, Indore
  • 80. Data Cube , Medi-Caps University, Indore  The topmost 0-D cuboid, which holds the highest level of summarization, is known as the apex cuboid.  In this example, this is the total sales, or dollars sold, summarized over all four dimensions.  The lattice of cuboid forms a data cube.  The figure shows the lattice of cuboids creating 4-D data cubes for the dimension time, item, location, and supplier.  Each cuboid represents a different degree of summarization.
  • 81. Data Cube , Medi-Caps University, Indore
  • 82. Summary Mr. Sagar Pandya sagar.pandya@medicaps.ac.in • OLAP is a technology that enables analysts to extract and view business data from different points of view. • At the core of the OLAP concept, is an OLAP Cube. • Various business applications and other data operations require the use of OLAP Cube. • There are primary five types of analytical operations in OLAP 1) Roll-up 2) Drill-down 3) Slice 4) Dice and 5) Pivot • Three types of widely used OLAP systems are MOLAP, ROLAP, and Hybrid OLAP. • Desktop OLAP, Web OLAP, and Mobile OLAP are some other types of OLAP systems.
  • 83. Summary Mr. Sagar Pandya sagar.pandya@medicaps.ac.in • A dimensional model is a data structure technique optimized for Data warehousing tools. • Facts are the measurements/metrics or facts from your business process. • Dimension provides the context surrounding a business process event. • Attributes are the various characteristics of the dimension modelling. • A fact table is a primary table in a dimensional model. • A dimension table contains dimensions of a fact. • There are three types of facts 1. Additive 2. Non-additive 3. Semi- additive • Types of Dimensions are Conformed, Outrigger, Shrunken, Role-playing, Dimension to Dimension Table, Junk, Degenerate, Swappable and Step Dimensions.
  • 84. Summary Mr. Sagar Pandya sagar.pandya@medicaps.ac.in • Five steps of Dimensional modeling are 1. Identify Business Process 2. Identify Grain (level of detail) 3. Identify Dimensions 4. Identify Facts 5. Build Star • For Dimensional modelling in data warehouse, there is a need to ensure that every fact table has an associated date dimension table.
  • 86. Thank You Great God, Medi-Caps, All the attendees Mr. Sagar Pandya sagar.pandya@medicaps.ac.in www.sagarpandya.tk LinkedIn: /in/seapandya Twitter: @seapandya Facebook: /seapandya

Editor's Notes

  1. Sample Slide
  2. Sample Slide
  3. Sample Slide
  4. Sample Slide
  5. Sample Slide
  6. Sample Slide
  7. Sample Slide
  8. Sample Slide
  9. Sample Slide
  10. Sample Slide
  11. Sample Slide
  12. Sample Slide
  13. Sample Slide
  14. Sample Slide
  15. Sample Slide
  16. Sample Slide
  17. Sample Slide
  18. Sample Slide
  19. Sample Slide
  20. Sample Slide
  21. Sample Slide
  22. Sample Slide
  23. Sample Slide
  24. Sample Slide
  25. Sample Slide
  26. Sample Slide
  27. Sample Slide
  28. Sample Slide
  29. Sample Slide
  30. Sample Slide
  31. Sample Slide
  32. Sample Slide
  33. Sample Slide
  34. Sample Slide
  35. Sample Slide
  36. Sample Slide
  37. Sample Slide
  38. Sample Slide
  39. Sample Slide
  40. Sample Slide
  41. Sample Slide
  42. Sample Slide
  43. Sample Slide
  44. Sample Slide
  45. Sample Slide
  46. Sample Slide
  47. Sample Slide
  48. Sample Slide
  49. Sample Slide
  50. Sample Slide
  51. Sample Slide
  52. Sample Slide
  53. Sample Slide
  54. Sample Slide
  55. Sample Slide
  56. Sample Slide
  57. Sample Slide
  58. Sample Slide
  59. Sample Slide
  60. Sample Slide
  61. Sample Slide
  62. Sample Slide
  63. Sample Slide
  64. Sample Slide
  65. Sample Slide
  66. Sample Slide
  67. Sample Slide
  68. Sample Slide
  69. Sample Slide
  70. Sample Slide
  71. Sample Slide
  72. Sample Slide
  73. Sample Slide