Geographic Phenomena and their Representations
•
17 likes•20,910 views

This document provides an overview of geographic phenomena and their representation in GIS systems. It discusses the different types of geographic features such as artificial, natural, and mixed features. It also describes spatial and non-spatial data types. The two main groups of geographic phenomena are fields and objects. Vector and raster data representations are described, including the different vector feature types (points, lines, polygons) and how raster data divides space into a grid. The document concludes with guidelines on choosing between vector and raster data based on the type of analysis or features being represented.

Recommended
More Related Content
What's hot
What's hot (20)
Viewers also liked
Viewers also liked (20)
Similar to Geographic Phenomena and their Representations
Similar to Geographic Phenomena and their Representations (20)
Recently uploaded
Recently uploaded (20)
Geographic Phenomena and their Representations
- 1. Geographical Phenomenon and their representation GIS Training –Day 2 @IOE, Pulchowk
- 2. Presentation Outline Installation of Arc GIS will go in parallel with Demo with real data for yesterday’s lecture Geographical Phenomena Raster and Vector Representation
- 3. Geographic Phenomena Events that takes place in geographic space and time. Choice for a digital representation depends on the type of phenomenon. Can be : Artificial: Buildings Natural: Rivers Mixed Type: Pollution
- 4. Two types of data Data Types Spatial Data Non-spatial or Attribute data Spatial Data Data related to location. Example: Coordinate of center of a football ground Non-spatial Data Describes such aspects of the spatial data which is not specified by its geometry alone. Example: Name of roads, schools, forests etc., Population or census data etc.
- 5. Groups of Geographical Phenomenon Two common groups of geographic phenomena: Fields Objects For every point in the study area, a value can be determined. All changes in field values are gradual. Example: Elevation, Temperature. Well distinguishable discrete entities. Empty spaces in between the features. Study space grouped into mutually exclusive bounded parts. Example: Buildings, Roads
- 6. Putting your data into GIS What original raw data is available? What sort of data manipulation does the application want to perform?
- 8. Vector Representations Represents each Geographic feature by a set of coordinates. An attempt to represent the object as exactly as possible. All positions, lengths, and dimensions to be defined precisely.
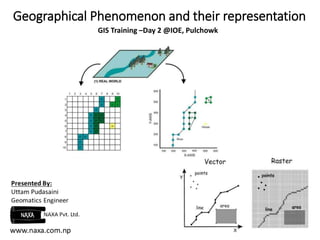
- 9. Types: Point representation Defined as single coordinate pairs (x,y) in 2D and (x, y, z) in 3D Line Representation Defined by 2 end nodes and 0-n internal nodes in between Area Representation Represent each polygon as a set of XY co-ordinates of the boundary TIN Representation
- 10. Raster Representation Entire space is broken into grid cells of a fixed or uniform size. Used Commonly to represent Geographic Fields. Each grid cell is referenced by a row and column number.
- 11. Raster representation with different Cell Size Associating Coordinate System to a Raster data Example: Use of raster data as a thematic data, Land Use
- 12. In a Raster A point is represented by a single grid cell. A line by a number of neighboring cells strung out in given direction. An area by an agglomeration of neighboring cells.
- 13. Comparison VECTOR Complex data Structure Easy association with attribute data Efficient representation of topology Overlay of several vector polygon maps creates difficulties RASTER Simple Data Structure Difficult to associate attribute data Difficult in representing topology. Overlay and combination of data is easier
- 14. REAL WORLD
- 15. However, Both structure are inter-convertible. Conversion from Vector to Raster Is simplest Many well known algorithms exist. Conversion from Raster to Vector Much more complex operation.
- 16. Choice between Vector and Raster Use VECTOR data structures for Geographical objects like buildings ,Roads etc. Network analysis :Transportation networks, Telephone networks etc. Use RASTER methods Representing continuous geographical fields When it is necessary to work with surfaces; Simulation and modeling Spatial analysis ,Map overlays, etc.
- 17. Conclusion
- 18. Reading Materials GIS DATA Formats http://maps.unomaha.edu/Peterson/gis/notes/DataFormatExchange.html Complete Understanding of GIS (http://giscommons.org/ ) Introduction ,Input ,Map Processing ,Data Processing , Analysis and Output