Data Driven Line Graphs
•
1 like•466 views

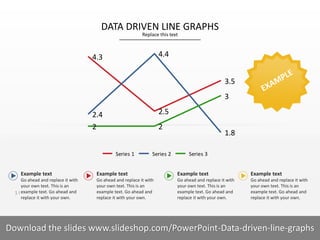
This document appears to be a presentation on data-driven line graphs. It includes examples of line graphs with varying numbers of data points, axes, legends, and time periods. Blank text boxes recommend replacing example text with your own. The presentation concludes by directing the viewer to download additional slides on creating data-driven line graphs.

Recommended
More Related Content
What's hot
What's hot (20)
Viewers also liked
Viewers also liked (20)
Similar to Data Driven Line Graphs
Similar to Data Driven Line Graphs (16)
More from SlideShop.com
More from SlideShop.com (20)
Recently uploaded
Recently uploaded (20)
Data Driven Line Graphs
- 1. COMPANY NAME NAME OF PRESENTER 4.3 2.5 3.5 2.4 4.4 1.8 2 2 3 Example 1 Example 2 Example 3 Series 1 Series 2 Series 3 Example text Go ahead and replace it with your own text. This is an example text. Go ahead and replace it with your own. Example text Go ahead and replace it with your own text. This is an example text. Go ahead and replace it with your own. Example text Go ahead and replace it with your own text. This is an example text. Go ahead and replace it with your own. Example text Go ahead and replace it with your own text. This is an example text. Go ahead and replace it with your own. 1 I DATA DRIVEN LINE GRAPHS Replace this text 1 IDownload the slides www.slideshop.com/PowerPoint-Data-driven-line-graphs
- 2. COMPANY NAME NAME OF PRESENTER 0 1 2 3 4 5 6 7 8 9 10 Example 1 Example 2 Example 3 Series 3 Series 2 Series 1 DATA DRIVEN LINE GRAPHS Replace this text Example text Go ahead and replace it with your own text. This is an example text. Go ahead and replace it with your own. Example text Go ahead and replace it with your own text. This is an example text. Go ahead and replace it with your own. Example text Go ahead and replace it with your own text. This is an example text. Go ahead and replace it with your own. Example text Go ahead and replace it with your own text. This is an example text. Go ahead and replace it with your own. 2 I 2 IDownload the slides www.slideshop.com/PowerPoint-Data-driven-line-graphs
- 3. COMPANY NAME NAME OF PRESENTERCOMPANY NAME NAME OF PRESENTER 0 0.5 1 1.5 2 2.5 3 3.5 4 4.5 5 Example Example Example DATA DRIVEN LINE GRAPHS Replace this text 3 IDownload the slides www.slideshop.com/PowerPoint-Data-driven-line-graphs
- 4. COMPANY NAME NAME OF PRESENTER 4.3 6 8 2.5 5 4 Example Example DATA DRIVEN LINE GRAPHS Replace this text Example text Go ahead and replace it with your own text. This is an example text. Go ahead and replace it with your own. Example text Go ahead and replace it with your own text. This is an example text. Go ahead and replace it with your own. Example text Go ahead and replace it with your own text. This is an example text. Go ahead and replace it with your own. Example text Go ahead and replace it with your own text. This is an example text. Go ahead and replace it with your own. 4 I 4 IDownload the slides www.slideshop.com/PowerPoint-Data-driven-line-graphs
- 5. COMPANY NAME NAME OF PRESENTER Example text •Text example Text example Text example •Replace it with own. Replace it with own •Text example Text example Text example 0 1 2 3 4 5 A B C D Series 1 Series 2 Series 3 DATA DRIVEN LINE GRAPHS Replace this text 5 IDownload the slides www.slideshop.com/PowerPoint-Data-driven-line-graphs
- 6. COMPANY NAME NAME OF PRESENTER Example text 0 1 2 3 4 5 6 7 8 9 2011 2012 2013 2014 2015 2016 Example DATA DRIVEN LINE GRAPHS Replace this text Example text •Text example Text example Text example •Replace it with own. Replace it with own •Text example Text example Text example 6 IDownload the slides www.slideshop.com/PowerPoint-Data-driven-line-graphs
- 7. COMPANY NAME NAME OF PRESENTER Example text •Text example Text example Text example •Replace it with own. Replace it with own •Text example Text example Text example Example text 0% 2% 4% 6% 8% 10% 12% 14% 16% 18% 2011 2012 2013 2014 2015 2016 Example DATA DRIVEN LINE GRAPHS Replace this text 7 IDownload the slides www.slideshop.com/PowerPoint-Data-driven-line-graphs
- 8. COMPANY NAME NAME OF PRESENTER Example 1 Example 2 Example 3 Example 4 5 2 8 6 Example text •Text example Text example Text example •Replace it with own. Replace it with own •Text example Text example Text example •Replace it with own. Replace it with own •Text example Text example Text example •Replace it with own. Replace it with own •Text example Text example Text example •Replace it with own. Replace it with own •Text example Text example Text example •Replace it with own. Replace it with own •Text example Text example Text example •Replace it with own. Replace it with own •Text example Text example Text example •Replace it with own. Replace it with own DATA DRIVEN LINE GRAPHS Replace this text 8 IDownload the slides www.slideshop.com/PowerPoint-Data-driven-line-graphs
- 9. COMPANY NAME NAME OF PRESENTER Example text •Text example Text example Text example •Replace it with own. Replace it with own •Text example Text example Text example •Replace it with own. Replace it with own •Text example Text example Text example •Replace it with own. Replace it with own 0% 10% 20% 30% 40% 50% 60% 70% 80% 90% 100% 1st quarter 2nd quarter 3rd quarter 4th quarter Example text Example text DATA DRIVEN LINE GRAPHS Replace this text 9 IDownload the slides www.slideshop.com/PowerPoint-Data-driven-line-graphs
- 10. COMPANY NAME NAME OF PRESENTER Example 1 Example 2 Example 3 Example 4 Example 5 Example 6 Example 7 Example 8 DATA DRIVEN LINE GRAPHS Replace this text 10 IDownload the slides www.slideshop.com/PowerPoint-Data-driven-line-graphs