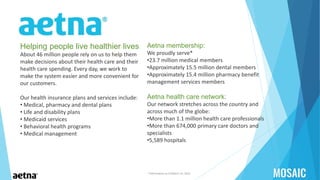
Powered By:
Speakers
Dennis Fusaro
Lead Infrastructure Developer
Daniel Markwat
Infrastructure Developer
Helping people live healthier lives
About 46 million people rely on us to help them
make decisions about their health care and their
health care spending. Every day, we work to
make the system easier and more convenient for
our customers.
Our health insurance plans and services include:
• Medical, pharmacy and dental plans
• Life and disability plans
• Medicaid services
• Behavioral health programs
• Medical management
Aetna membership:
We proudly serve*
•23.7 million medical members
•Approximately 15.5 million dental members
•Approximately 15.4 million pharmacy benefit
management services members
Aetna health care network:
Our network stretches across the country and
across much of the globe:
•More than 1.1 million health care professionals
•More than 674,000 primary care doctors and
specialists
•5,589 hospitals
*information as of March 31, 2015
Use Cases
Finding Data : Data scientists spend too much time finding
correct columns for variable selection.
• On average, column investigation takes 80% of a data scientist’s time
• Time taken was spent meeting with Subject Matter Experts (SMEs)
Shape of Data : Reduce the number of ad-hoc profiling
queries run.
• ~78% of the queries run on the cluster are profiling queries
Tracking Transformations : Data scientists would like to
understand how data sets are derived.
• Transformations are only tracked at a high-level in documentation
Finding Data: Challenges
Hive requires manual traversal of the schema to find tables
or columns
HDFS requires traversal of the directory listing to find a
file
External documentation of the locations of data become
stale and unreliable as data changes
No practical means to add additional metadata
Finding Data: Solutions
Capture Hive & HDFS metadata during
runtime and store in a repository
Provide an API to interactively search &
query the metadata
Provide an API to enrich the logical metadata
with business context
Metadata Repository
Physical Metadata
Business Metadata
Metadata Repository
Physical Metadata
Business Metadata
HDFS
Sqoop
Hive
Metadata Repository
Physical Metadata
Business Metadata
HDFS
Sqoop
Hive
Apache
Atlas
Metadata Repository
Physical Metadata
Business Metadata
HDFS
Sqoop
Hive
Apache
Atlas
Use Cases
Finding Data : Data scientists spend too much time finding
correct columns for variable selection.
• On average, column investigation takes 80% of a data scientist’s time
• Time taken was spent meeting with Subject Matter Experts (SMEs)
Shape of Data : Reduce the number of ad-hoc profiling queries
run.
• ~78% of the queries run on the cluster are profiling queries
Tracking Transformations : Data scientists would like to
understand how data sets are derived.
• Transformations are only tracked at a high-level in documentation
Production Query Breakdown
4%
18%
78%
Average Daily Queries
Production
Exploratory
Profiling
Shape of Data: Challenges
Constantly accessing hive metastore for
basic stats was affecting production running
jobs
The limited number of stats in the default
Metastore was not sufficient to make an
accurate assessment of the shape of the data
Shape of Data: Solutions
Create a system to store profiling data that
can be cross referenced with the physical
and business metadata
Create an extensible framework for data
scientists to create and add new profiling
Use Cases
Finding Data : Data scientists spend too much time finding
correct columns for variable selection.
• On average, column investigation takes 80% of a data scientist’s time
• Time taken was spent meeting with Subject Matter Experts (SMEs)
Shape of Data : Reduce the number of ad-hoc profiling
queries run.
• ~78% of the queries run on the cluster are profiling queries
Tracking Transformations : Data scientists would like to
understand how data sets are derived.
• Transformations are only tracked at a high-level in documentation
Tracking Transformations: Challenges
Documenting transformations is a manual
task and cannot be done at scale
No mechanism for auditing data
pipelines
Identifying data quality and provenance
is a manual effort
Tracking Transformations: Solutions
Leverage the metadata captured for search
to construct the flow of the transformations
Provide an API for interrogating
transformation executions
Provide a means for visualizing
transformations from source to current state
Mosaic
Mosaic simplifies the big data environment by providing a familiar search experience.
 Search
 If you know how to search Google or Amazon you can search Mosaic.
 Search returns your most relevant results found in Hive or HDFS and displays them in
an easy to understand format.
 Get the right data, right away by refining your results using suggested filters.
 See business definitions and comments from other users to bring clarity to the data.
 Data Profiling
 Profiling stores metrics about the data you are browsing (i.e. max, min, and the
distribution of a column).
 Lineage
 Sometimes where you’re going depends on where you’ve been. Explore the lineage
tabs to see where your data came from, including if it came from external systems.
 Pull back the covers on derived tables and see the transformation logic that built
them.
Live Demo
Powered By:
We want your feedback!
Please Rate & Review on the Hadoop Summit App

Data Discovery & Lineage in Enterprise Hadoop

  • 1.
  • 2.
    Speakers Dennis Fusaro Lead InfrastructureDeveloper Daniel Markwat Infrastructure Developer
  • 3.
    Helping people livehealthier lives About 46 million people rely on us to help them make decisions about their health care and their health care spending. Every day, we work to make the system easier and more convenient for our customers. Our health insurance plans and services include: • Medical, pharmacy and dental plans • Life and disability plans • Medicaid services • Behavioral health programs • Medical management Aetna membership: We proudly serve* •23.7 million medical members •Approximately 15.5 million dental members •Approximately 15.4 million pharmacy benefit management services members Aetna health care network: Our network stretches across the country and across much of the globe: •More than 1.1 million health care professionals •More than 674,000 primary care doctors and specialists •5,589 hospitals *information as of March 31, 2015
  • 4.
    Use Cases Finding Data: Data scientists spend too much time finding correct columns for variable selection. • On average, column investigation takes 80% of a data scientist’s time • Time taken was spent meeting with Subject Matter Experts (SMEs) Shape of Data : Reduce the number of ad-hoc profiling queries run. • ~78% of the queries run on the cluster are profiling queries Tracking Transformations : Data scientists would like to understand how data sets are derived. • Transformations are only tracked at a high-level in documentation
  • 5.
    Use Cases Finding Data: Data scientists spend too much time finding correct columns for variable selection. • On average, column investigation takes 80% of a data scientist’s time • Time taken was spent meeting with Subject Matter Experts (SMEs) Shape of Data : Reduce the number of ad-hoc profiling queries run. • ~78% of the queries run on the cluster are profiling queries Tracking Transformations : Data scientists would like to understand how data sets are derived. • Transformations are only tracked at a high-level in documentation
  • 6.
    Finding Data: Challenges Hiverequires manual traversal of the schema to find tables or columns HDFS requires traversal of the directory listing to find a file External documentation of the locations of data become stale and unreliable as data changes No practical means to add additional metadata
  • 7.
    Finding Data: Solutions CaptureHive & HDFS metadata during runtime and store in a repository Provide an API to interactively search & query the metadata Provide an API to enrich the logical metadata with business context
  • 8.
  • 9.
  • 10.
    Metadata Repository Physical Metadata BusinessMetadata HDFS Sqoop Hive Apache Atlas
  • 11.
    Metadata Repository Physical Metadata BusinessMetadata HDFS Sqoop Hive Apache Atlas
  • 12.
    Use Cases Finding Data: Data scientists spend too much time finding correct columns for variable selection. • On average, column investigation takes 80% of a data scientist’s time • Time taken was spent meeting with Subject Matter Experts (SMEs) Shape of Data : Reduce the number of ad-hoc profiling queries run. • ~78% of the queries run on the cluster are profiling queries Tracking Transformations : Data scientists would like to understand how data sets are derived. • Transformations are only tracked at a high-level in documentation
  • 13.
    Production Query Breakdown 4% 18% 78% AverageDaily Queries Production Exploratory Profiling
  • 14.
    Shape of Data:Challenges Constantly accessing hive metastore for basic stats was affecting production running jobs The limited number of stats in the default Metastore was not sufficient to make an accurate assessment of the shape of the data
  • 15.
    Shape of Data:Solutions Create a system to store profiling data that can be cross referenced with the physical and business metadata Create an extensible framework for data scientists to create and add new profiling
  • 16.
    Use Cases Finding Data: Data scientists spend too much time finding correct columns for variable selection. • On average, column investigation takes 80% of a data scientist’s time • Time taken was spent meeting with Subject Matter Experts (SMEs) Shape of Data : Reduce the number of ad-hoc profiling queries run. • ~78% of the queries run on the cluster are profiling queries Tracking Transformations : Data scientists would like to understand how data sets are derived. • Transformations are only tracked at a high-level in documentation
  • 17.
    Tracking Transformations: Challenges Documentingtransformations is a manual task and cannot be done at scale No mechanism for auditing data pipelines Identifying data quality and provenance is a manual effort
  • 18.
    Tracking Transformations: Solutions Leveragethe metadata captured for search to construct the flow of the transformations Provide an API for interrogating transformation executions Provide a means for visualizing transformations from source to current state
  • 19.
    Mosaic Mosaic simplifies thebig data environment by providing a familiar search experience.  Search  If you know how to search Google or Amazon you can search Mosaic.  Search returns your most relevant results found in Hive or HDFS and displays them in an easy to understand format.  Get the right data, right away by refining your results using suggested filters.  See business definitions and comments from other users to bring clarity to the data.  Data Profiling  Profiling stores metrics about the data you are browsing (i.e. max, min, and the distribution of a column).  Lineage  Sometimes where you’re going depends on where you’ve been. Explore the lineage tabs to see where your data came from, including if it came from external systems.  Pull back the covers on derived tables and see the transformation logic that built them.
  • 20.
  • 21.
    Powered By: We wantyour feedback! Please Rate & Review on the Hadoop Summit App