Download as PDF, PPTX
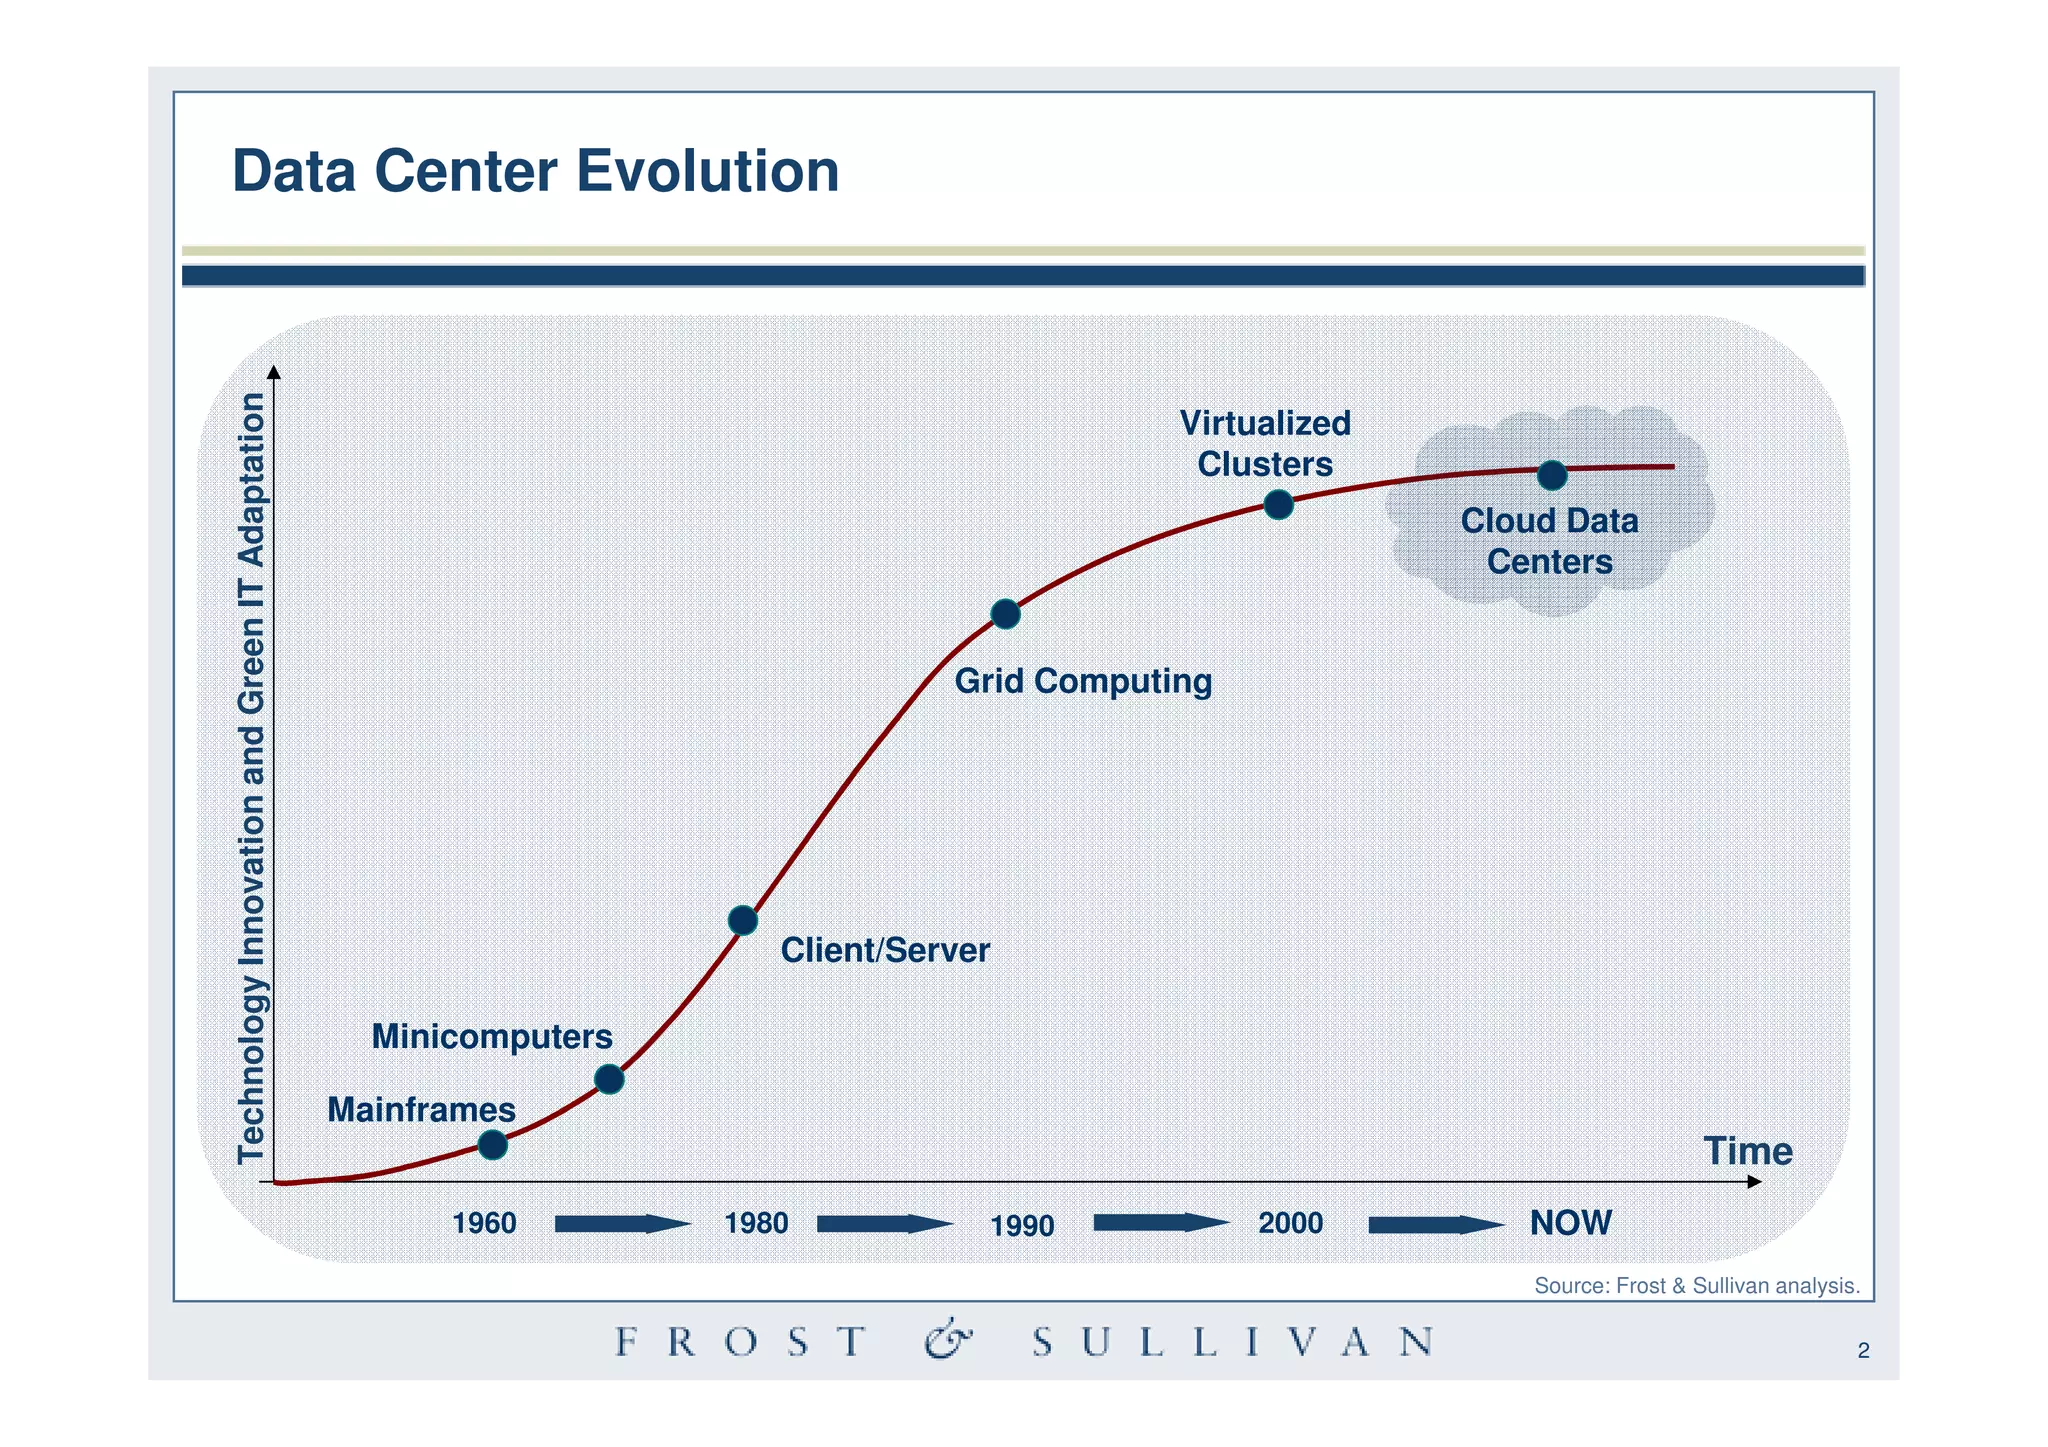
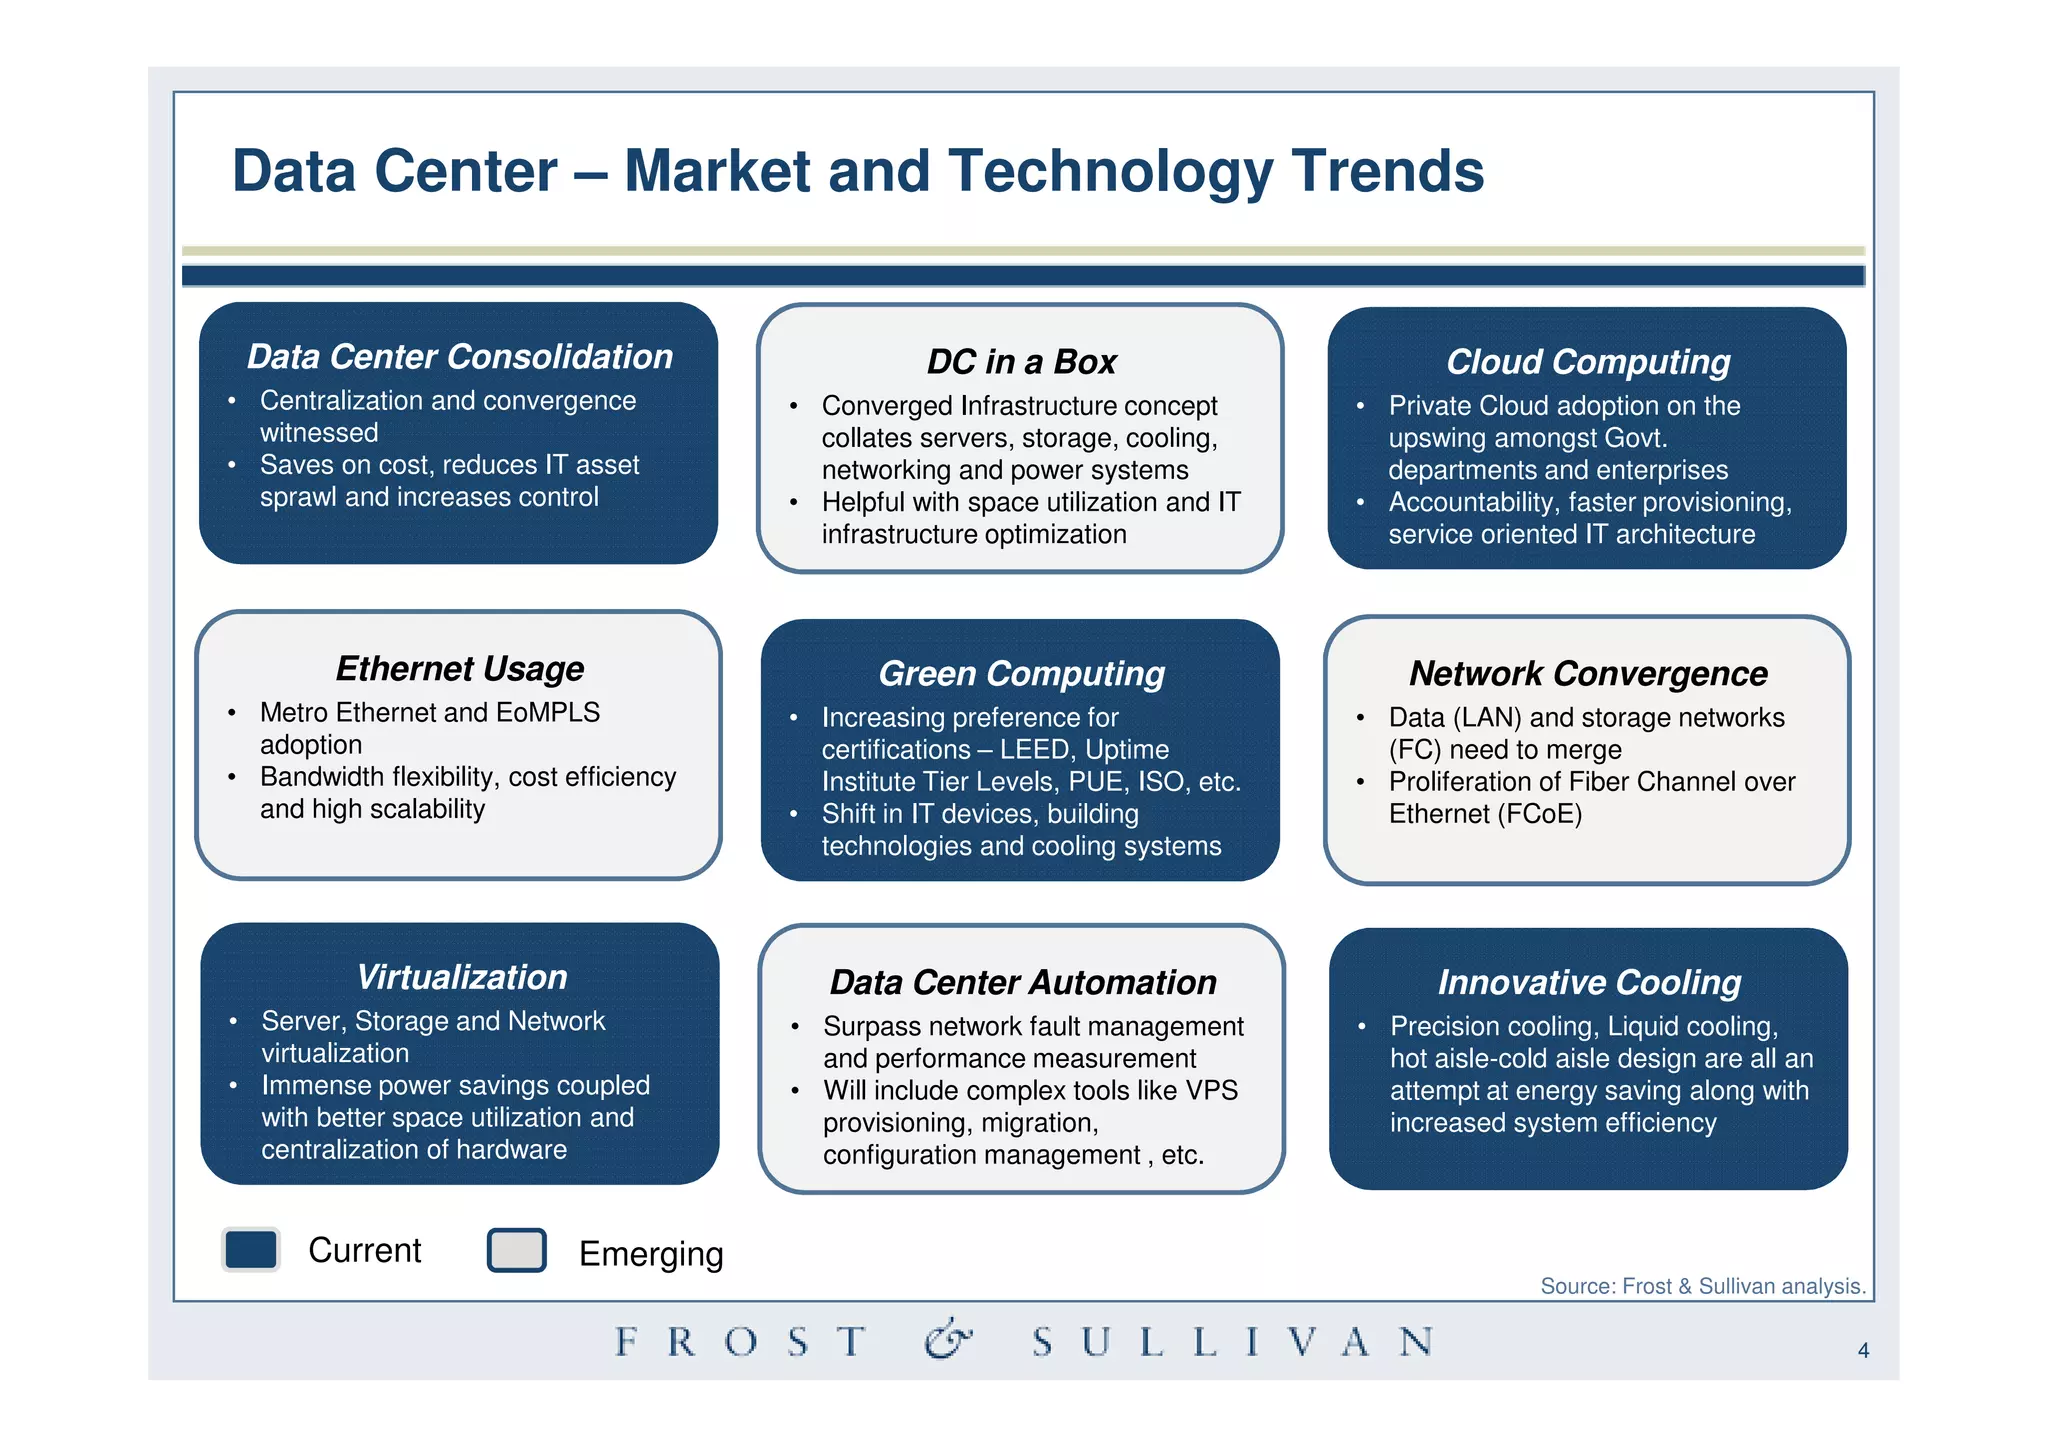
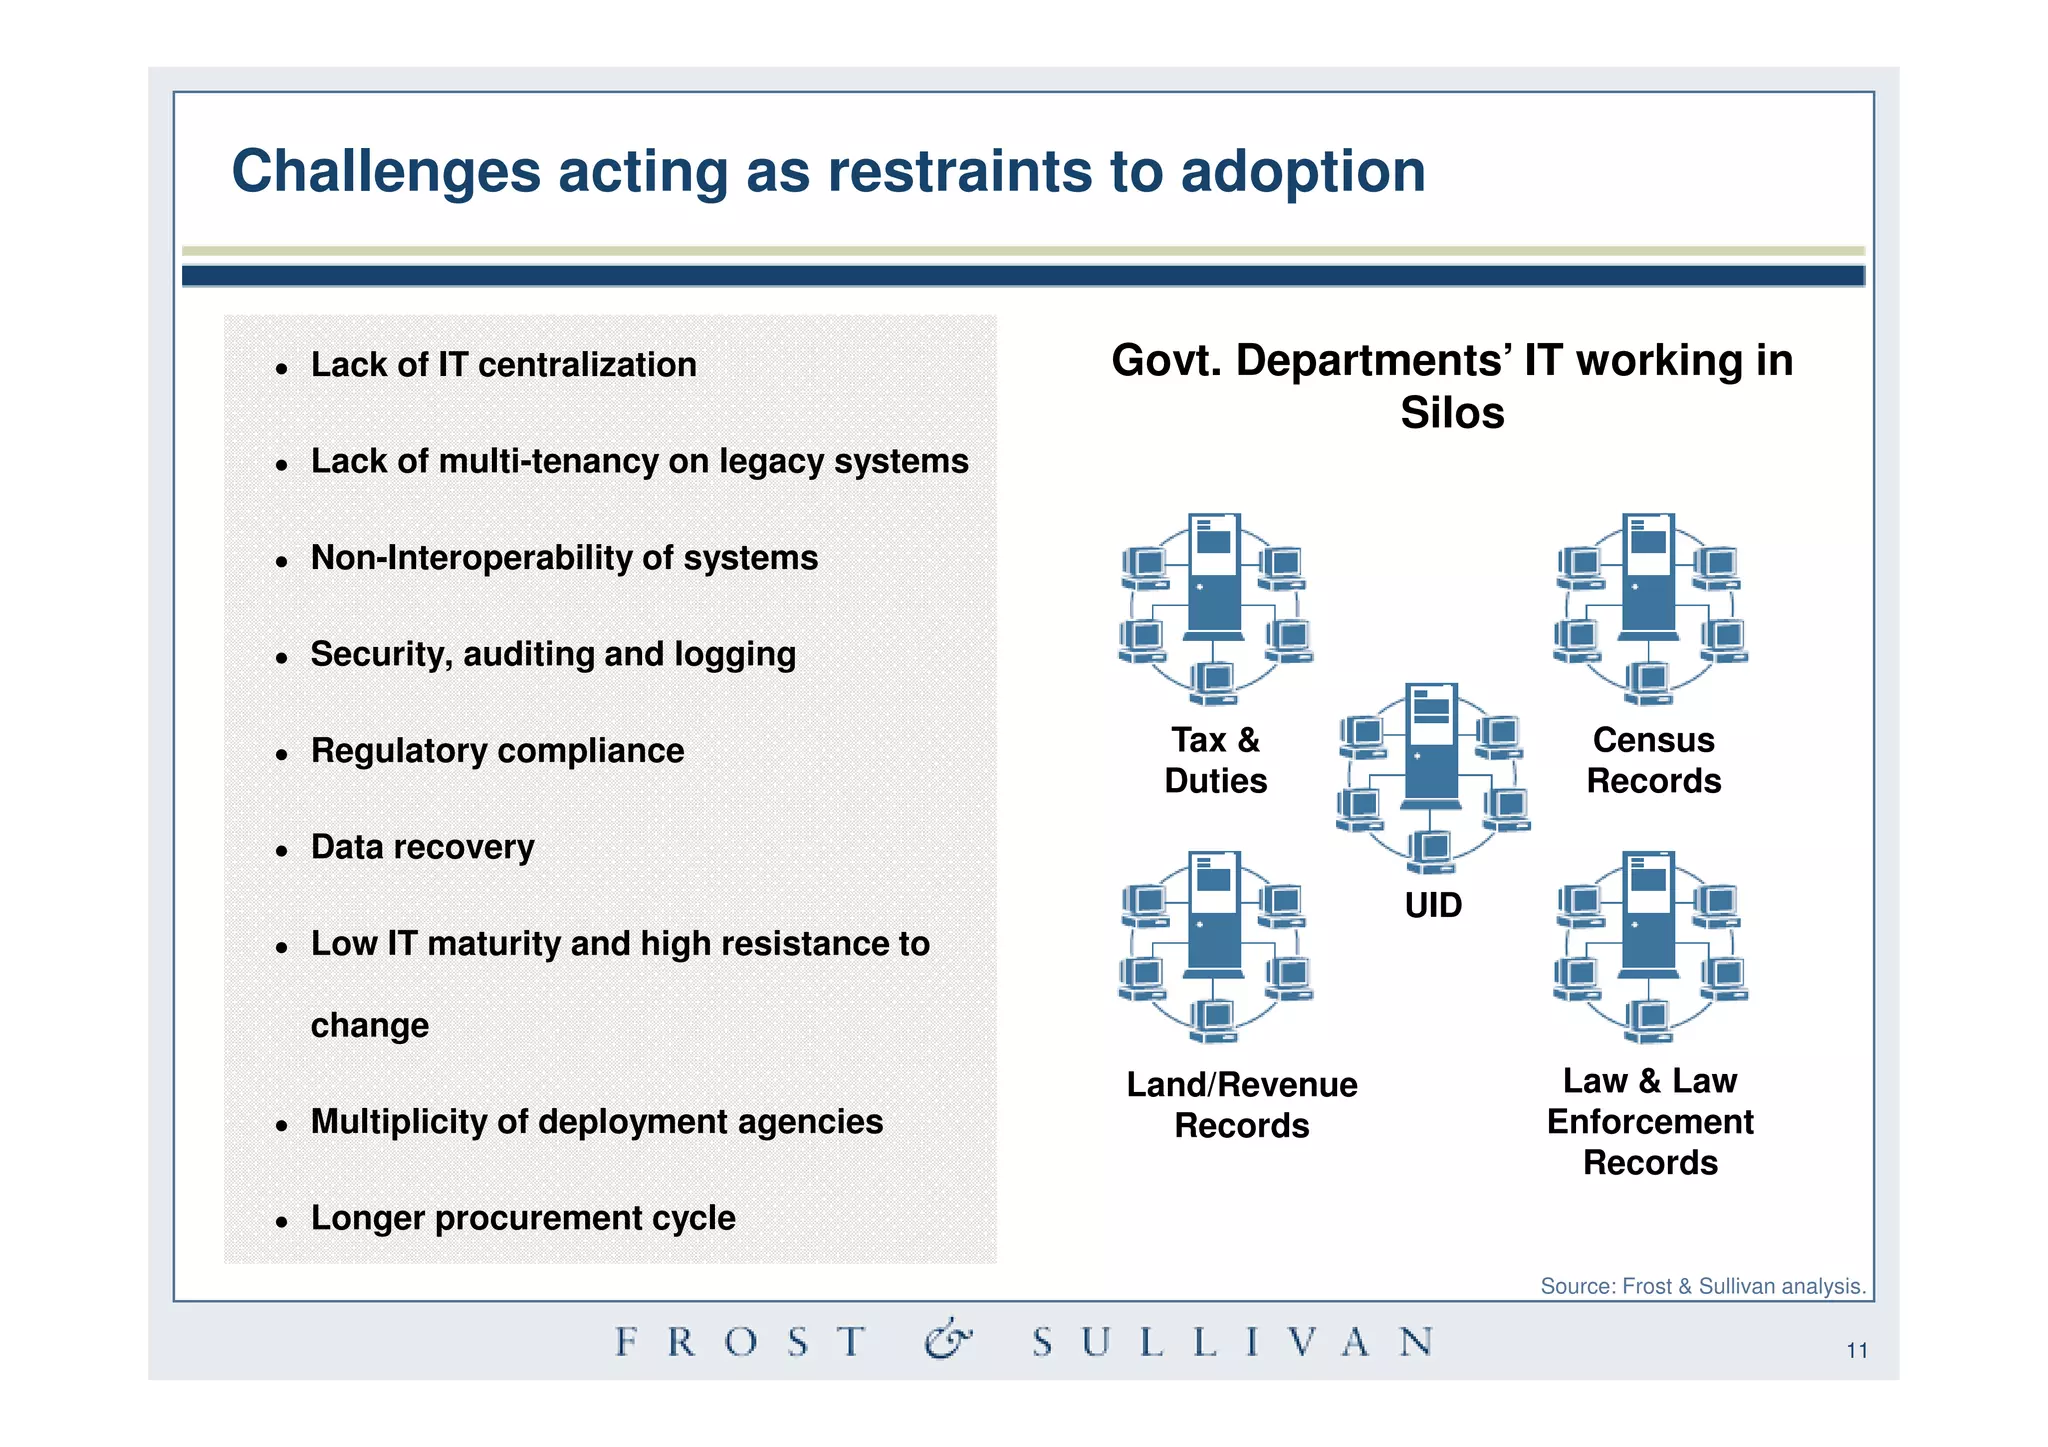

The document summarizes the evolution of data centers from mainframes to modern cloud computing models. It discusses key trends driving the data center industry such as consolidation, virtualization, private and public clouds, and green computing. The document also analyzes data center adoption across different government sectors in India and initiatives to improve efficiency through centralized infrastructure and cloud computing. Challenges to government cloud adoption include lack of standardization, security concerns, and resistance to change.


![Coded Agents – with UiPath SDK + LangGraph [Virtual Hands-on Workshop]](https://cdn.slidesharecdn.com/ss_thumbnails/codedagentsdeck-251215155422-5497c599-thumbnail.jpg?width=640&height=640&fit=bounds)


