Download to read offline
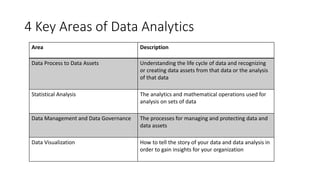
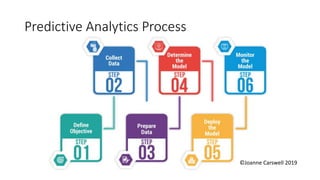
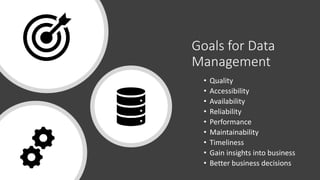
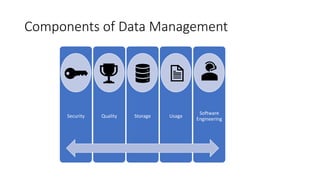
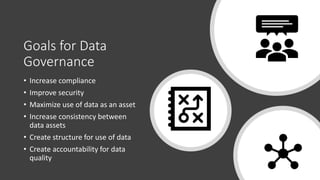
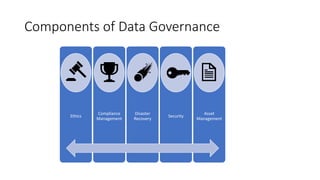
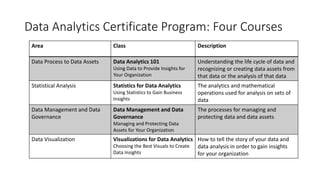


The document outlines the significance of data analytics in digital business and business process management, highlighting four key areas: data process to assets, statistical analysis, data management and governance, and data visualization. It emphasizes the role of analytics in informed decision-making, competitive advantage through technologies, and various types of data analytics such as descriptive, diagnostic, predictive, and prescriptive. Additionally, it discusses goals and components of data management and governance, and introduces a data analytics certificate program aimed at enhancing business insights.