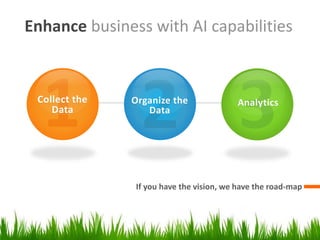
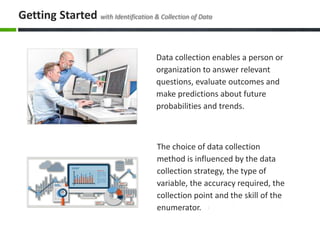
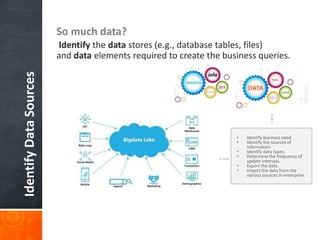
artificial intelligence at work
introducing
DATA ANALYTICS
www.SysDiva.com
Enhance business with AI capabilities
If you have the vision, we have the road-map
Collect the
Data
Organize the
Data
Analytics
Data Collection
Design, organize, and collaborate
The choice of data collection
method is influenced by the data
collection strategy, the type of
variable, the accuracy required, the
collection point and the skill of the
enumerator.
Data collection enables a person or
organization to answer relevant
questions, evaluate outcomes and
make predictions about future
probabilities and trends.
Getting Started with Identification & Collection of Data
IdentifyDataSources So much data?
Identify the data stores (e.g., database tables, files)
and data elements required to create the business queries.
• Identify business need.
• Identify the sources of
information.
• Identify data types.
• Determine the frequency of
update intervals.
• Export the data.
• Import the data from the
various sources in enterprise.
Stakeholders or data owners of various data
groups of any business be it inter-
departments, vendors, customers - their
contribution to the relevant information and
access plays a vital role
It’s about team work, and co-ownership will
get the success.
Collaboration
Organize the data
Stylize, edit, or re-factoring the data
It’s not just about the visuals, but strengthening
Cross-industry studies show that on average, less than half
of an organization’s structured data is actively used in
making decisions—
 and less than 1% of its unstructured data is analysed or
used at all.
 More than 70% of employees have access to data they
should not, and
 80% of analysts’ time is spent simply discovering and
preparing data.
 Data breaches are common,
 rogue data sets propagate in silos, and
 companies’ data technology often isn’t up to the
demands put on it.
Source – Harvard Business Review, June 2017
Your Business or Enterprise,
is a pure amalgamation of information acquired by you over years in various forms
starting from your education, then putting it to professional use, converting to
business contacts, signing up customers & suppliers, fetching good prices, giving
quotations and winning more businesses!
Does it actually end here?
This entire information is at stake if not organized!
What is at stake? – not just the data, it’s the business!
• Data
 The raw material of
information
• Information
 Data organized and
presented by someone
• Knowledge
 Information read, heard
or seen and understood
and integrated
• Wisdom
 Distilled knowledge and
understanding which
can lead to decision
From Data to Wisdom
What is this transition and how does it work?
lets take the business to the next level with new evolved & continuously evolving technology…
lets move on...
Analytics
Broadcast and compress for seamless flow of reports and information
Data Analytics,
also known as data-driven science, is an interdisciplinary field about scientific
methods, processes, and systems to extract knowledge or insights from data in
various forms, either structured or unstructured, similar to data mining!
Then, what happens?
In the process of examine the data sets in order to draw conclusions about the information they contain,
increasingly with the aid of specialized systems and software.
Data Analytics – know it better, for the business!
» Show and tell your presentation with
Broadcast Slide Show
» Share your reports in real-time with
respective user.
» You’ll never have to say,
» “give me some, please”,
» “I am still working on it”, etc.
» again!
BROADCAST IT
Complete control over data
no more productive hours wastages in data
compilation, and much more.
Your business’s eyes and ears are just a call away!
Business projections are critical at the
time and moment when needed
however data compilation makes
either the information based on stale
data or for a real-time data the
reports delay!
Realistic business
projections when needed!
Package your presentation
with real-time data
?
But wait…
There’s More!
You just access your reports and MISs wherever you are at your convenience!
» The data analytics give
a New Direction to your Business
» You access reports wherever you are
Access Anywhere
Artificial Intelligence at work
What’s Your Message?THANK YOU!
www.SysDiva.com
+91 120 422 6774
Mktg@SysDiva.com
1st Floor, C-108, Sector 2, Noida, UP – 201301, INDIA.

Data Analyics

  • 1.
    artificial intelligence atwork introducing DATA ANALYTICS www.SysDiva.com
  • 2.
    Enhance business withAI capabilities If you have the vision, we have the road-map Collect the Data Organize the Data Analytics
  • 3.
  • 4.
    The choice ofdata collection method is influenced by the data collection strategy, the type of variable, the accuracy required, the collection point and the skill of the enumerator. Data collection enables a person or organization to answer relevant questions, evaluate outcomes and make predictions about future probabilities and trends. Getting Started with Identification & Collection of Data
  • 5.
    IdentifyDataSources So muchdata? Identify the data stores (e.g., database tables, files) and data elements required to create the business queries. • Identify business need. • Identify the sources of information. • Identify data types. • Determine the frequency of update intervals. • Export the data. • Import the data from the various sources in enterprise.
  • 6.
    Stakeholders or dataowners of various data groups of any business be it inter- departments, vendors, customers - their contribution to the relevant information and access plays a vital role It’s about team work, and co-ownership will get the success. Collaboration
  • 7.
    Organize the data Stylize,edit, or re-factoring the data
  • 8.
    It’s not justabout the visuals, but strengthening Cross-industry studies show that on average, less than half of an organization’s structured data is actively used in making decisions—  and less than 1% of its unstructured data is analysed or used at all.  More than 70% of employees have access to data they should not, and  80% of analysts’ time is spent simply discovering and preparing data.  Data breaches are common,  rogue data sets propagate in silos, and  companies’ data technology often isn’t up to the demands put on it. Source – Harvard Business Review, June 2017
  • 9.
    Your Business orEnterprise, is a pure amalgamation of information acquired by you over years in various forms starting from your education, then putting it to professional use, converting to business contacts, signing up customers & suppliers, fetching good prices, giving quotations and winning more businesses! Does it actually end here? This entire information is at stake if not organized! What is at stake? – not just the data, it’s the business! • Data  The raw material of information • Information  Data organized and presented by someone • Knowledge  Information read, heard or seen and understood and integrated • Wisdom  Distilled knowledge and understanding which can lead to decision From Data to Wisdom
  • 10.
    What is thistransition and how does it work? lets take the business to the next level with new evolved & continuously evolving technology… lets move on...
  • 11.
    Analytics Broadcast and compressfor seamless flow of reports and information
  • 12.
    Data Analytics, also knownas data-driven science, is an interdisciplinary field about scientific methods, processes, and systems to extract knowledge or insights from data in various forms, either structured or unstructured, similar to data mining! Then, what happens? In the process of examine the data sets in order to draw conclusions about the information they contain, increasingly with the aid of specialized systems and software. Data Analytics – know it better, for the business!
  • 13.
    » Show andtell your presentation with Broadcast Slide Show » Share your reports in real-time with respective user. » You’ll never have to say, » “give me some, please”, » “I am still working on it”, etc. » again! BROADCAST IT
  • 14.
    Complete control overdata no more productive hours wastages in data compilation, and much more. Your business’s eyes and ears are just a call away!
  • 15.
    Business projections arecritical at the time and moment when needed however data compilation makes either the information based on stale data or for a real-time data the reports delay! Realistic business projections when needed! Package your presentation with real-time data
  • 16.
    ? But wait… There’s More! Youjust access your reports and MISs wherever you are at your convenience!
  • 17.
    » The dataanalytics give a New Direction to your Business » You access reports wherever you are Access Anywhere
  • 18.
  • 19.
    What’s Your Message?THANKYOU! www.SysDiva.com +91 120 422 6774 Mktg@SysDiva.com 1st Floor, C-108, Sector 2, Noida, UP – 201301, INDIA.

Editor's Notes

  • #2 SysDiva an Indian IT startup with its inception in December 2014 and started operating since March 2015. A team of 15 members in SysDiva family headed by the Founder & Director Mr Umang Sagar Jain, a passionate technocrat! For more sample templates, click the File tab, and then on the New tab, click Sample Templates.
  • #3 Absorption of customer needs is one of most critical aspect which is needed to be mapped with the expected results to be delivered. Three major steps play a vital role in this direction – Collection of Data, Organizing the same data and then analyzing the with various combinations and trends of the past business to visualize future projection!
  • #4 The present design of data; its absorption to organize it in the desired framework for the further collaborations