Data Analysis Workshop and Kaggle Competition - 2025-08-28
1.
Giovedì 28 Agosto2025
@PyDataVenice #22 #Meetup #PyData
in presenza e in streaming
alle ore 19:00
Venice
Alessandra Bilardi
Data / Automation Specialist
@ Corley Cloud
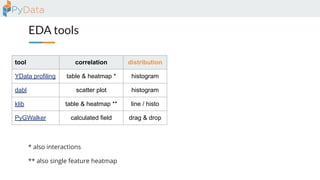
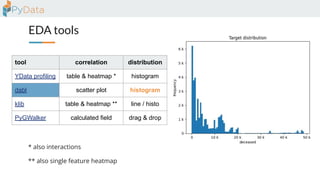
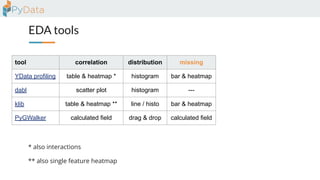
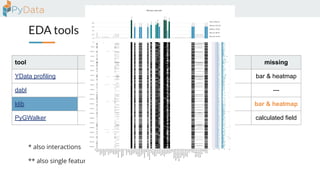
Exploratory Data Analysis
on a Kaggle competition
#DataAnalysis
#Workshop
Form: Is apie chart or a bar chart better ?
1. [pie|bar]
11.
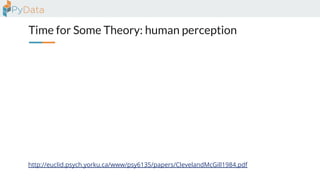
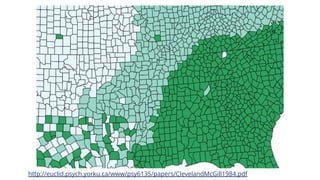
Time for SomeTheory: human perception
http://euclid.psych.yorku.ca/www/psy6135/papers/ClevelandMcGill1984.pdf
12.
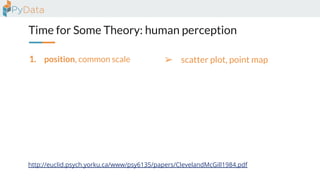
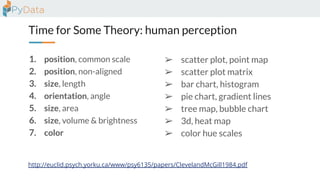
Time for SomeTheory: human perception
1. position, common scale
http://euclid.psych.yorku.ca/www/psy6135/papers/ClevelandMcGill1984.pdf
➢ scatter plot, point map
13.
Time for SomeTheory: human perception
1. position, common scale
2. position, non-aligned
http://euclid.psych.yorku.ca/www/psy6135/papers/ClevelandMcGill1984.pdf
➢ scatter plot, point map
➢ scatter plot matrix
14.
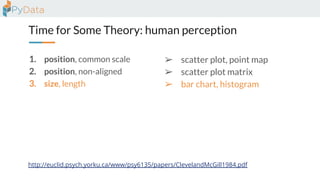
Time for SomeTheory: human perception
1. position, common scale
2. position, non-aligned
3. size, length
http://euclid.psych.yorku.ca/www/psy6135/papers/ClevelandMcGill1984.pdf
➢ scatter plot, point map
➢ scatter plot matrix
➢ bar chart, histogram
15.
Time for SomeTheory: human perception
1. position, common scale
2. position, non-aligned
3. size, length
4. orientation, angle
http://euclid.psych.yorku.ca/www/psy6135/papers/ClevelandMcGill1984.pdf
➢ scatter plot, point map
➢ scatter plot matrix
➢ bar chart, histogram
➢ pie chart, gradient lines
16.
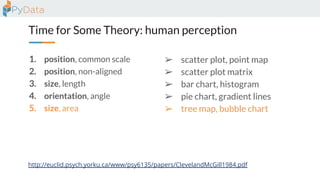
Time for SomeTheory: human perception
1. position, common scale
2. position, non-aligned
3. size, length
4. orientation, angle
5. size, area
http://euclid.psych.yorku.ca/www/psy6135/papers/ClevelandMcGill1984.pdf
➢ scatter plot, point map
➢ scatter plot matrix
➢ bar chart, histogram
➢ pie chart, gradient lines
➢ tree map, bubble chart
17.
Time for SomeTheory: human perception
1. position, common scale
2. position, non-aligned
3. size, length
4. orientation, angle
5. size, area
6. size, volume & brightness
http://euclid.psych.yorku.ca/www/psy6135/papers/ClevelandMcGill1984.pdf
➢ scatter plot, point map
➢ scatter plot matrix
➢ bar chart, histogram
➢ pie chart, gradient lines
➢ tree map, bubble chart
➢ 3d, heat map
18.
Time for SomeTheory: human perception
1. position, common scale
2. position, non-aligned
3. size, length
4. orientation, angle
5. size, area
6. size, volume & brightness
7. color
http://euclid.psych.yorku.ca/www/psy6135/papers/ClevelandMcGill1984.pdf
➢ scatter plot, point map
➢ scatter plot matrix
➢ bar chart, histogram
➢ pie chart, gradient lines
➢ tree map, bubble chart
➢ 3d, heat map
➢ color hue scales
19.
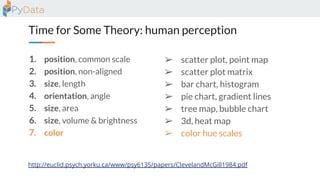
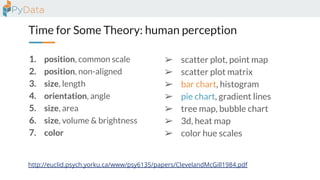
Time for SomeTheory: human perception
1. position, common scale
2. position, non-aligned
3. size, length
4. orientation, angle
5. size, area
6. size, volume & brightness
7. color
http://euclid.psych.yorku.ca/www/psy6135/papers/ClevelandMcGill1984.pdf
➢ scatter plot, point map
➢ scatter plot matrix
➢ bar chart, histogram
➢ pie chart, gradient lines
➢ tree map, bubble chart
➢ 3d, heat map
➢ color hue scales


![Form: Networking post meetup ?
1. [online|presence]
2. [yes|no]](https://image.slidesharecdn.com/pydatavenice22-250924143610-32a8acdf/85/Data-Analysis-Workshop-and-Kaggle-Competition-2025-08-28-8-320.jpg)
![Form: First step to analyze a data file ?
1. [one word]](https://image.slidesharecdn.com/pydatavenice22-250924143610-32a8acdf/85/Data-Analysis-Workshop-and-Kaggle-Competition-2025-08-28-9-320.jpg)
![Form: Is a pie chart or a bar chart better ?
1. [pie|bar]](https://image.slidesharecdn.com/pydatavenice22-250924143610-32a8acdf/85/Data-Analysis-Workshop-and-Kaggle-Competition-2025-08-28-10-320.jpg)


![Form: What you need before you start doing EDA ?
1. [one word]](https://image.slidesharecdn.com/pydatavenice22-250924143610-32a8acdf/85/Data-Analysis-Workshop-and-Kaggle-Competition-2025-08-28-43-320.jpg)


![제 23회 보아즈(BOAZ) 빅데이터 컨퍼런스 - [MBOAX] : ABSA를 활용한 소비자 반응 분석 기반 운영 효율화 대시보드 설계](https://cdn.slidesharecdn.com/ss_thumbnails/3-1boaz23rdconferencemboax-260203102709-9d519923-thumbnail.jpg?width=640&height=640&fit=bounds)


