PyCon Italia 2025
Timefor Some Theory: human perception
http://euclid.psych.yorku.ca/www/psy6135/papers/ClevelandMcGill1984.pdf
18.
PyCon Italia 2025
Timefor Some Theory: human perception
1. position, common scale
http://euclid.psych.yorku.ca/www/psy6135/papers/ClevelandMcGill1984.pdf
➢ scatter plot, point map
19.
PyCon Italia 2025
Timefor Some Theory: human perception
1. position, common scale
2. position, non-aligned
http://euclid.psych.yorku.ca/www/psy6135/papers/ClevelandMcGill1984.pdf
➢ scatter plot, point map
➢ scatter plot matrix
20.
PyCon Italia 2025
Timefor Some Theory: human perception
1. position, common scale
2. position, non-aligned
3. size, length
http://euclid.psych.yorku.ca/www/psy6135/papers/ClevelandMcGill1984.pdf
➢ scatter plot, point map
➢ scatter plot matrix
➢ bar chart, histogram
21.
PyCon Italia 2025
Timefor Some Theory: human perception
1. position, common scale
2. position, non-aligned
3. size, length
4. orientation, angle
http://euclid.psych.yorku.ca/www/psy6135/papers/ClevelandMcGill1984.pdf
➢ scatter plot, point map
➢ scatter plot matrix
➢ bar chart, histogram
➢ pie chart, gradient lines
22.
PyCon Italia 2025
Timefor Some Theory: human perception
1. position, common scale
2. position, non-aligned
3. size, length
4. orientation, angle
5. size, area
http://euclid.psych.yorku.ca/www/psy6135/papers/ClevelandMcGill1984.pdf
➢ scatter plot, point map
➢ scatter plot matrix
➢ bar chart, histogram
➢ pie chart, gradient lines
➢ tree map, bubble chart
23.
PyCon Italia 2025
Timefor Some Theory: human perception
1. position, common scale
2. position, non-aligned
3. size, length
4. orientation, angle
5. size, area
6. size, volume & brightness
http://euclid.psych.yorku.ca/www/psy6135/papers/ClevelandMcGill1984.pdf
➢ scatter plot, point map
➢ scatter plot matrix
➢ bar chart, histogram
➢ pie chart, gradient lines
➢ tree map, bubble chart
➢ 3d, heat map
24.
PyCon Italia 2025
Timefor Some Theory: human perception
1. position, common scale
2. position, non-aligned
3. size, length
4. orientation, angle
5. size, area
6. size, volume & brightness
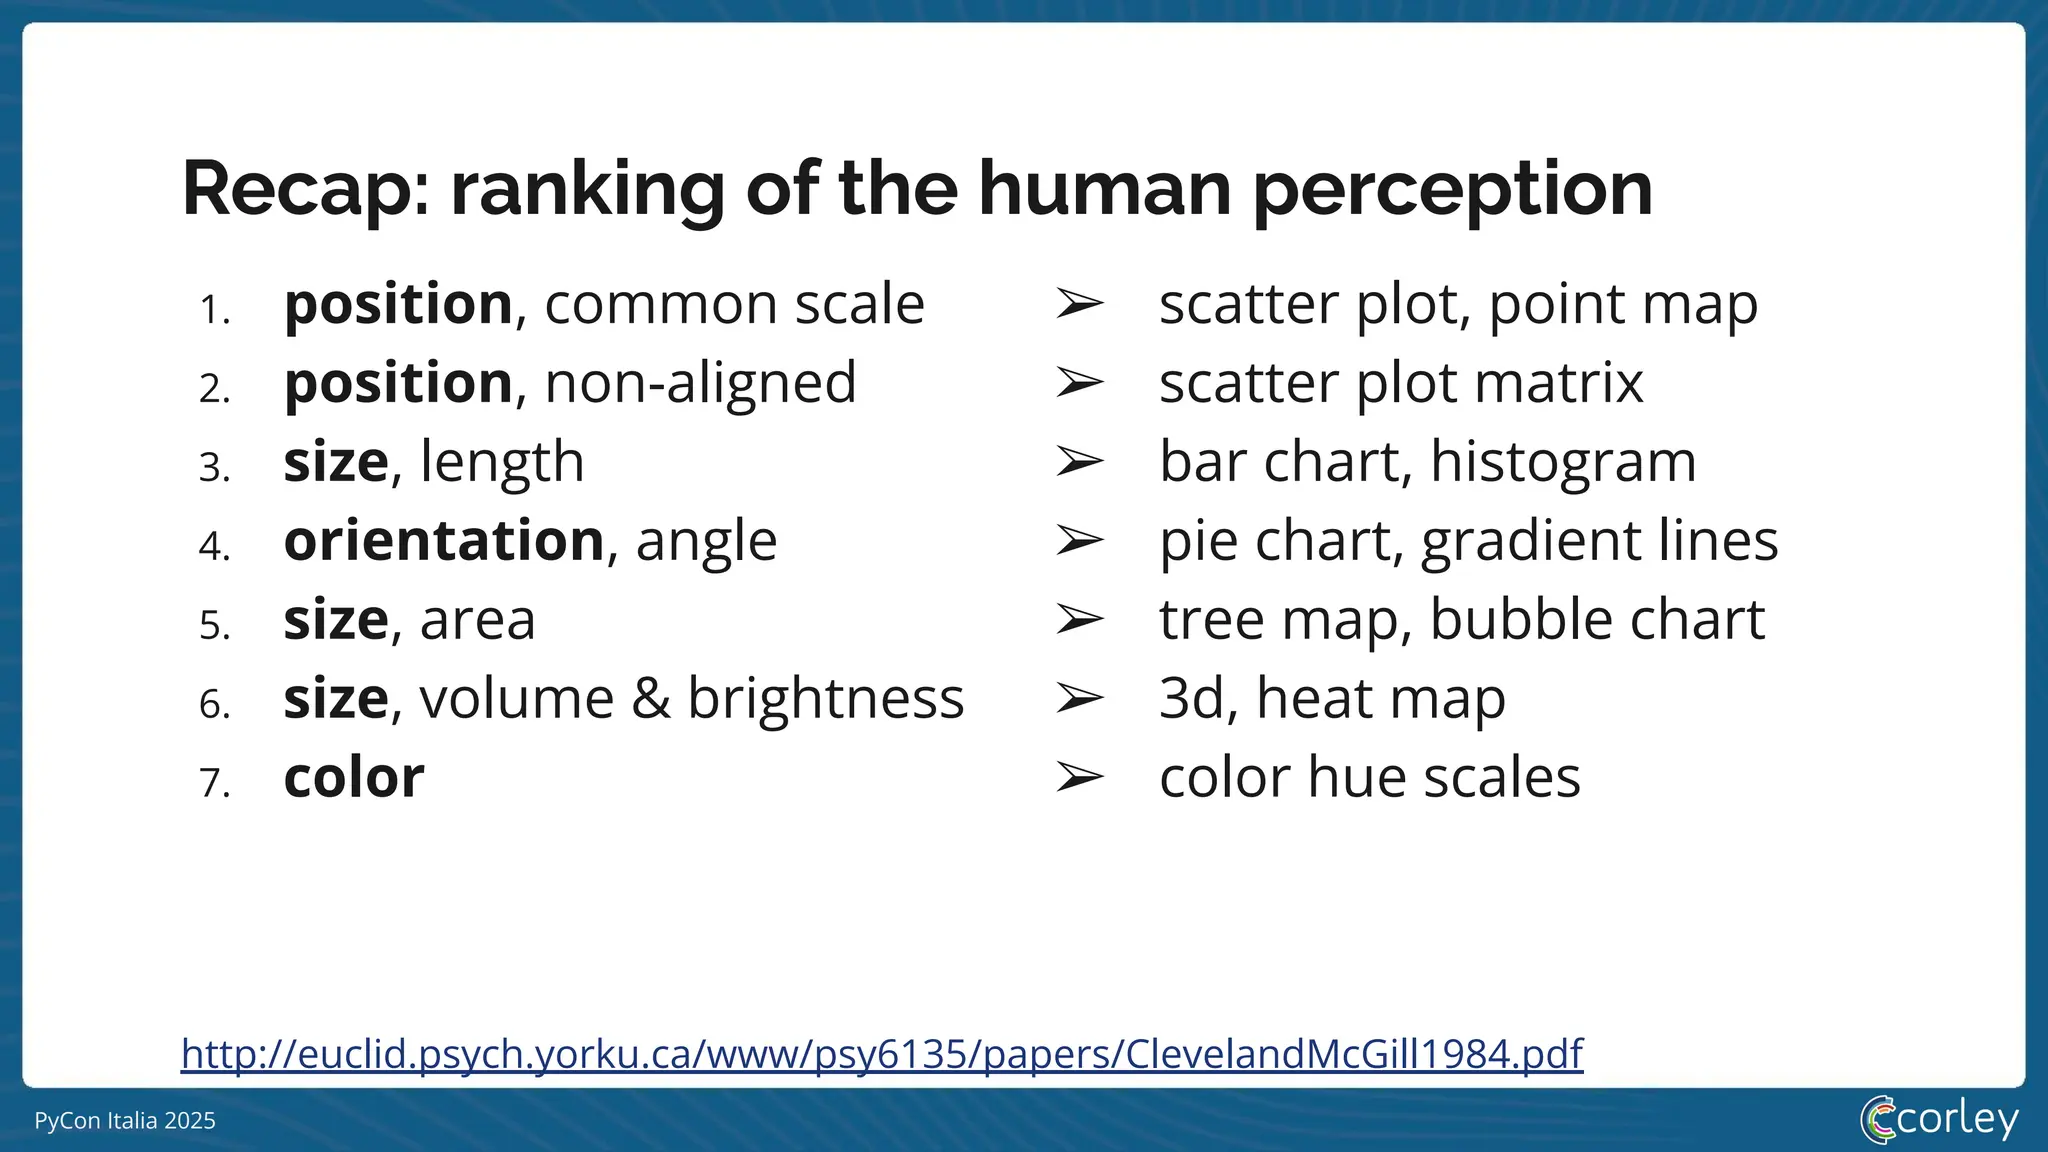
7. color
http://euclid.psych.yorku.ca/www/psy6135/papers/ClevelandMcGill1984.pdf
➢ scatter plot, point map
➢ scatter plot matrix
➢ bar chart, histogram
➢ pie chart, gradient lines
➢ tree map, bubble chart
➢ 3d, heat map
➢ color hue scales
25.
PyCon Italia 2025
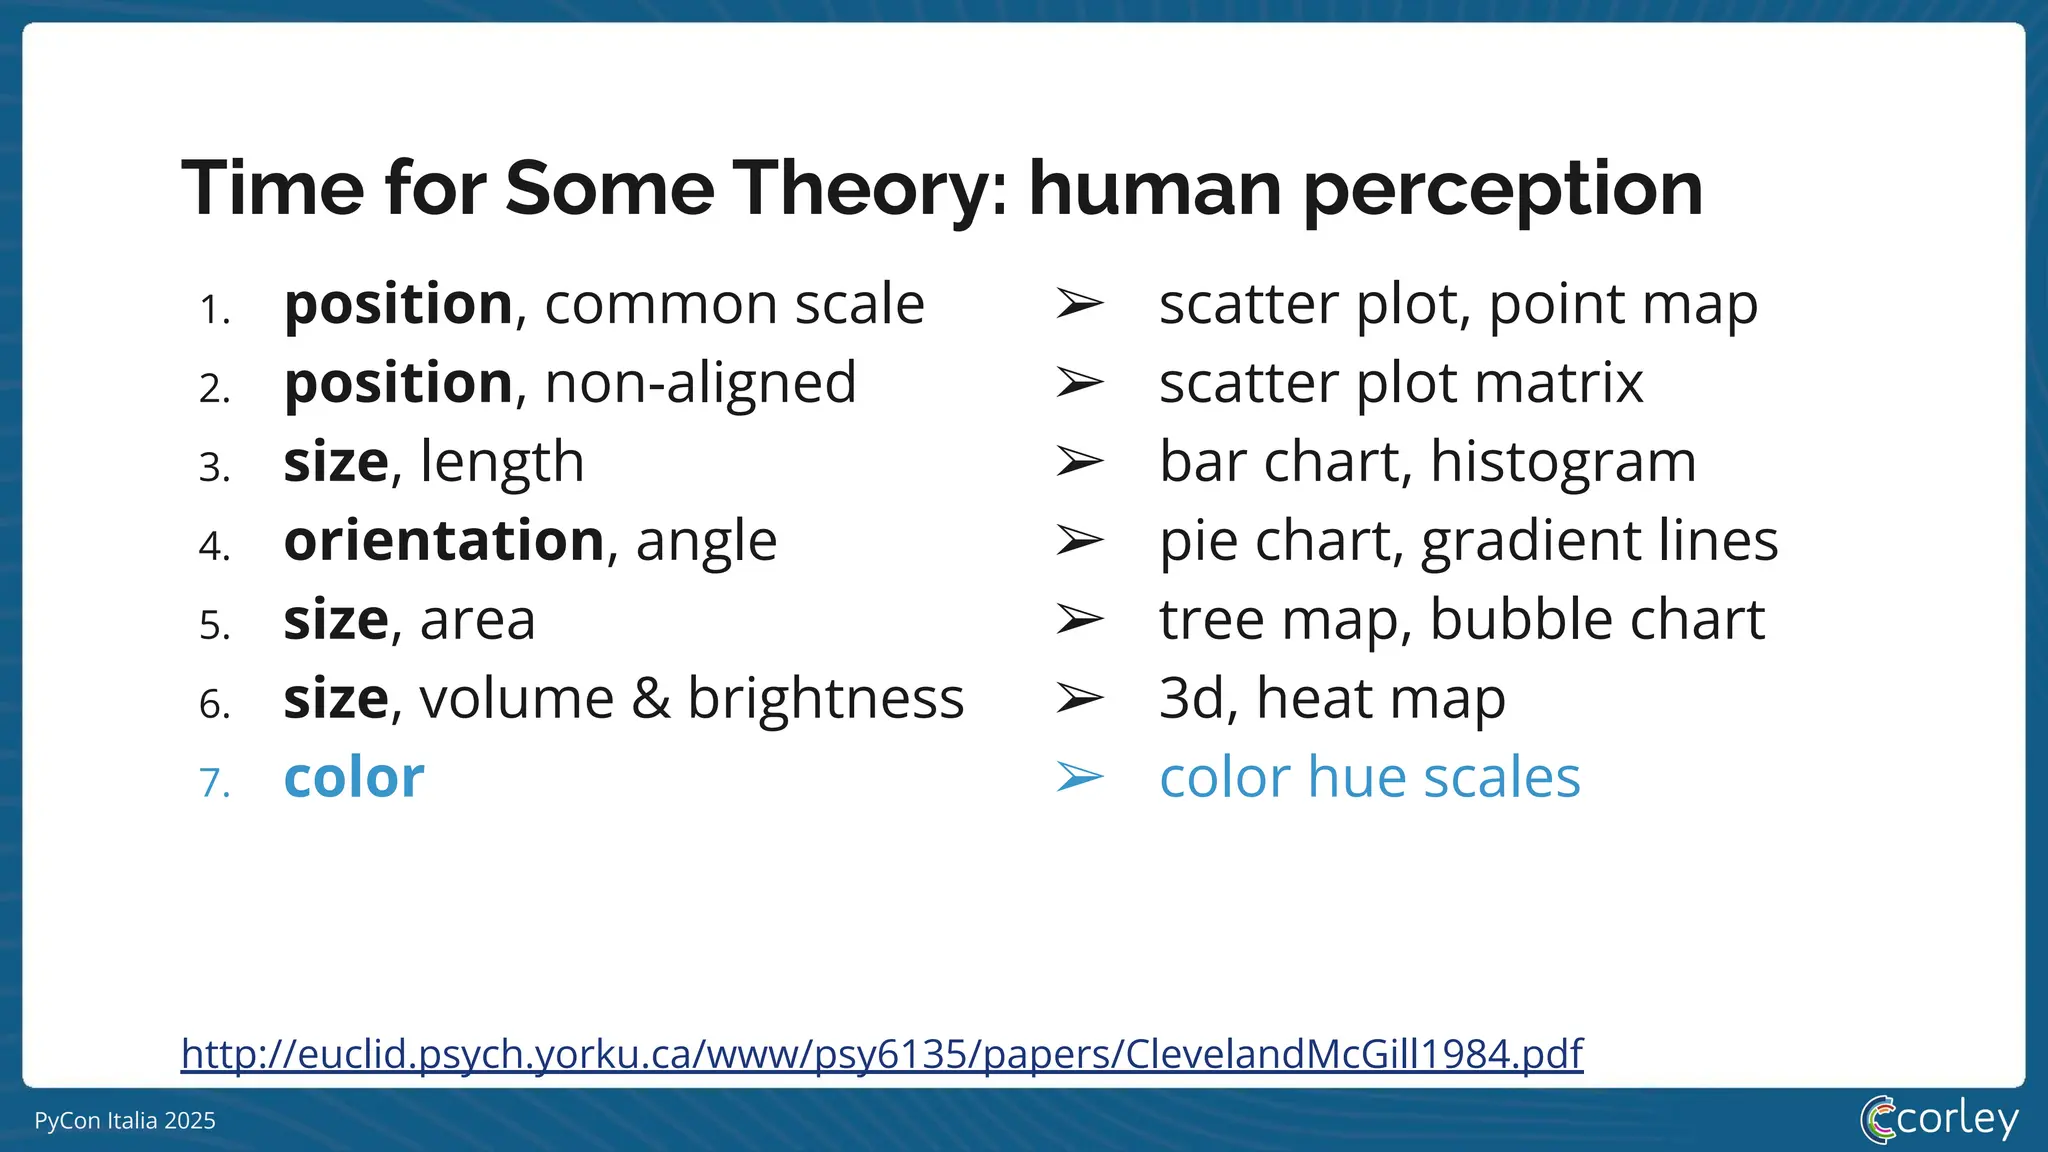
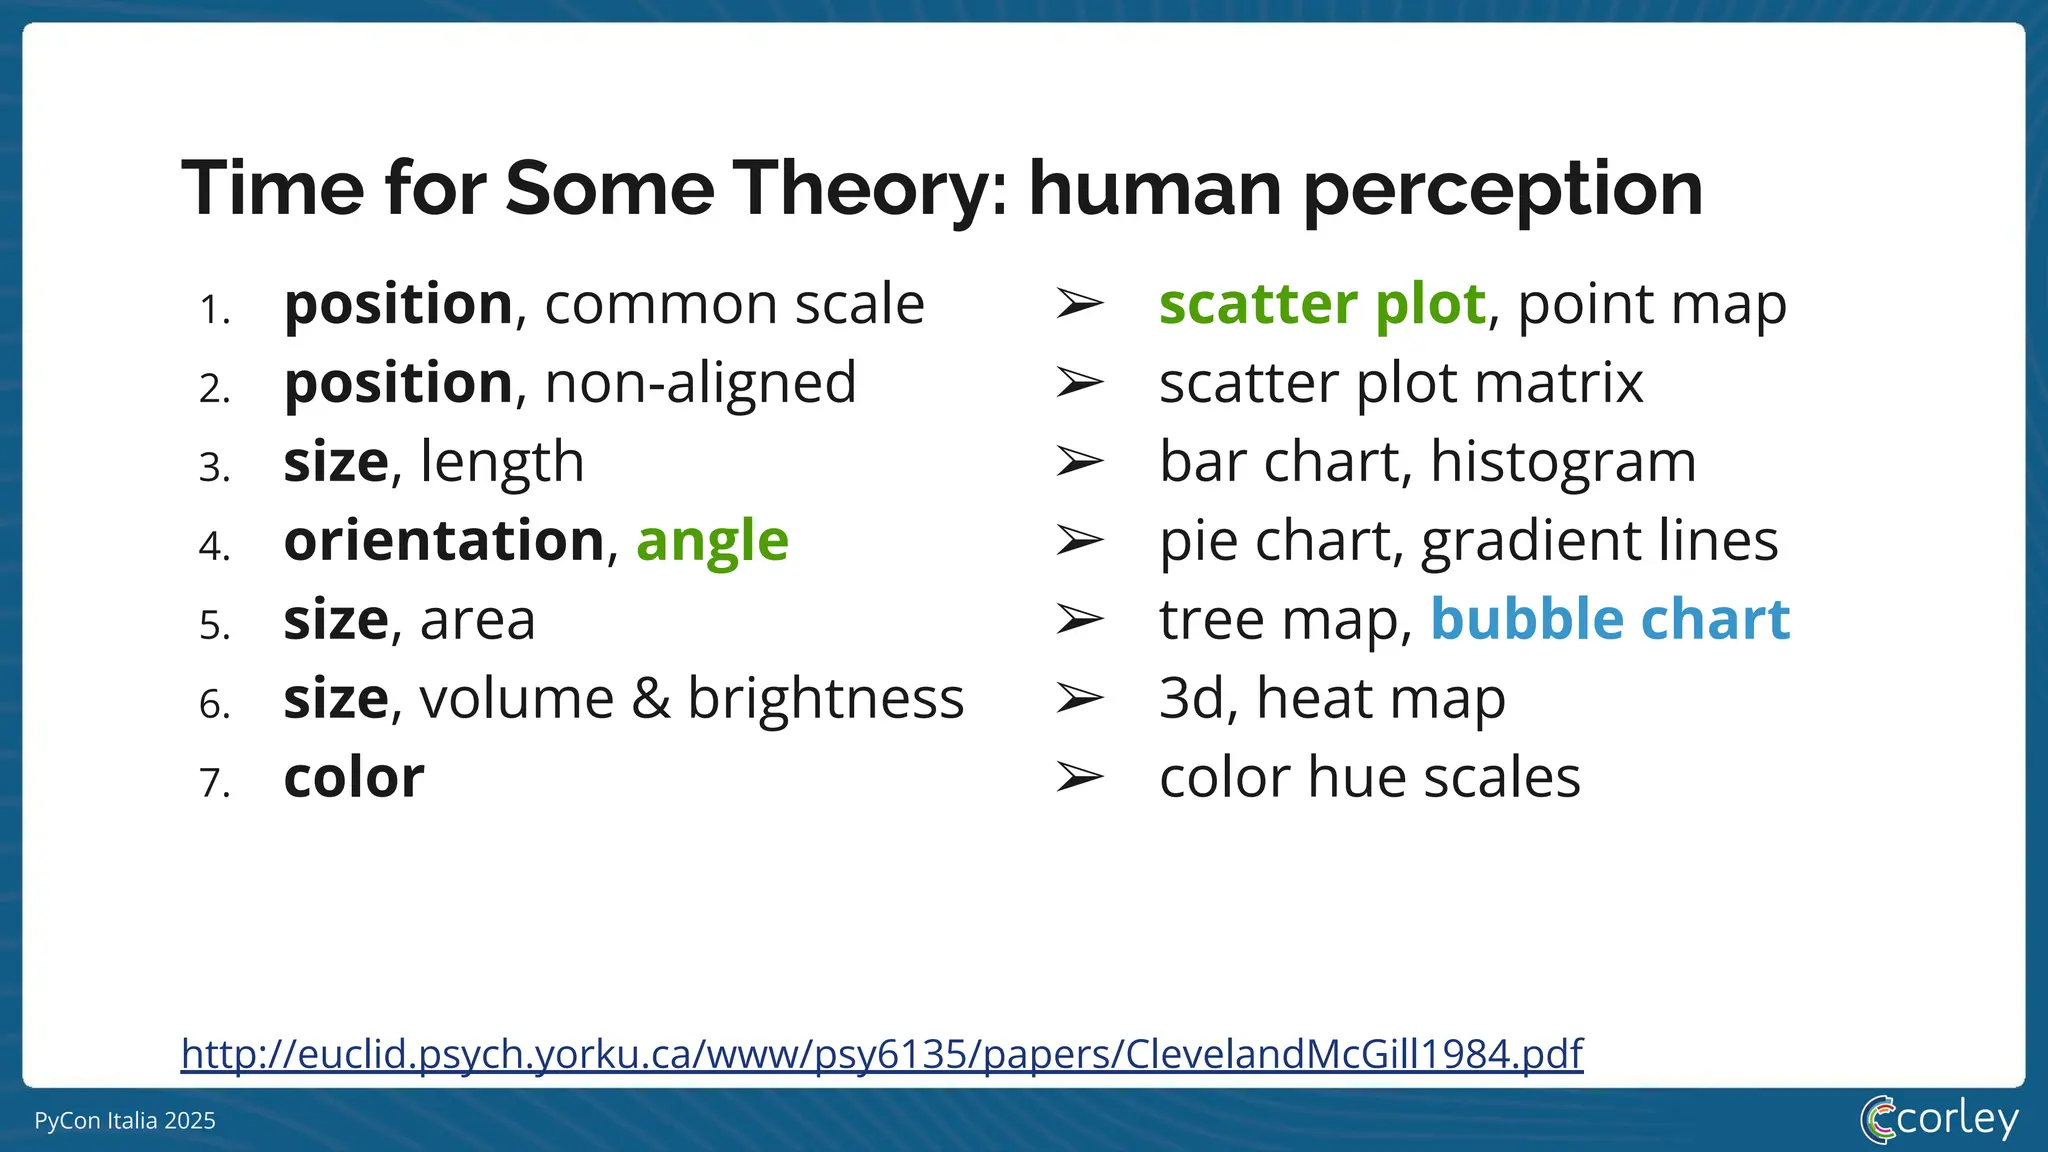
Timefor Some Theory: human perception
1. position, common scale
2. position, non-aligned
3. size, length
4. orientation, angle
5. size, area
6. size, volume & brightness
7. color
http://euclid.psych.yorku.ca/www/psy6135/papers/ClevelandMcGill1984.pdf
➢ scatter plot, point map
➢ scatter plot matrix
➢ bar chart, histogram
➢ pie chart, gradient lines
➢ tree map, bubble chart
➢ 3d, heat map
➢ color hue scales
PyCon Italia 2025
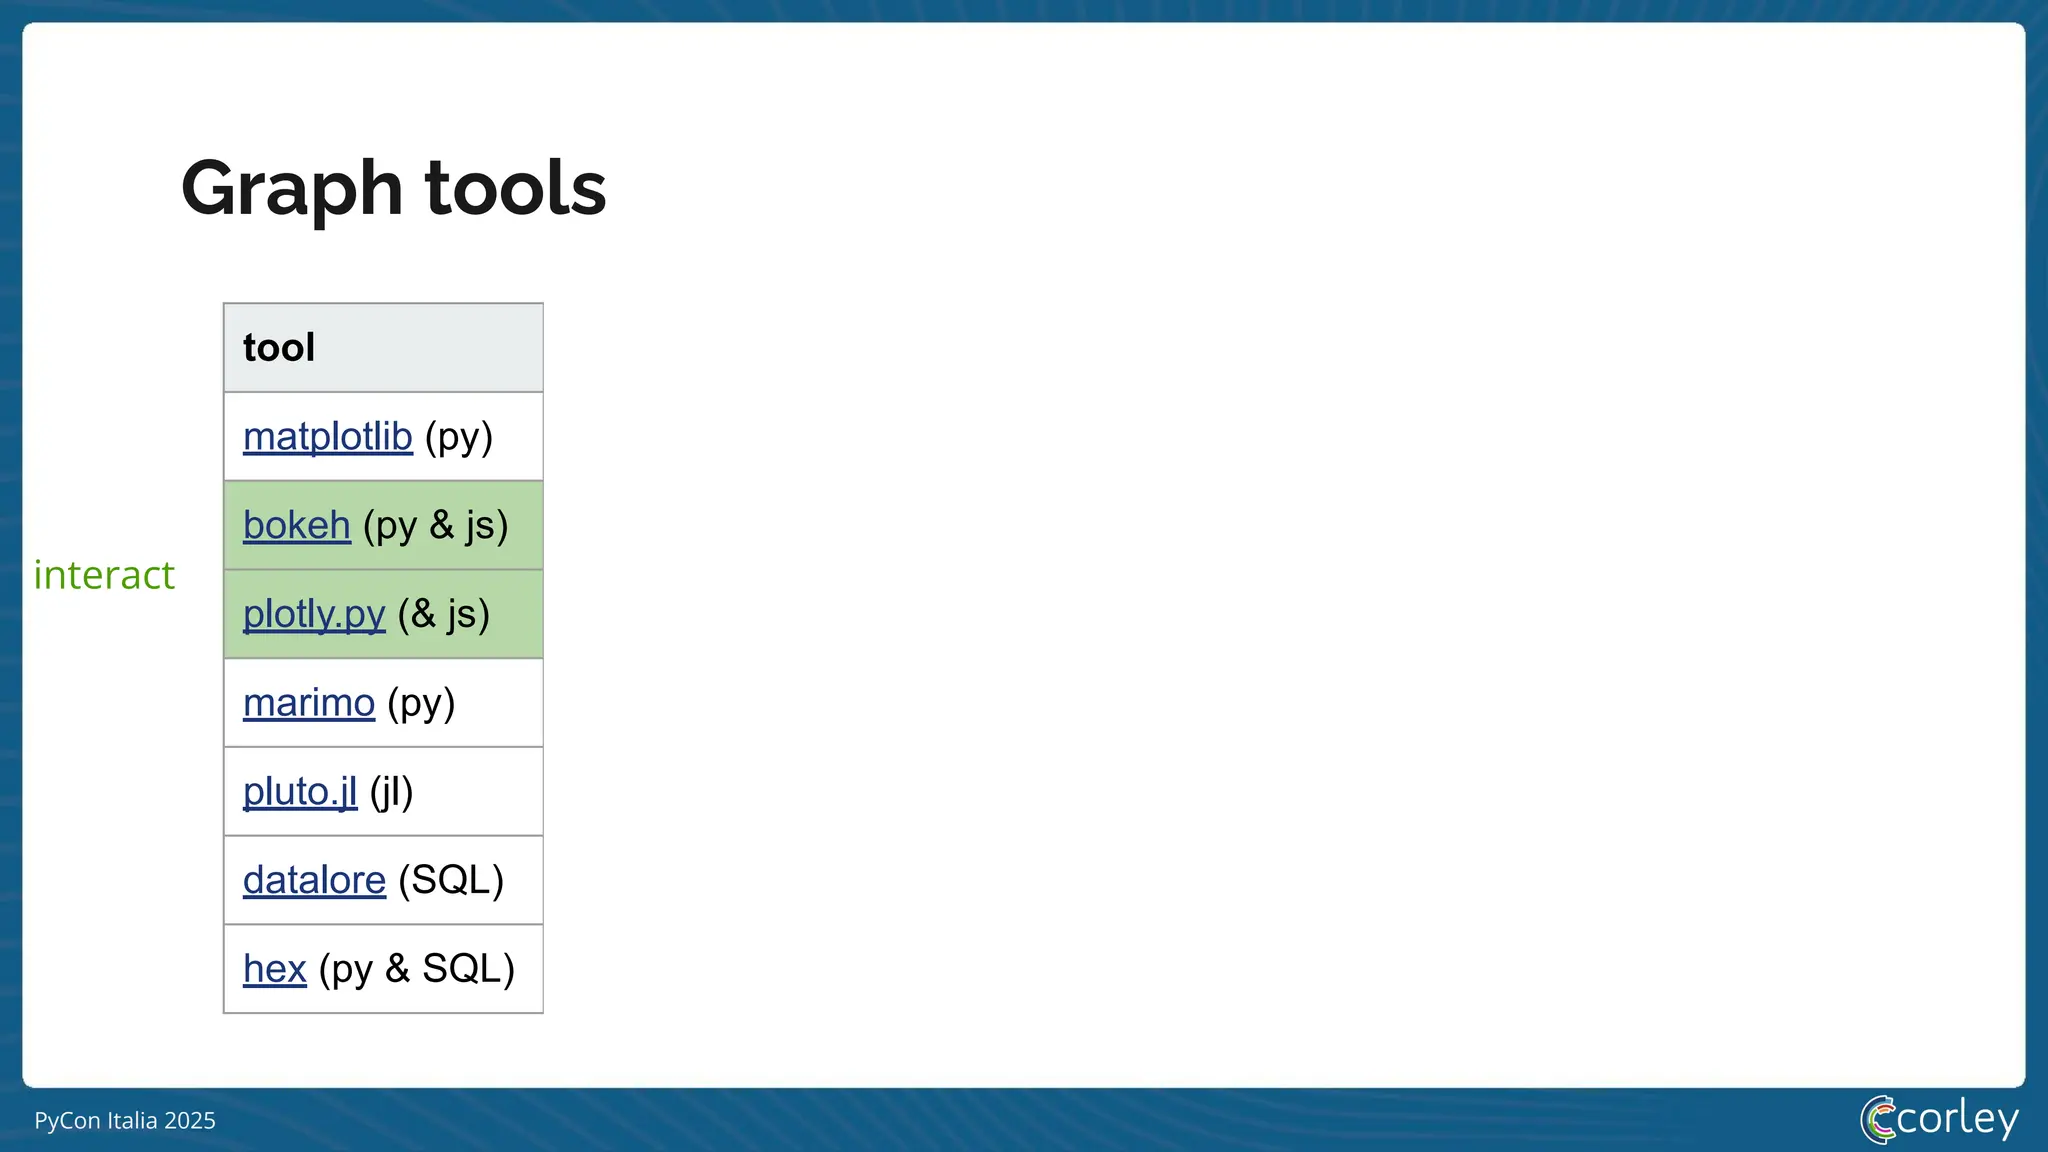
EDAtools
tool correlation distribution missing version contributors
YData profiling table & heatmap * histogram bar & heatmap 4.16.1 116
dabl scatter plot histogram --- 0.3.2 25
klib table & heatmap ** line / histo bar & heatmap 1.3.1 6
PyGWalker calculated field drag & drop calculated field 0.4.9.15 23
36.
PyCon Italia 2025
EDAtools
tool correlation distribution missing version contributors
YData profiling table & heatmap * histogram bar & heatmap 4.16.1 116
dabl scatter plot histogram --- 0.3.2 25
klib table & heatmap ** line / histo bar & heatmap 1.3.1 6
PyGWalker calculated field drag & drop calculated field 0.4.9.15 23
** also single feature heatmap
* also interactions
37.
PyCon Italia 2025
EDAtools
tool correlation distribution missing version contributors
YData profiling table & heatmap * histogram bar & heatmap 4.16.1 116
dabl scatter plot histogram --- 0.3.2 25
klib table & heatmap ** line / histo bar & heatmap 1.3.1 6
PyGWalker calculated field drag & drop calculated field 0.4.9.15 23
** also single feature heatmap
* also interactions
38.
PyCon Italia 2025
EDAtools
tool correlation distribution missing version contributors
YData profiling table & heatmap * histogram bar & heatmap 4.16.1 116
dabl scatter plot histogram --- 0.3.2 25
klib table & heatmap ** line / histo bar & heatmap 1.3.1 6
PyGWalker calculated field drag & drop calculated field 0.4.9.15 23
** also single feature heatmap
* also interactions
39.
PyCon Italia 2025
EDAtools
tool correlation distribution missing version contributors
YData profiling table & heatmap * histogram bar & heatmap 4.16.1 116
dabl scatter plot histogram --- 0.3.2 25
klib table & heatmap ** line / histo bar & heatmap 1.3.1 6
PyGWalker calculated field drag & drop calculated field 0.4.9.15 23
** also single feature heatmap
* also interactions
40.
PyCon Italia 2025
EDAtools
tool correlation distribution missing version contributors
YData profiling table & heatmap * histogram bar & heatmap 4.16.1 116
dabl scatter plot histogram --- 0.3.2 25
klib table & heatmap ** line / histo bar & heatmap 1.3.1 6
PyGWalker calculated field drag & drop calculated field 0.4.9.15 23
** also single feature heatmap
* also interactions
41.
PyCon Italia 2025
EDAtools
tool correlation distribution missing version contributors
YData profiling table & heatmap * histogram bar & heatmap 4.16.1 116
dabl scatter plot histogram --- 0.3.2 25
klib table & heatmap ** line / histo bar & heatmap 1.3.1 6
PyGWalker calculated field drag & drop calculated field 0.4.9.15 23
** also single feature heatmap
* also interactions
42.
PyCon Italia 2025
EDAtools
tool correlation distribution missing version contributors
YData profiling table & heatmap * histogram bar & heatmap 4.16.1 116
dabl scatter plot histogram --- 0.3.2 25
klib table & heatmap ** line / histo bar & heatmap 1.3.1 6
PyGWalker calculated field drag & drop calculated field 0.4.9.15 23
** also single feature heatmap
* also interactions
43.
PyCon Italia 2025
EDAtools
tool correlation distribution missing version contributors
YData profiling table & heatmap * histogram bar & heatmap 4.16.1 116
dabl scatter plot histogram --- 0.3.2 25
klib table & heatmap ** line / histo bar & heatmap 1.3.1 6
PyGWalker calculated field drag & drop calculated field 0.4.9.15 23
** also single feature heatmap
* also interactions
44.
PyCon Italia 2025
EDAtools
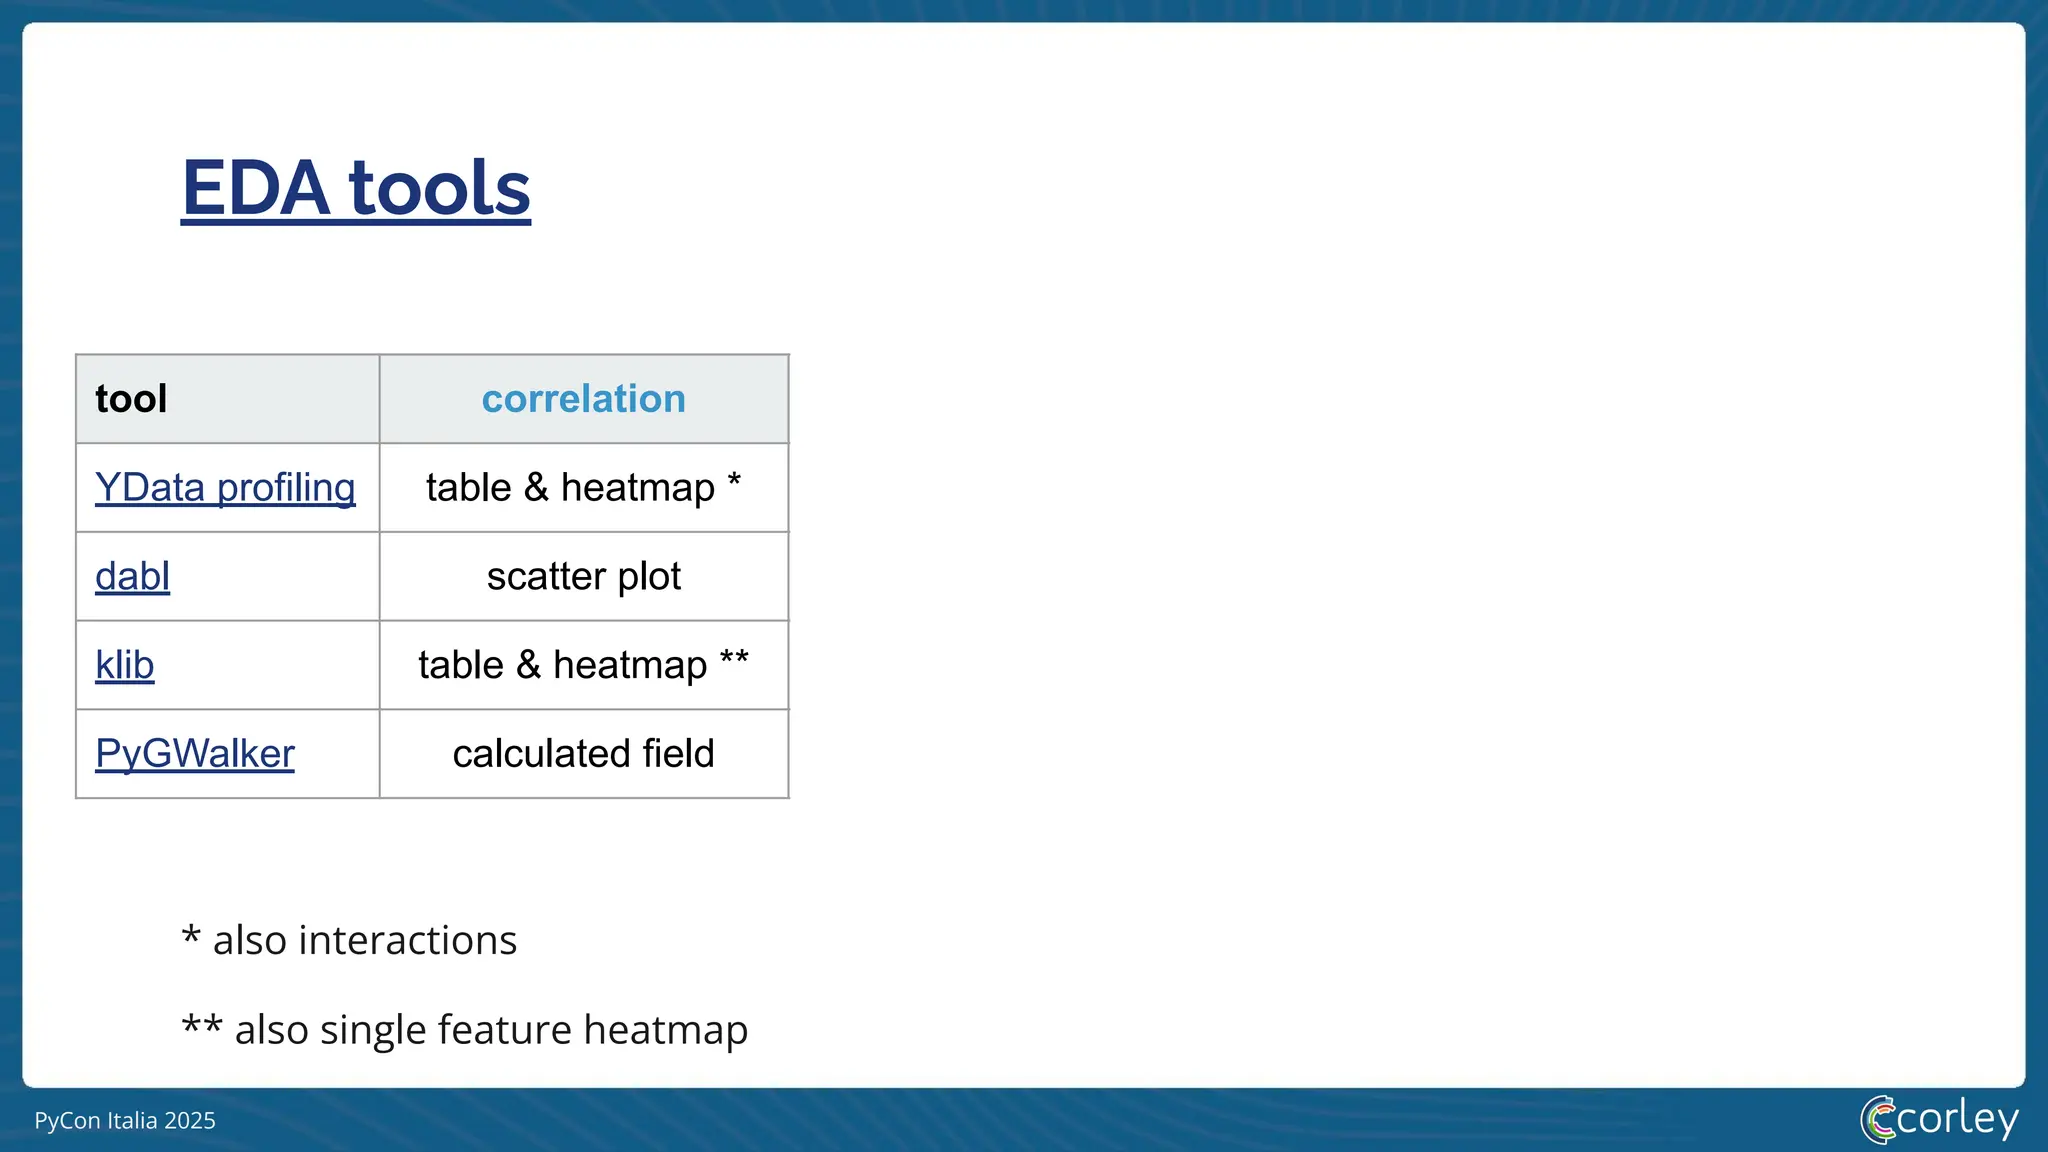
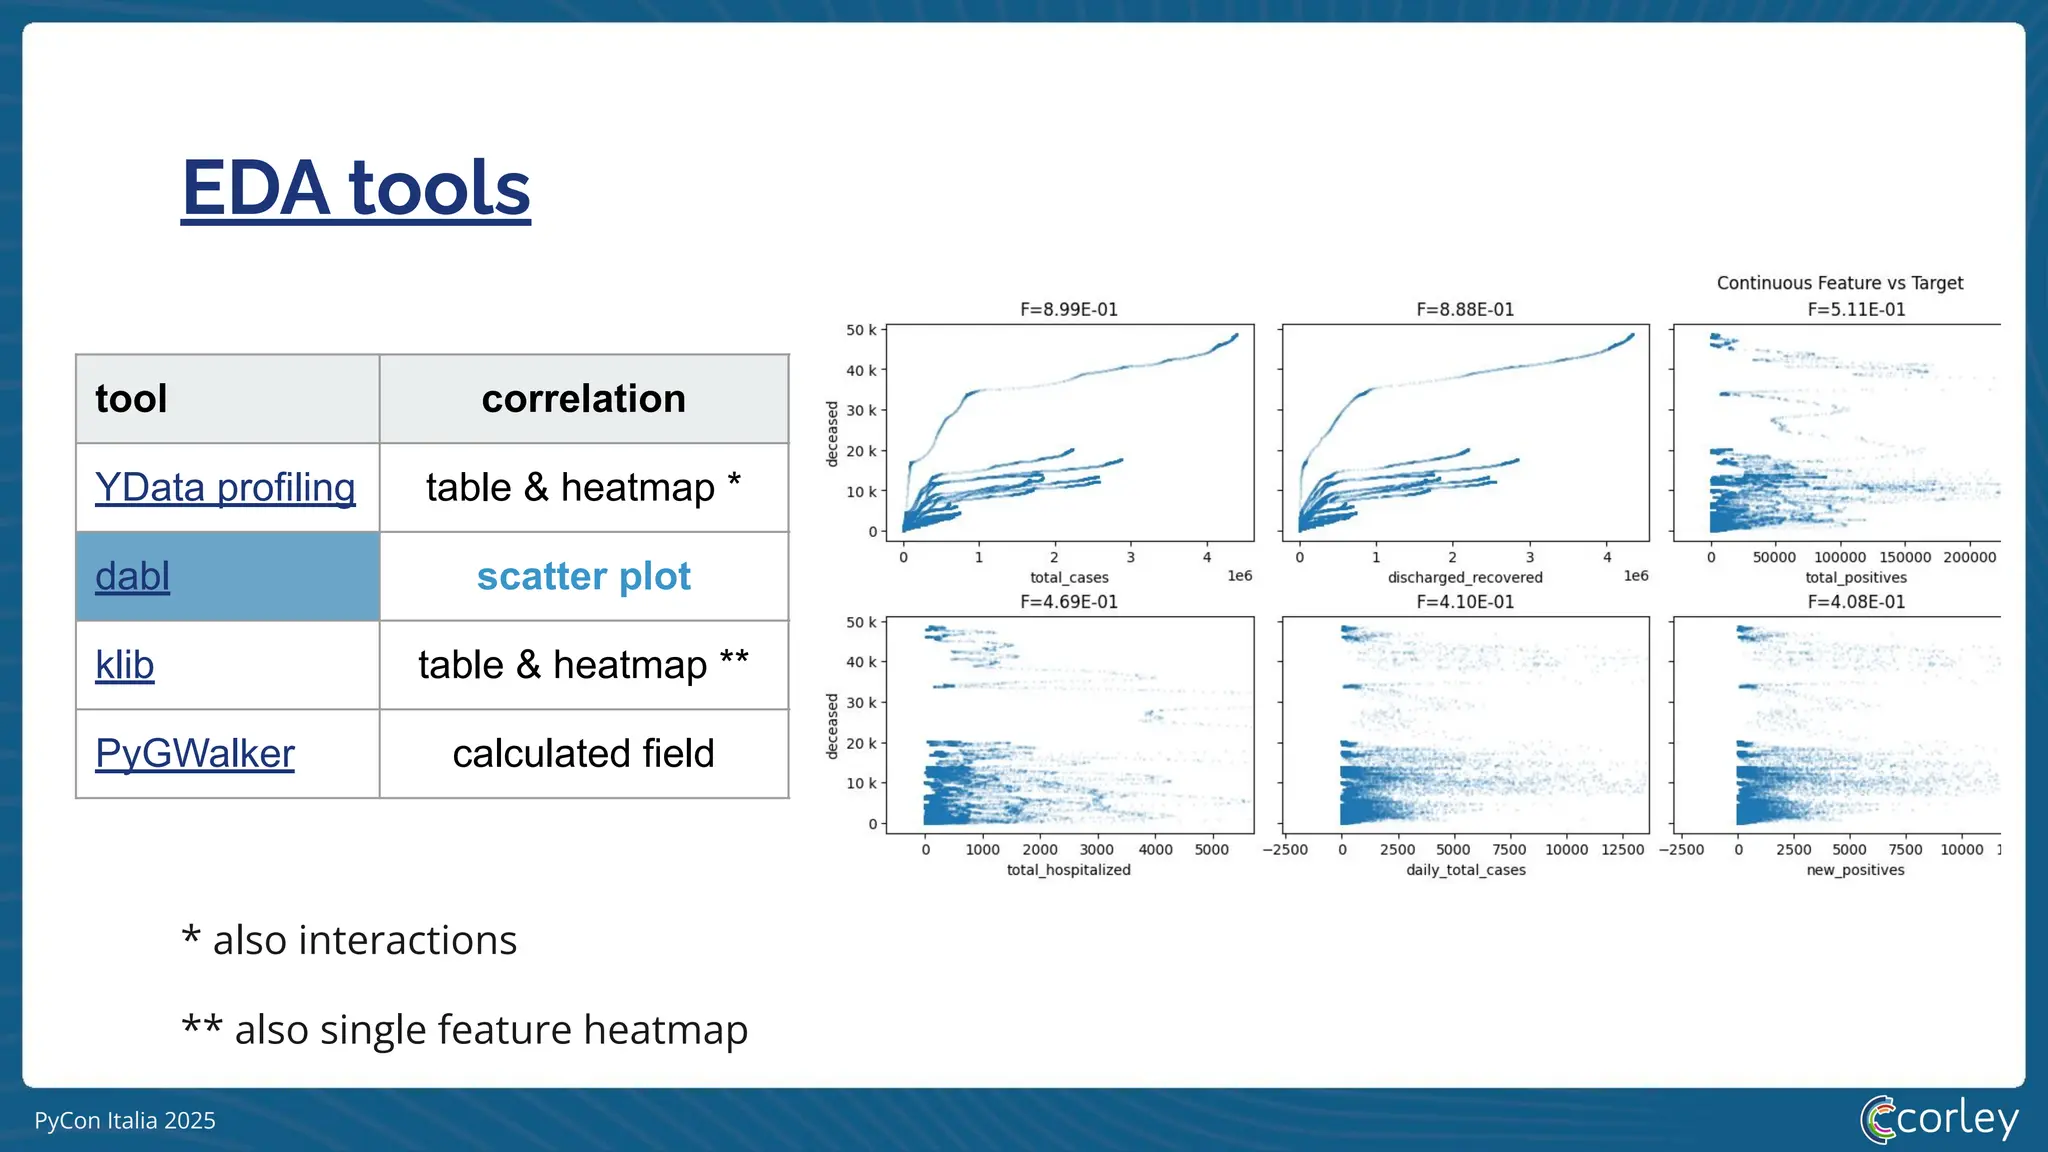
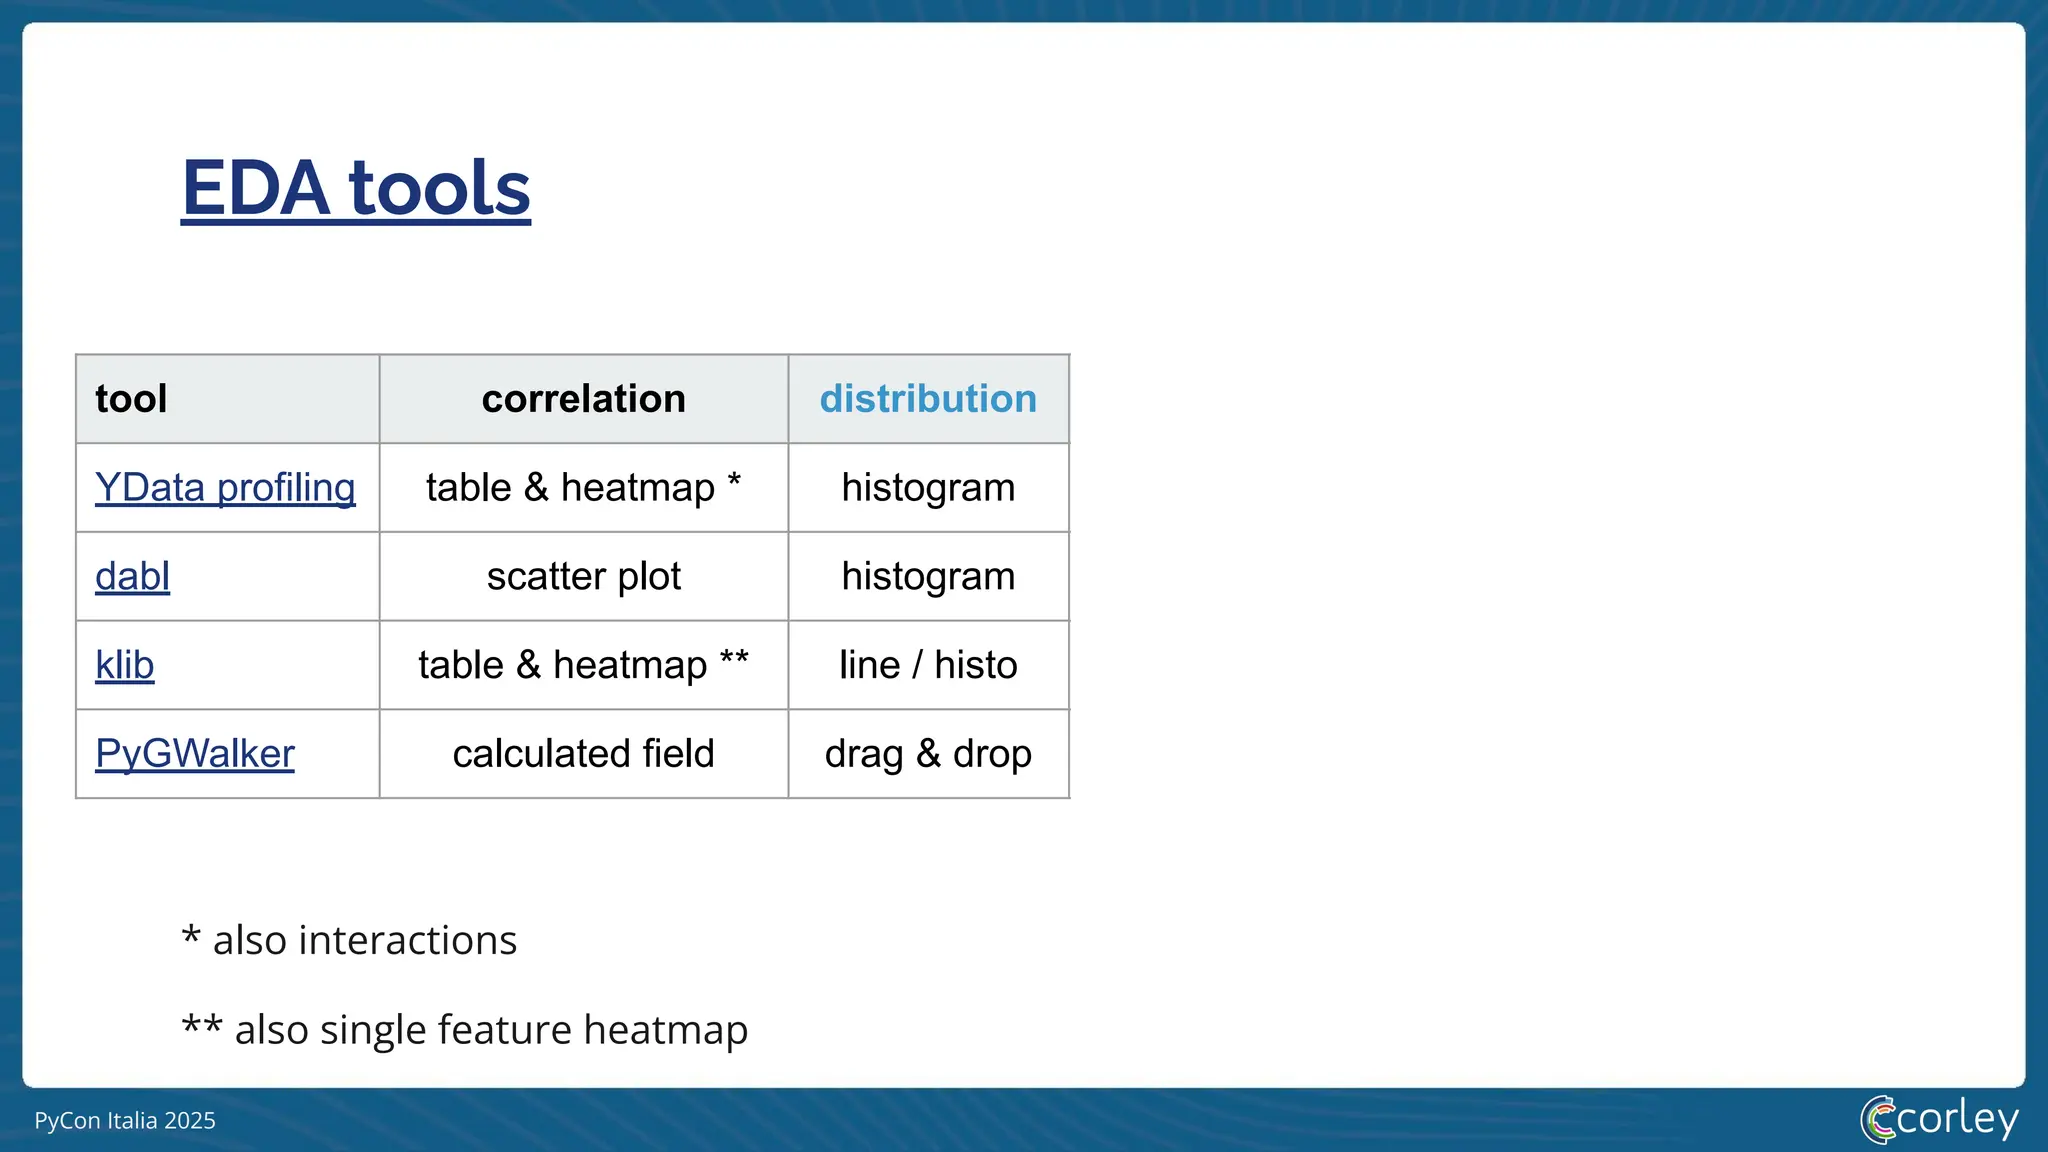
tool correlation distribution missing
YData profiling table & heatmap * histogram bar & heatmap
dabl scatter plot histogram ---
klib table & heatmap ** line / histo bar & heatmap
PyGWalker calculated field drag & drop calculated field
** also single feature heatmap
* also interactions
45.
PyCon Italia 2025
EDAtools
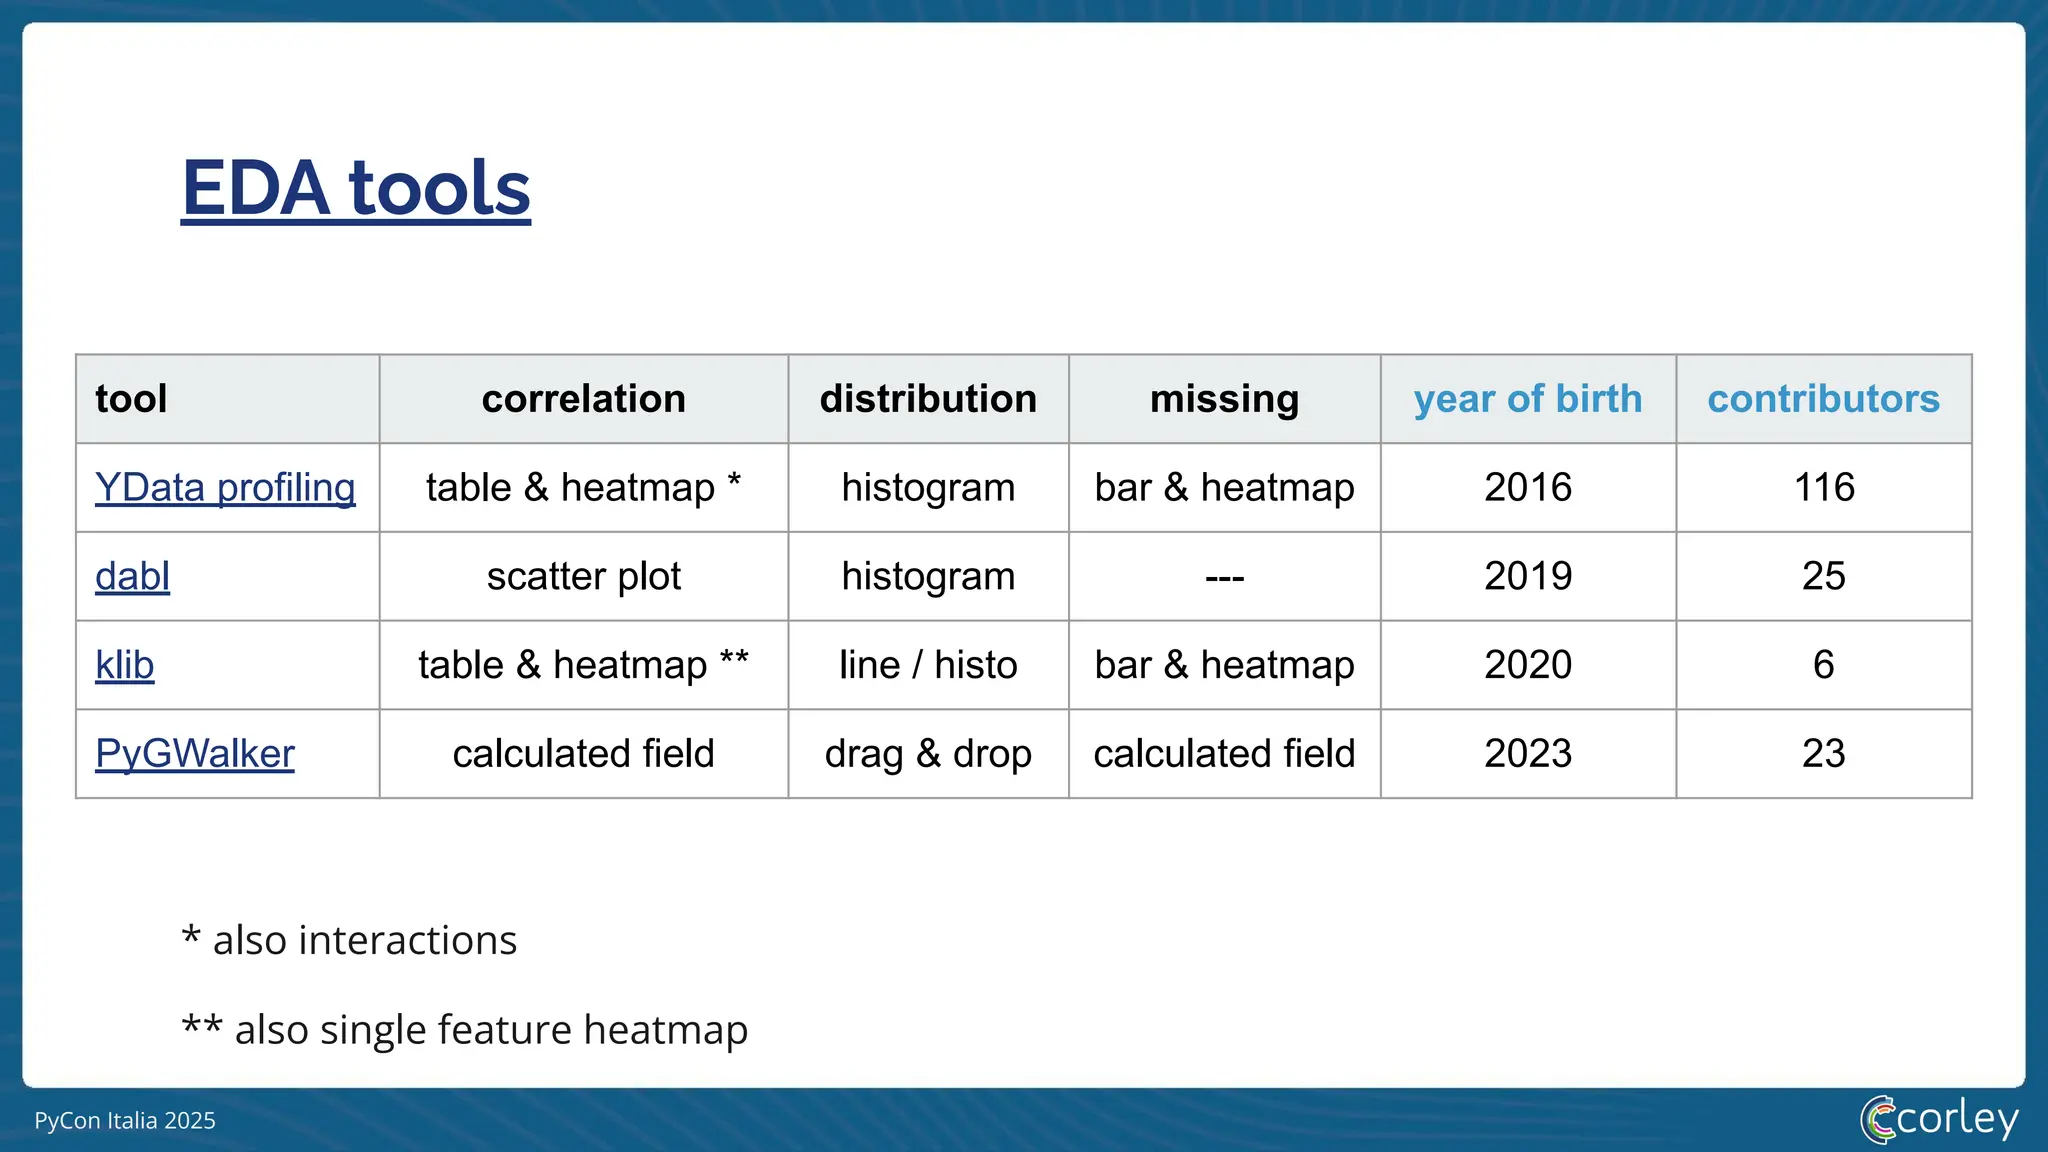
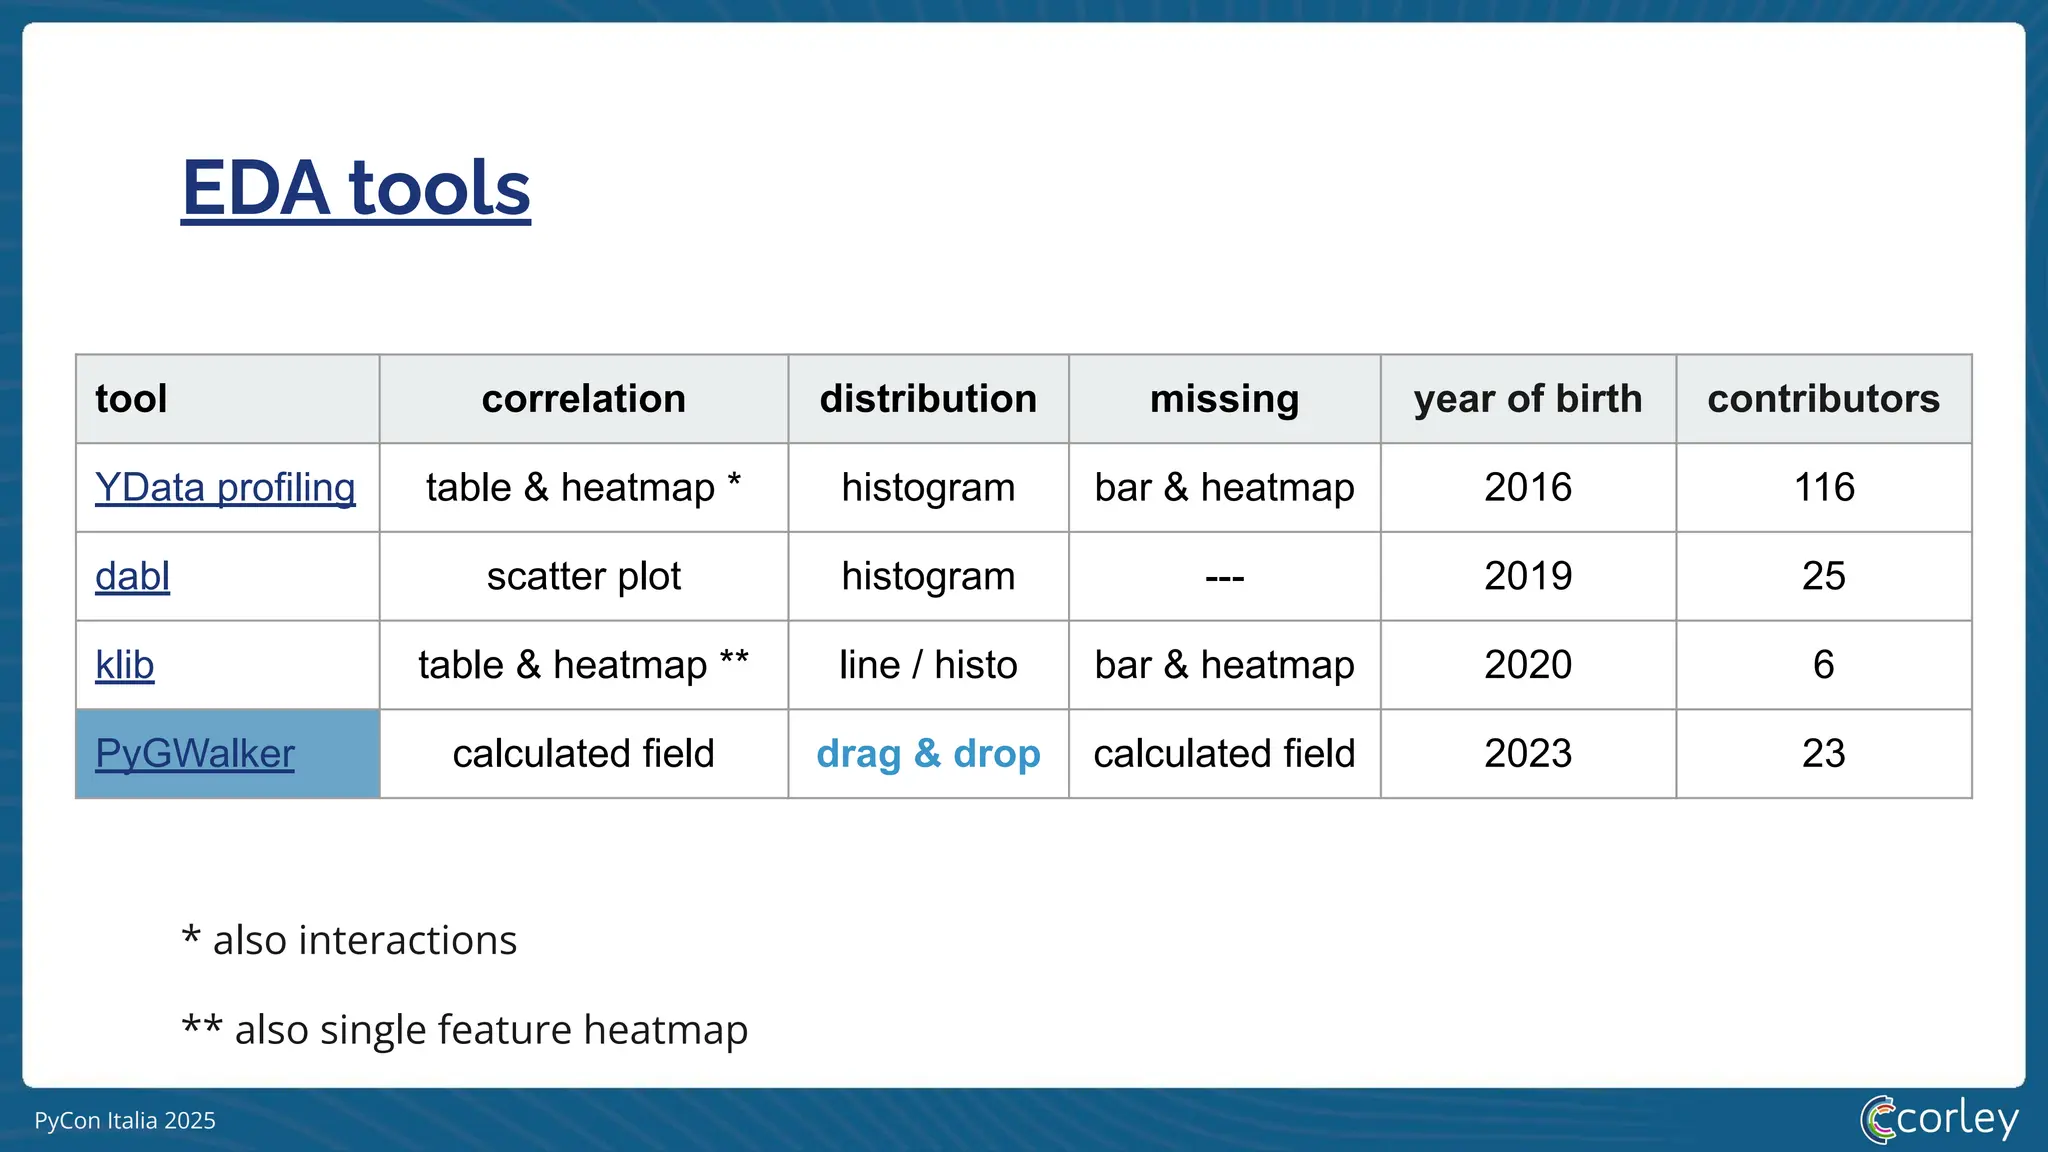
tool correlation distribution missing year of birth contributors
YData profiling table & heatmap * histogram bar & heatmap 2016 116
dabl scatter plot histogram --- 2019 25
klib table & heatmap ** line / histo bar & heatmap 2020 6
PyGWalker calculated field drag & drop calculated field 2023 23
** also single feature heatmap
* also interactions
46.
PyCon Italia 2025
EDAtools
tool correlation distribution missing year of birth contributors
YData profiling table & heatmap * histogram bar & heatmap 2016 116
dabl scatter plot histogram --- 2019 25
klib table & heatmap ** line / histo bar & heatmap 2020 6
PyGWalker calculated field drag & drop calculated field 2023 23
** also single feature heatmap
* also interactions
47.
PyCon Italia 2025
EDAtools
tool correlation distribution missing year of birth contributors
YData profiling table & heatmap * histogram bar & heatmap 2016 116
dabl scatter plot histogram --- 2019 25
klib table & heatmap ** line / histo bar & heatmap 2020 6
PyGWalker calculated field drag & drop calculated field 2023 23
** also single feature heatmap
* also interactions
48.
PyCon Italia 2025
EDAtools
tool correlation distribution missing year of birth contributors
YData profiling table & heatmap * histogram bar & heatmap 2016 116
dabl scatter plot histogram --- 2019 25
klib table & heatmap ** line / histo bar & heatmap 2020 6
PyGWalker calculated field drag & drop calculated field 2023 23
** also single feature heatmap
* also interactions
49.
PyCon Italia 2025
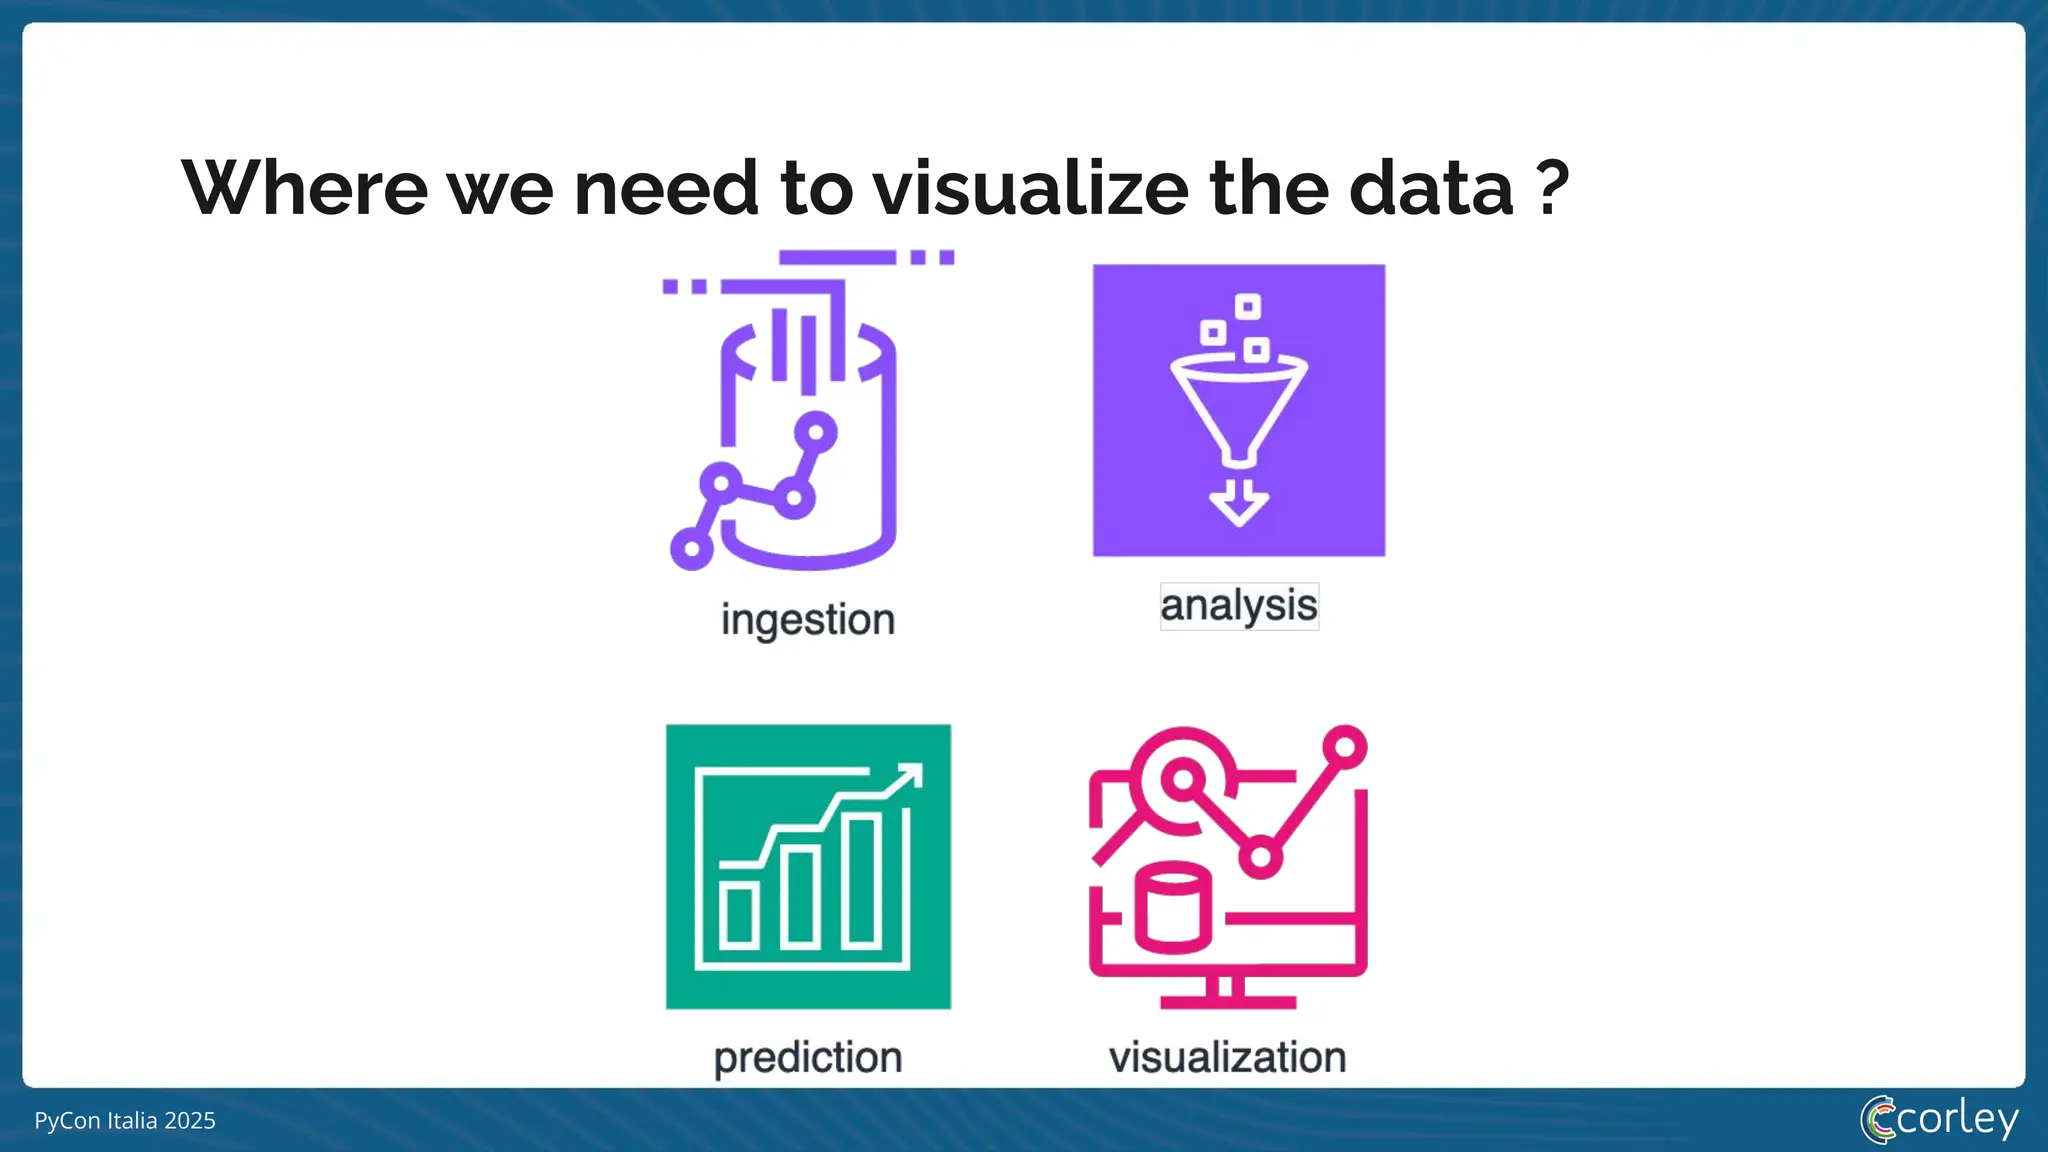
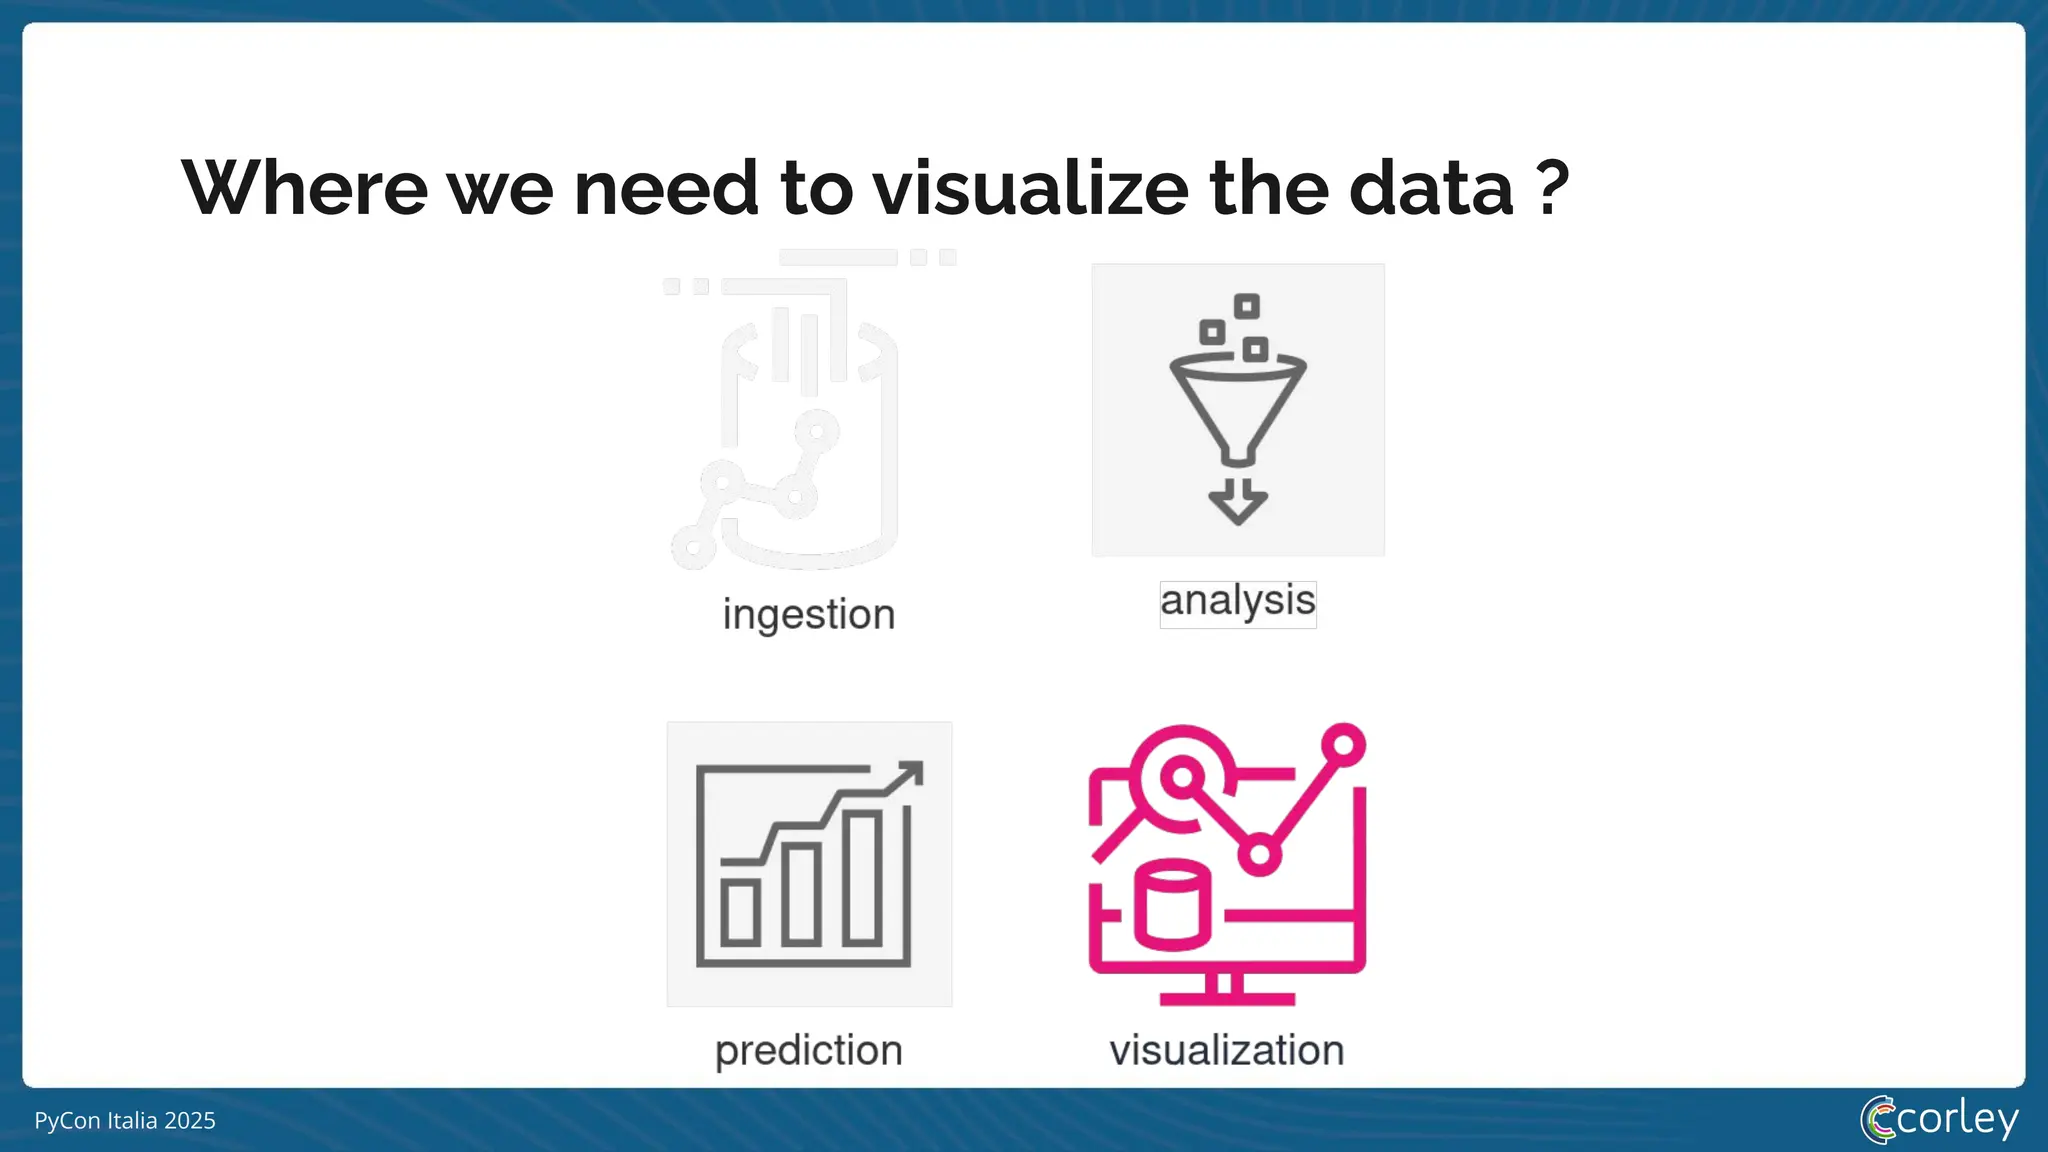
Wherewe need to visualize the data ?
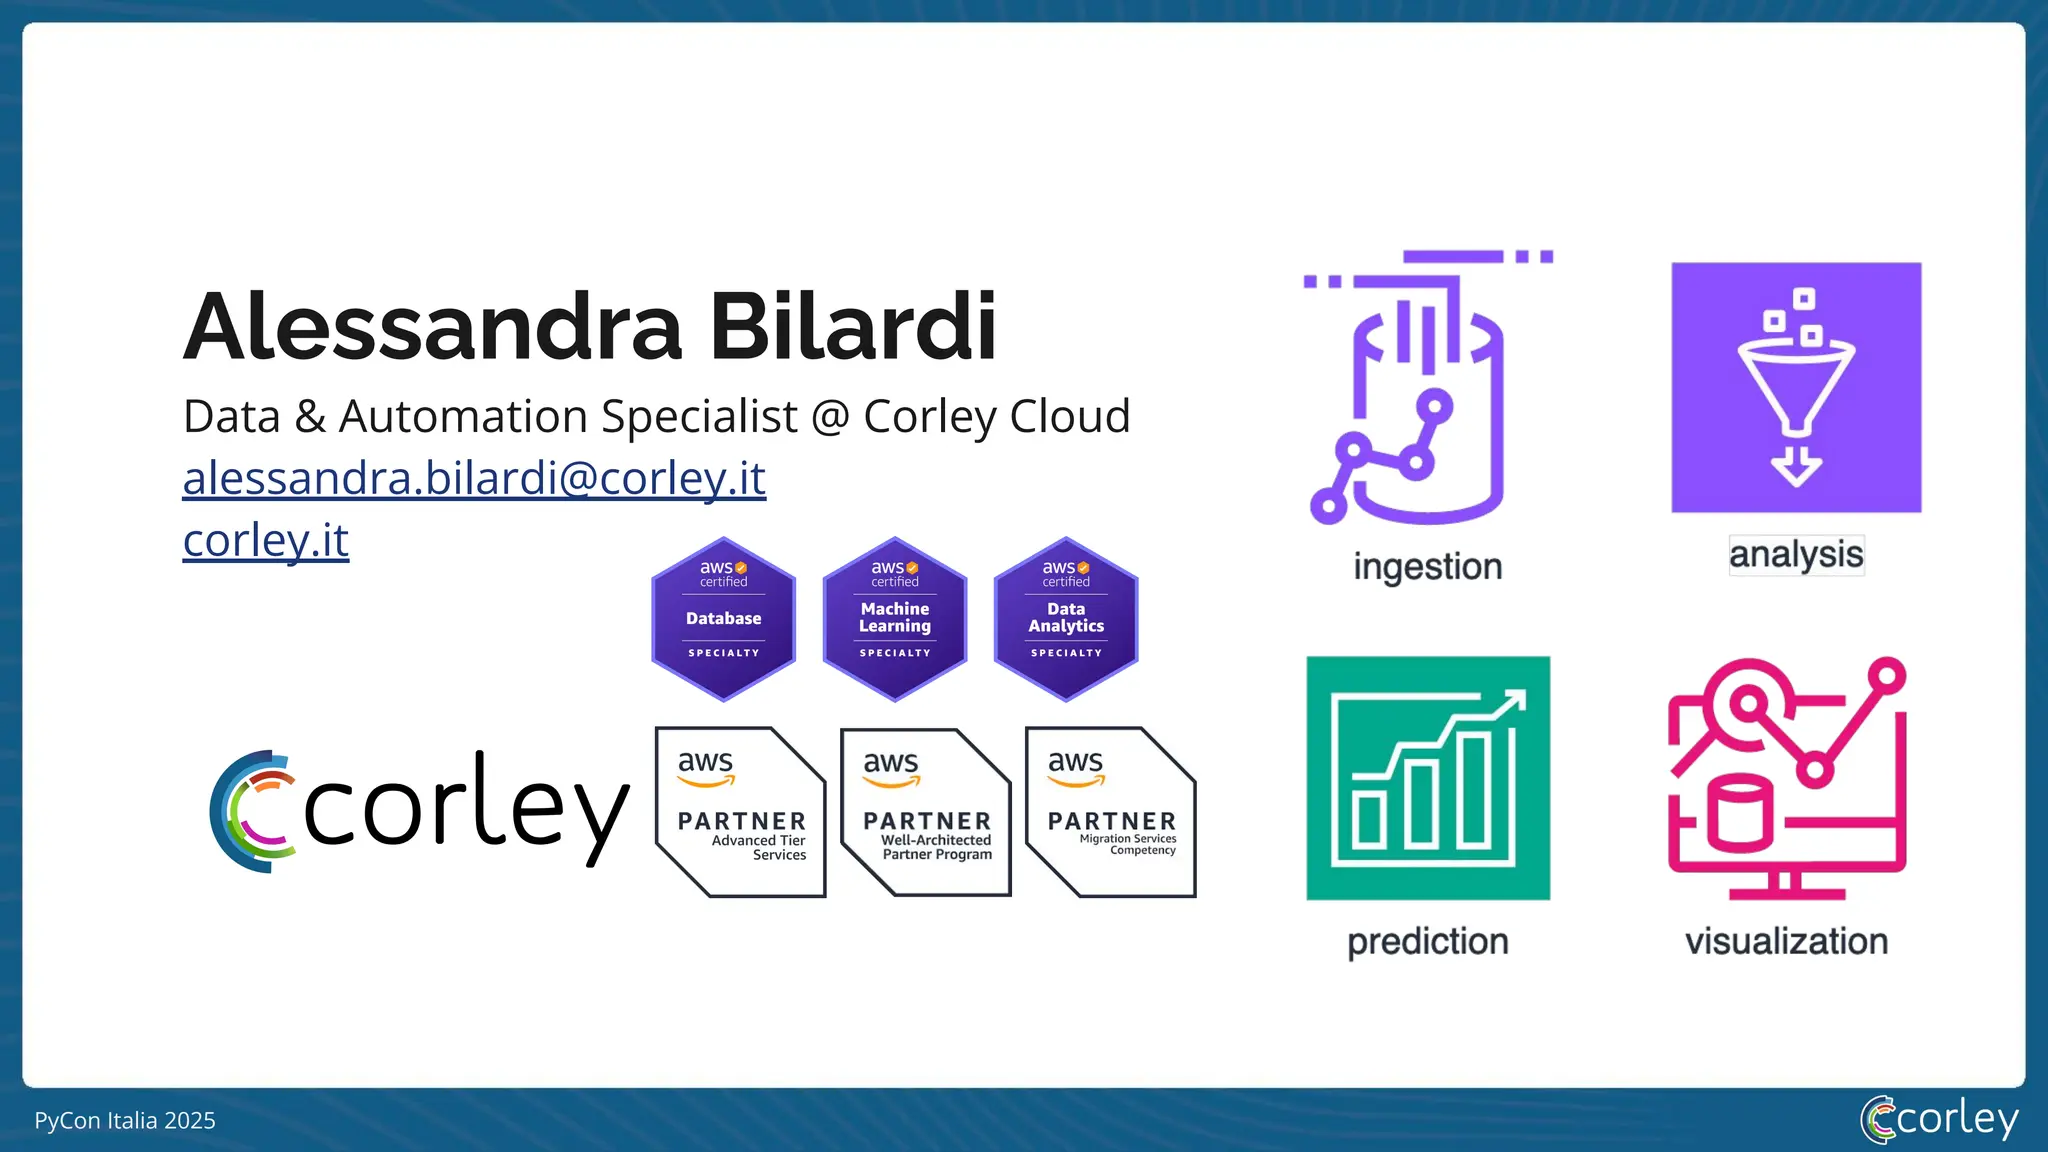
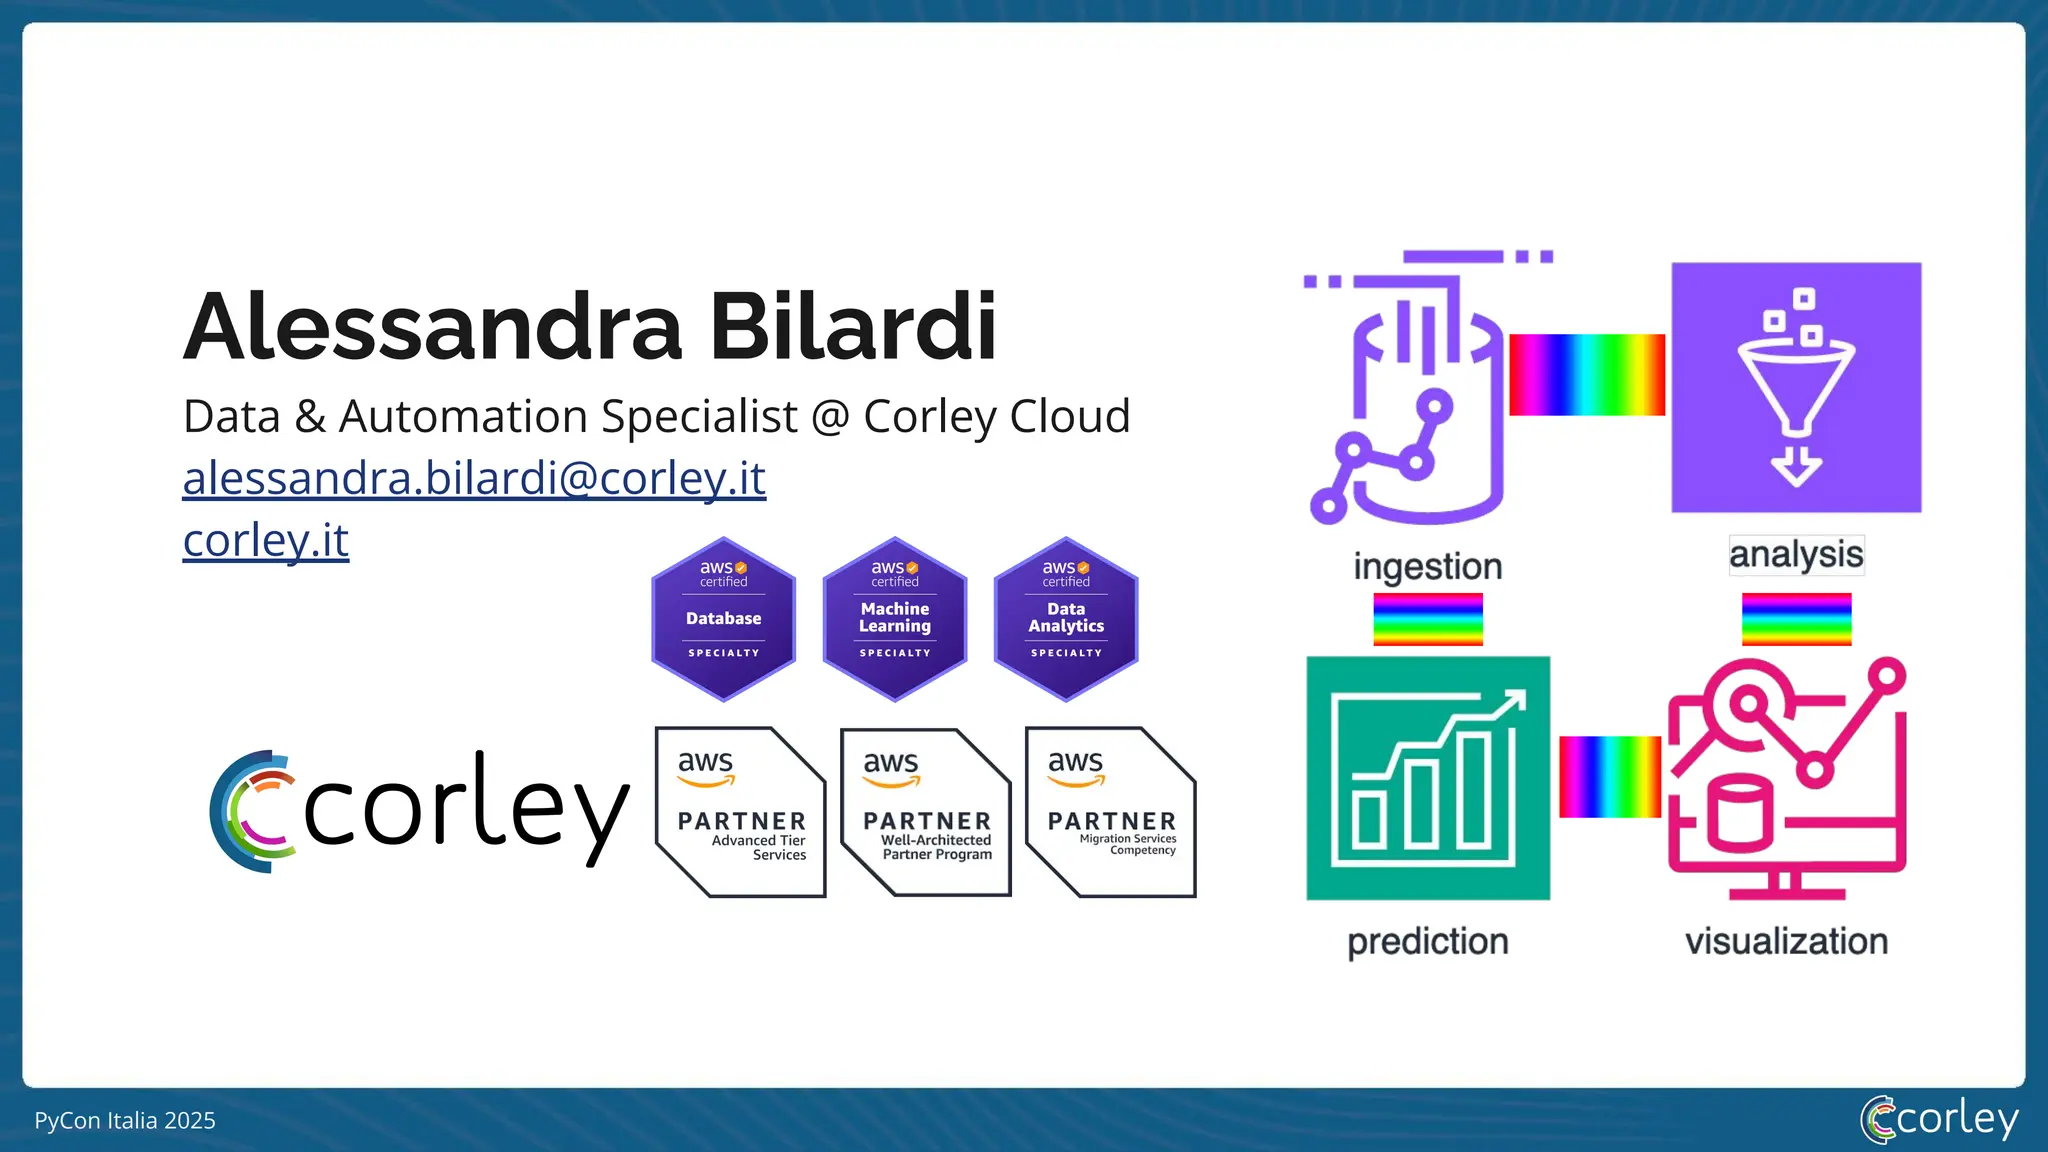
Data ingestion
● frequency
● quantity
● data type
50.
PyCon Italia 2025
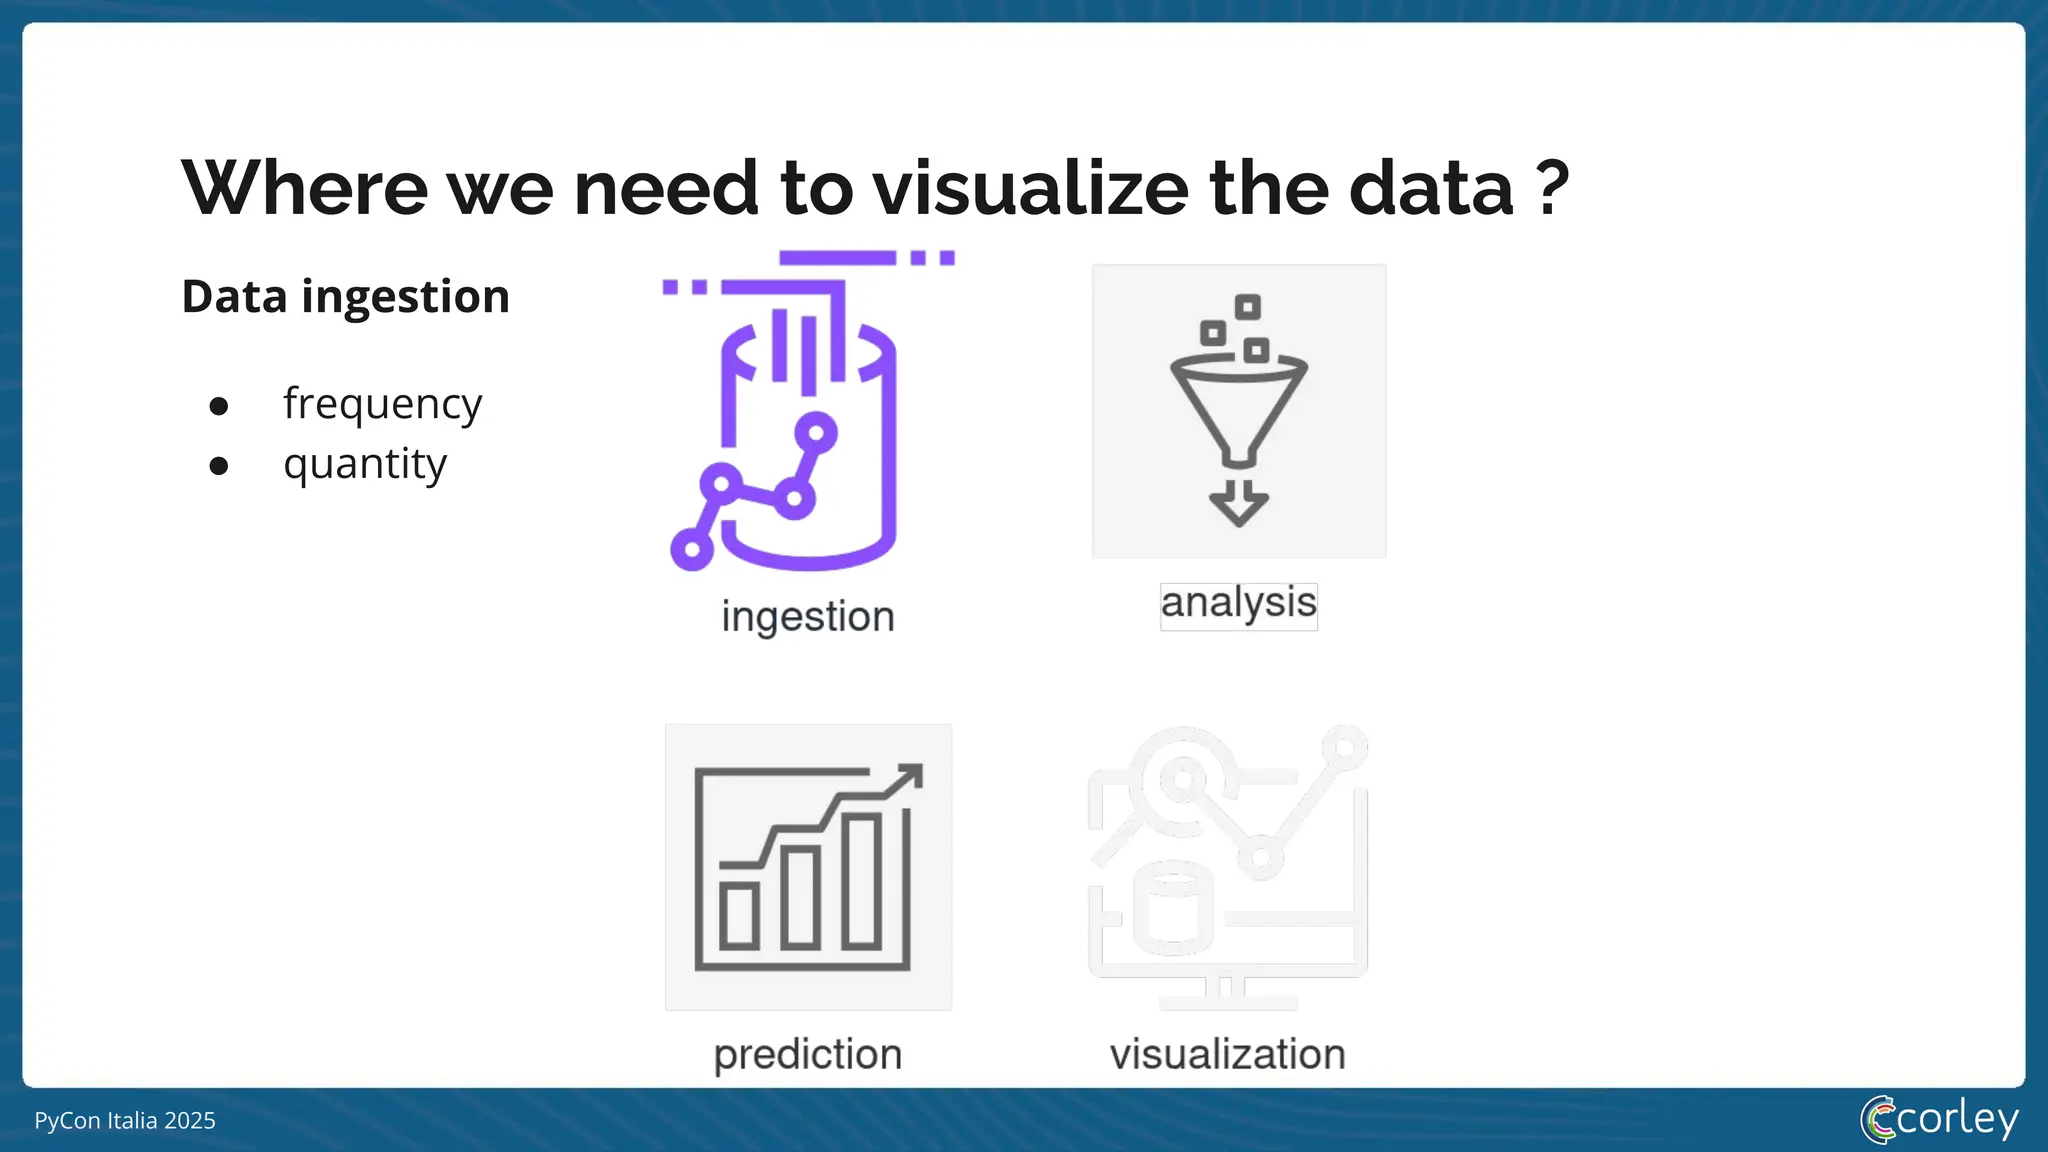
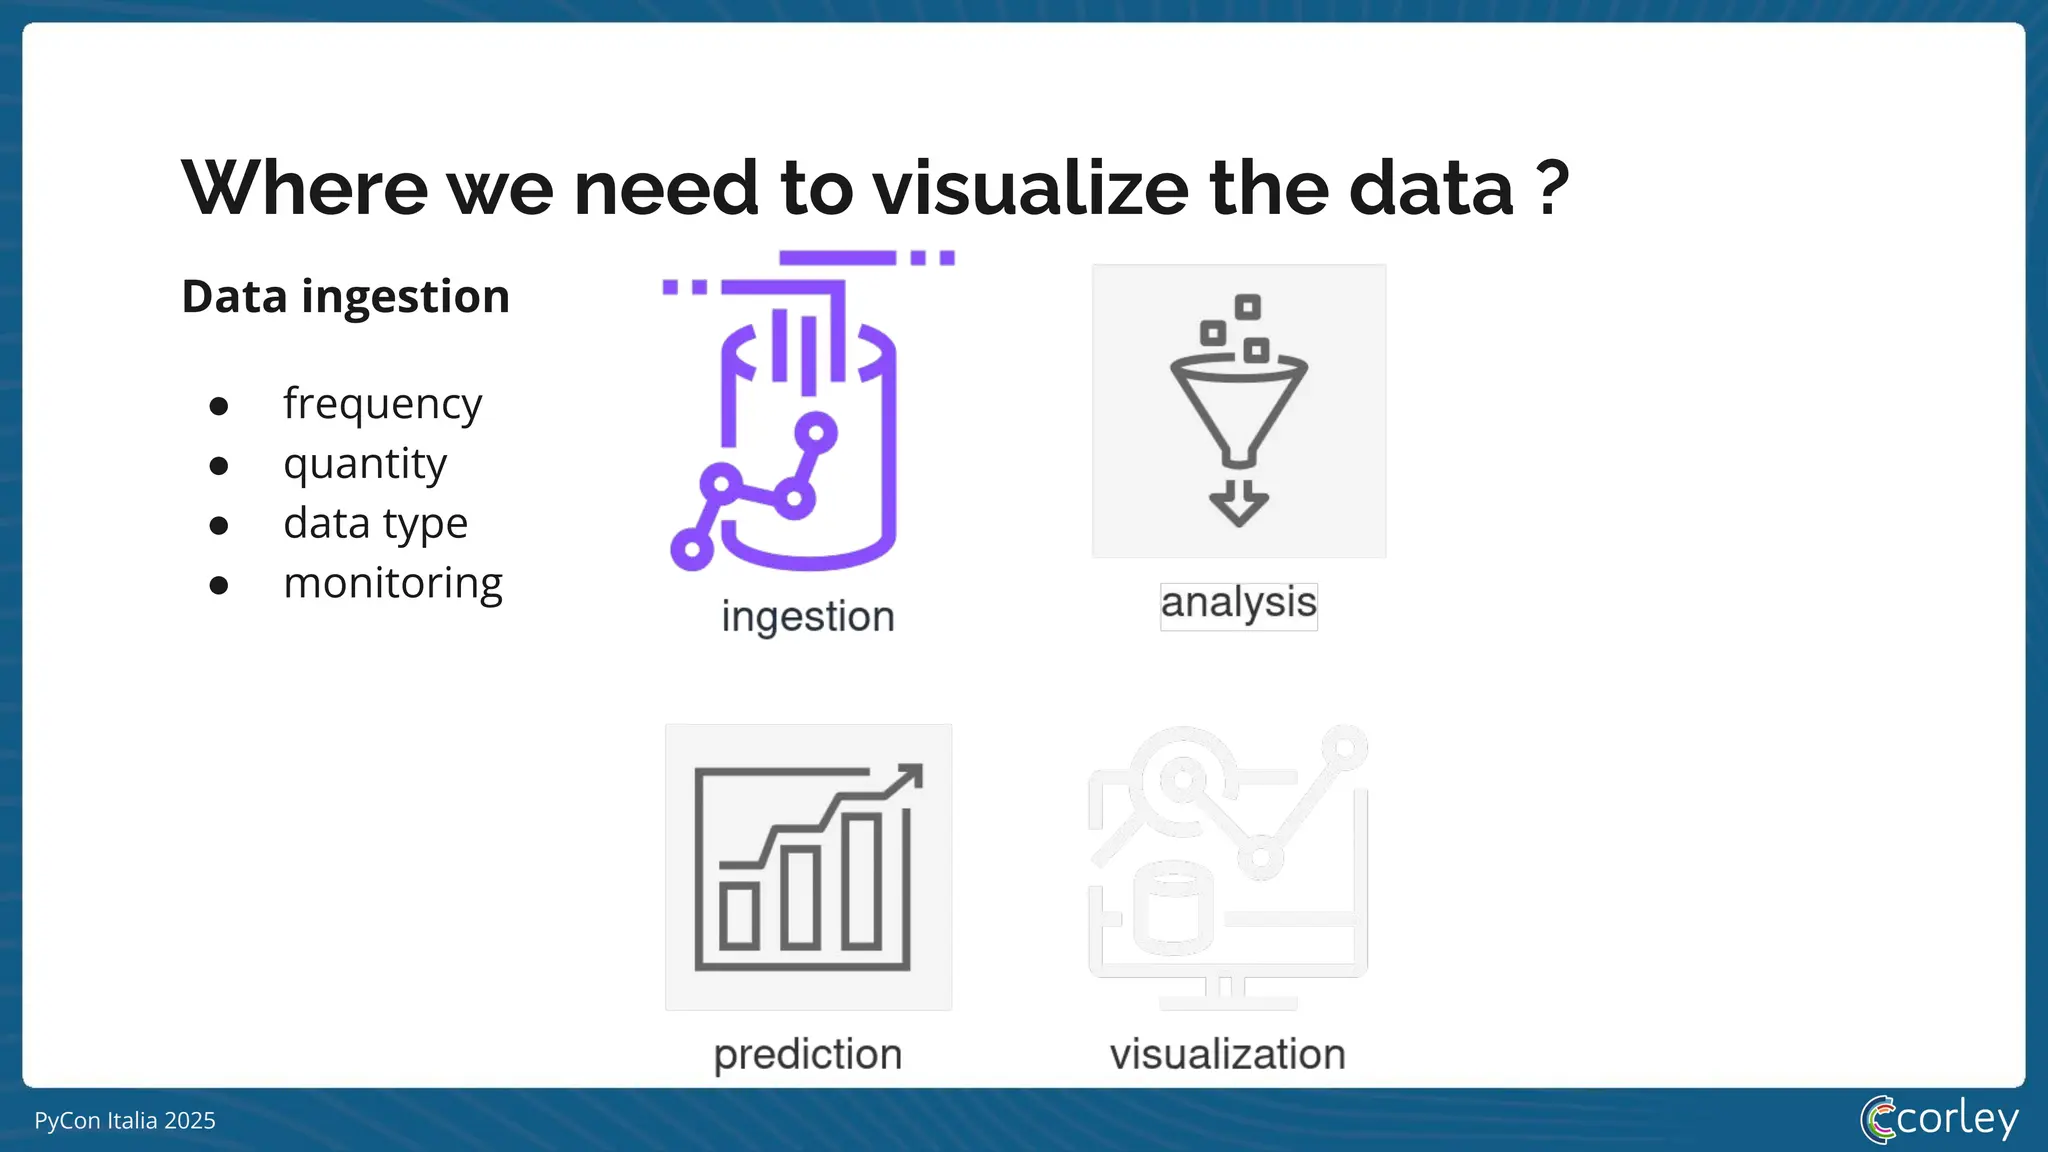
Wherewe need to visualize the data ?
Data ingestion
● frequency
● quantity
● data type
● monitoring
PyCon Italia 2025
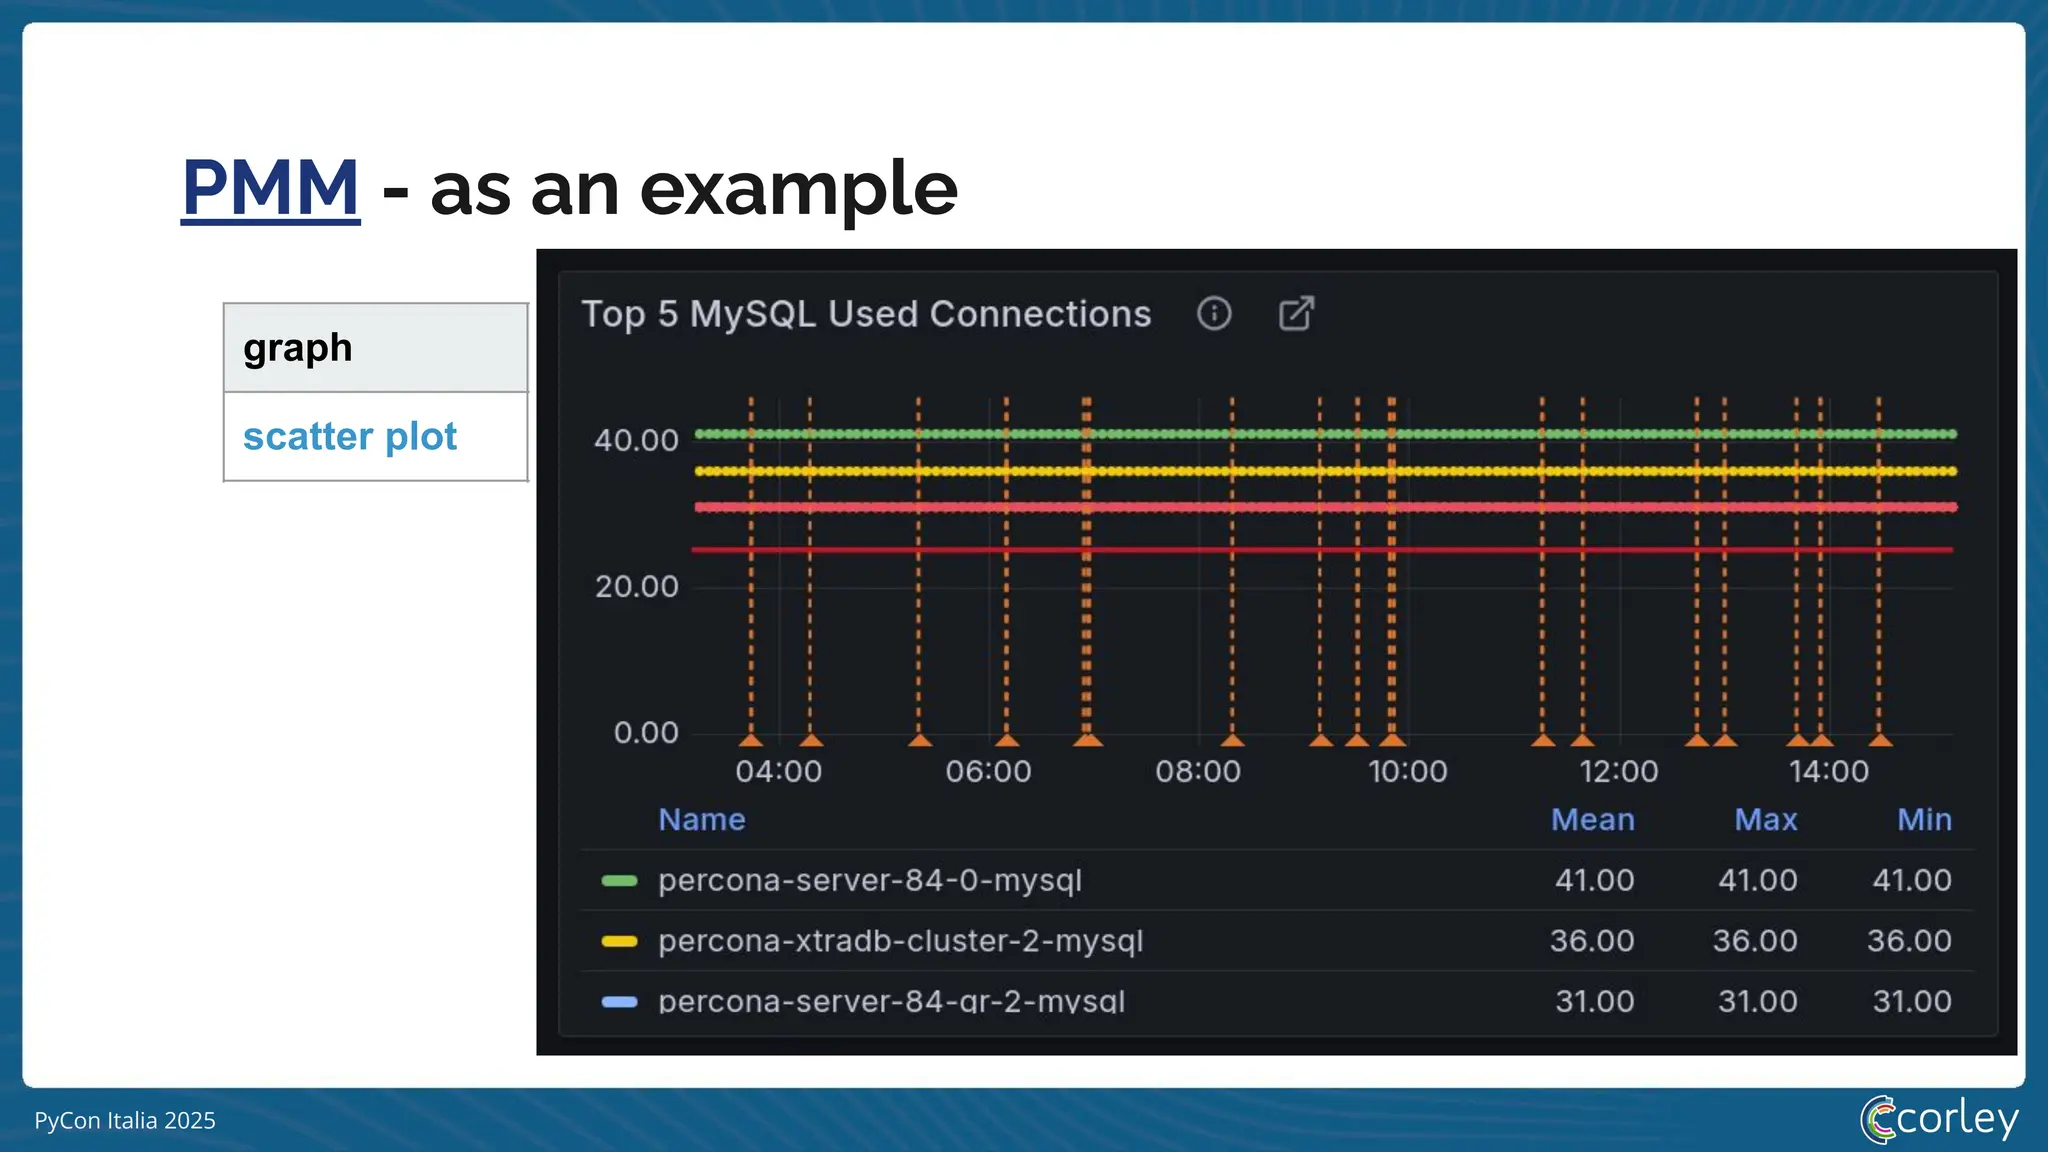
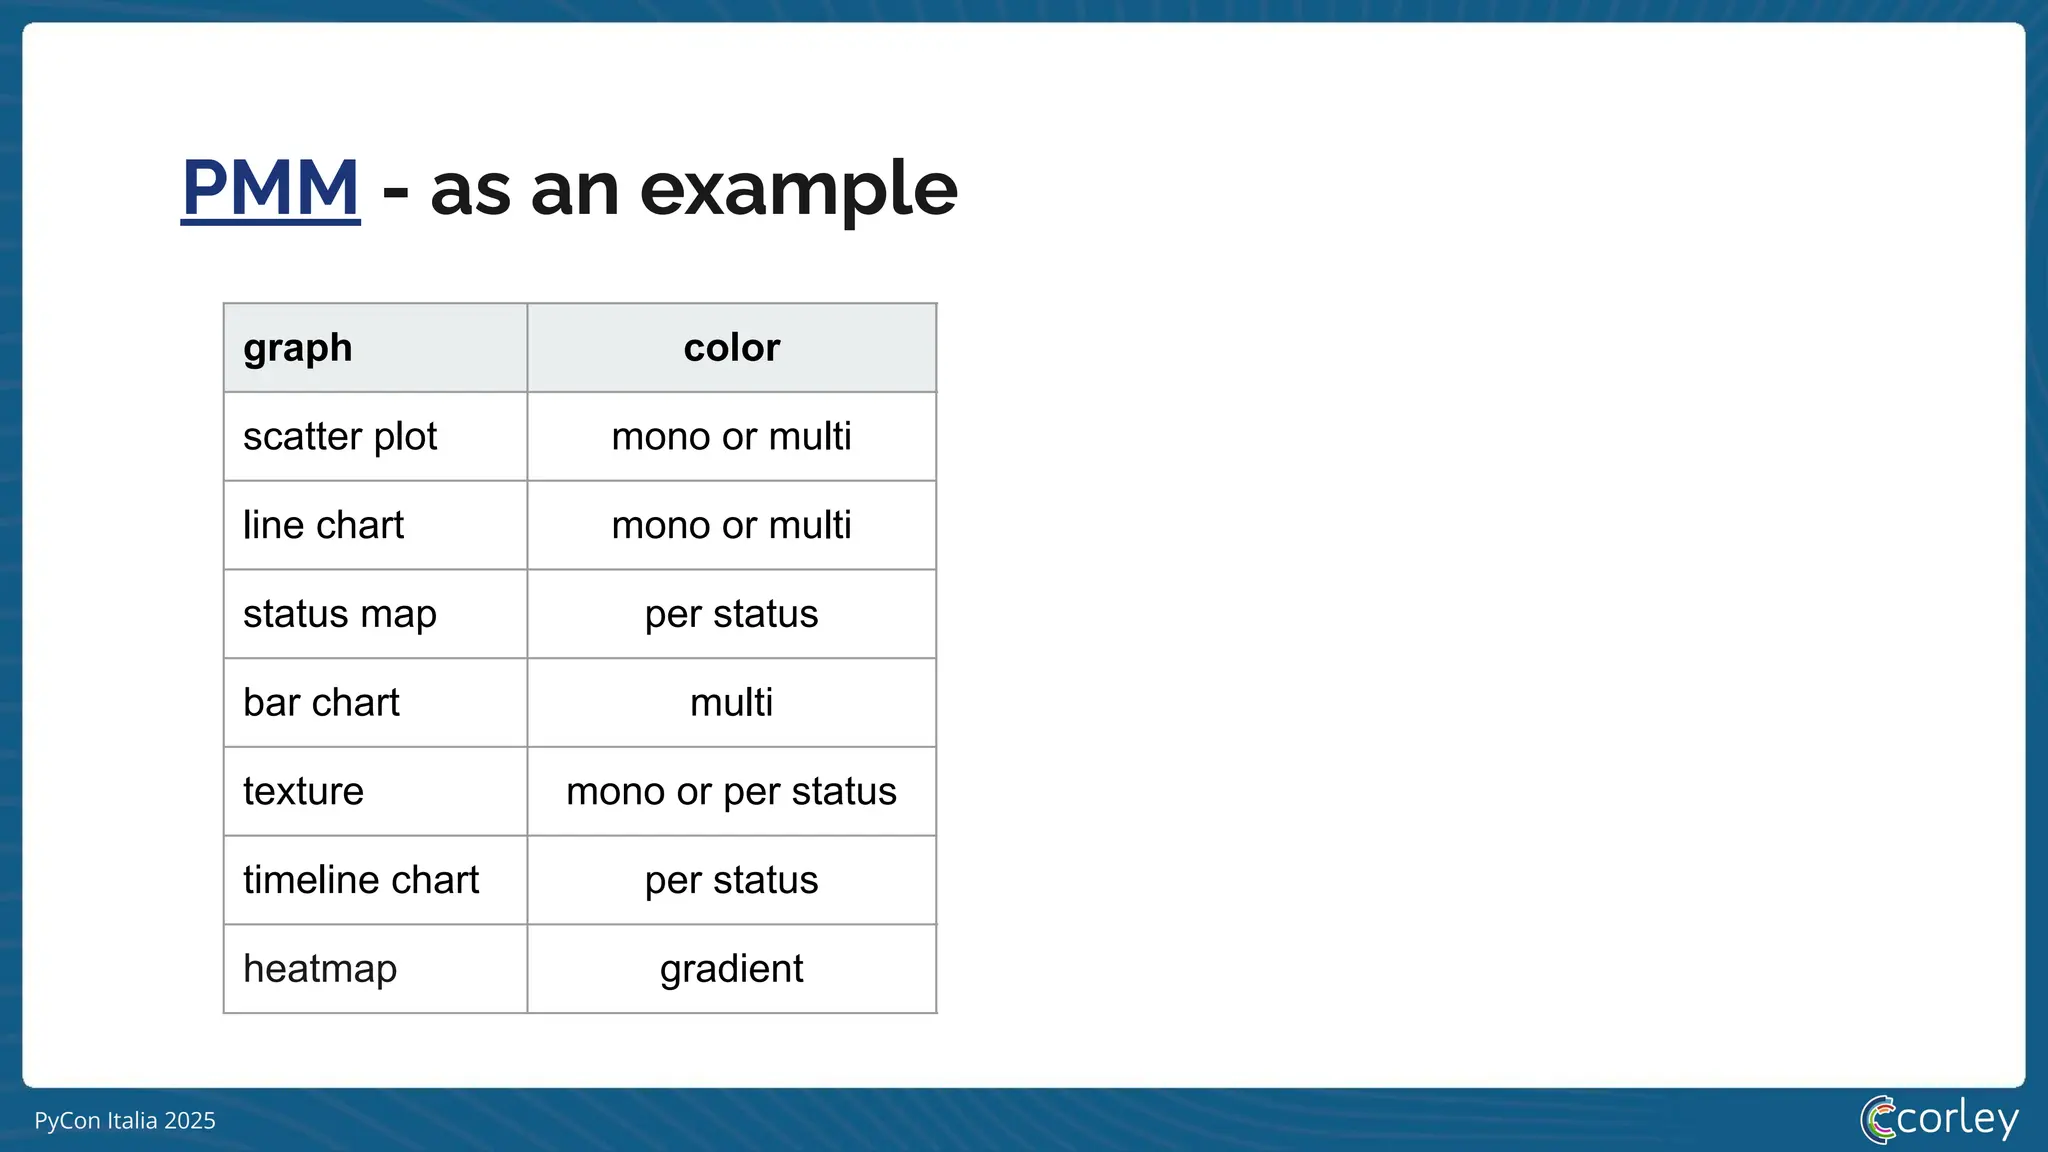
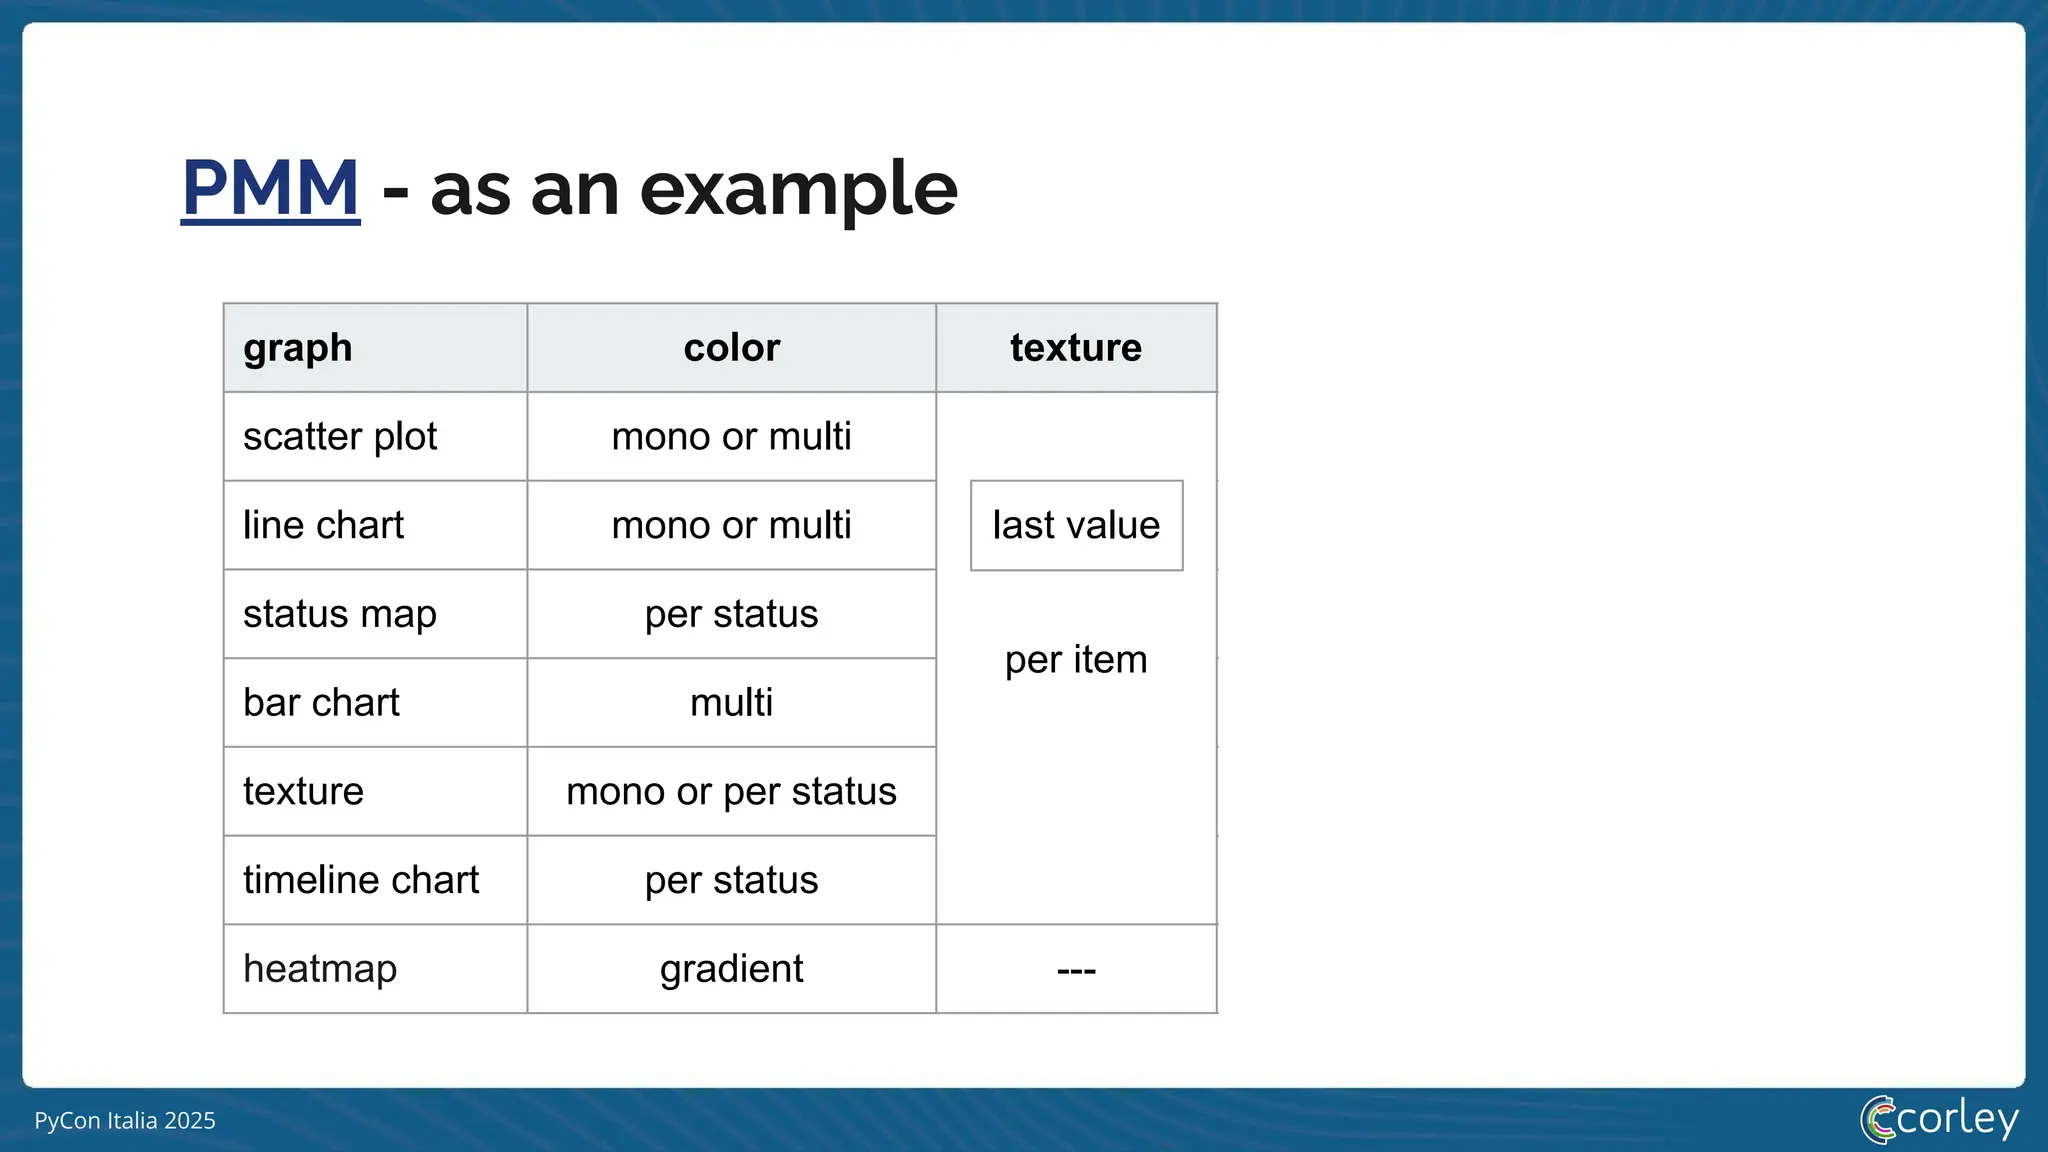
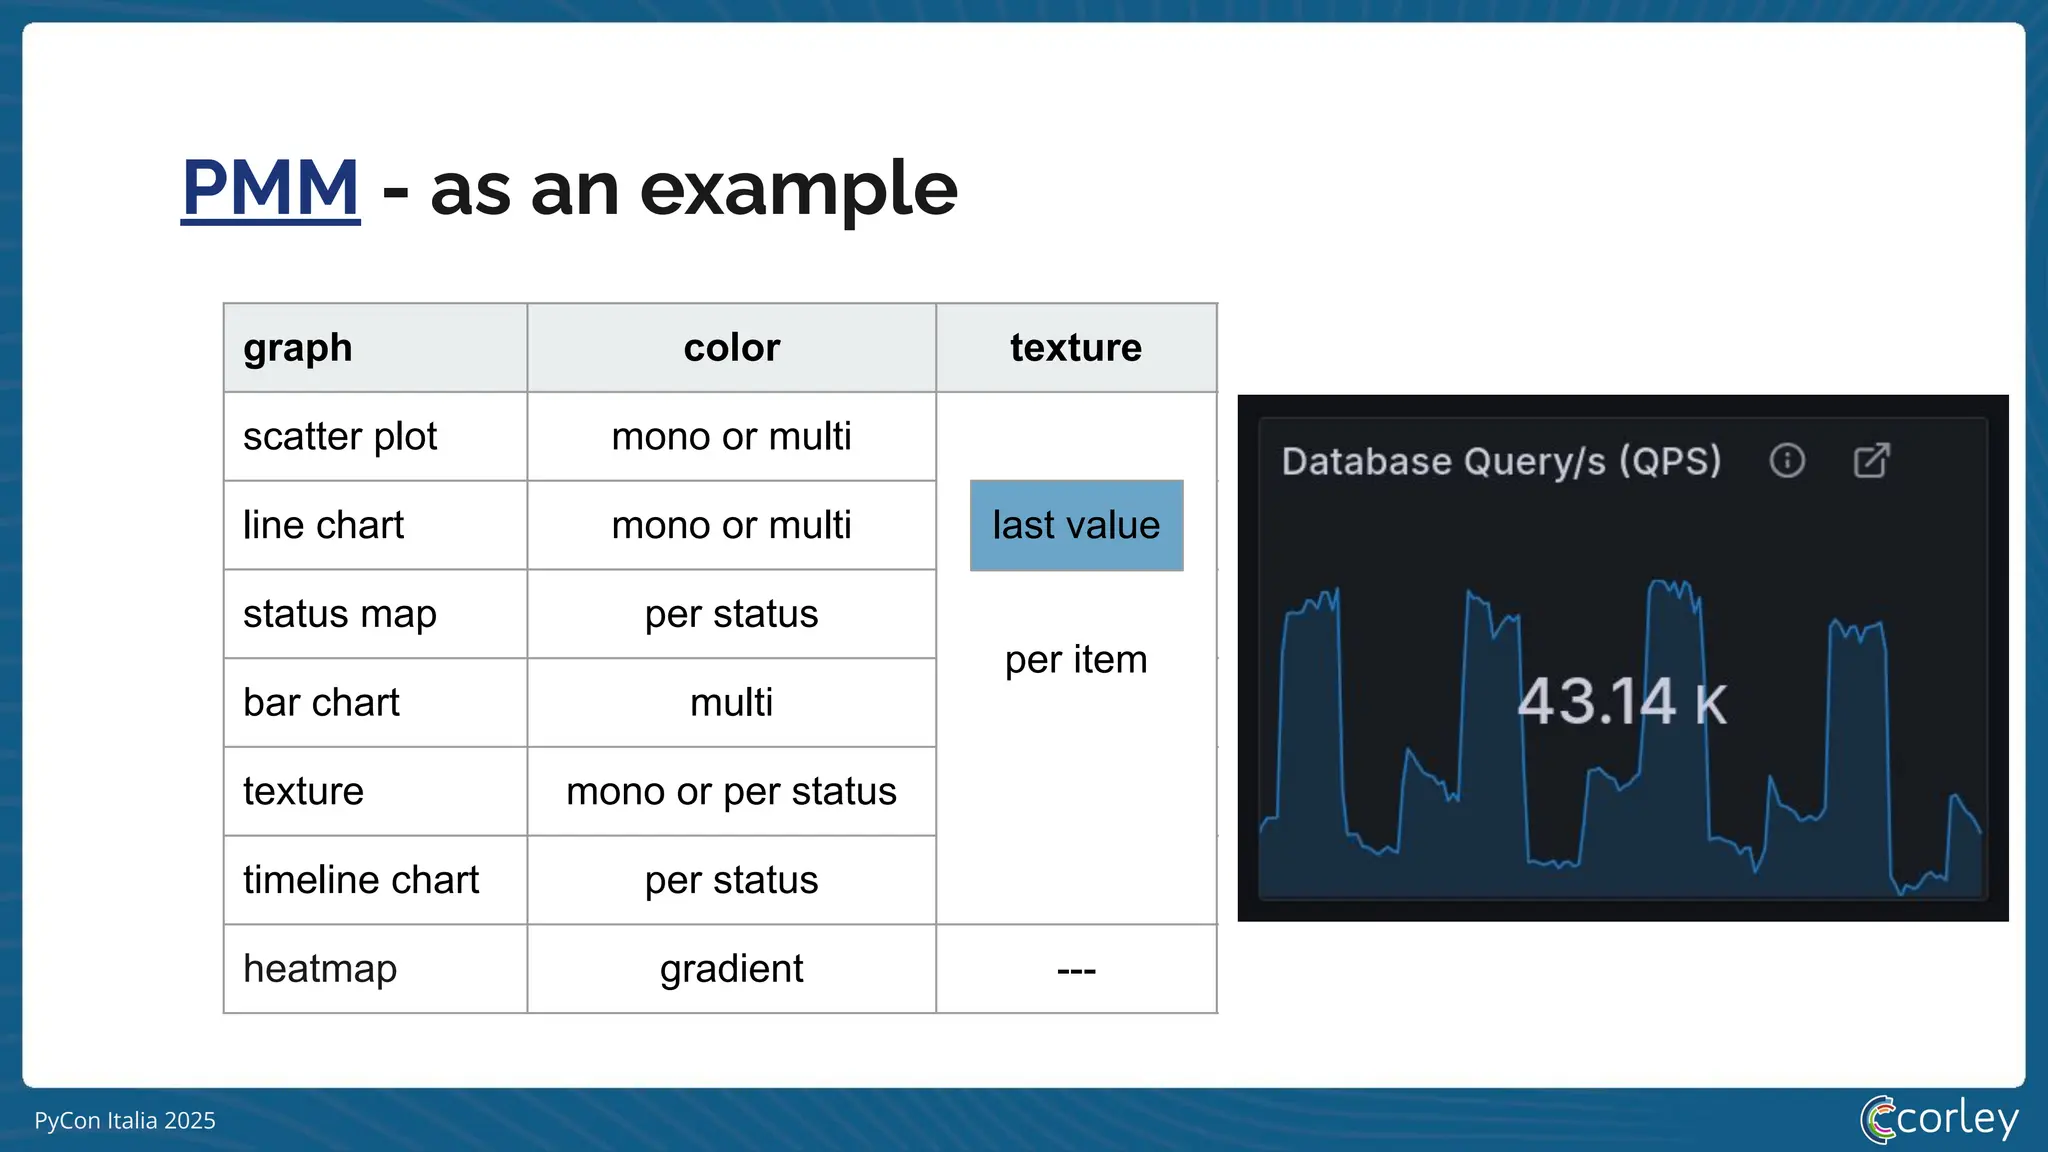
PMM- as an example
graph color texture time tooltip
scatter plot mono or multi
per item
2d
value
line chart mono or multi 2d
status map per status now
bar chart multi 2d
texture mono or per status now ---
timeline chart per status 2d last value
heatmap gradient --- 2d bar chart
last value
54.
PyCon Italia 2025
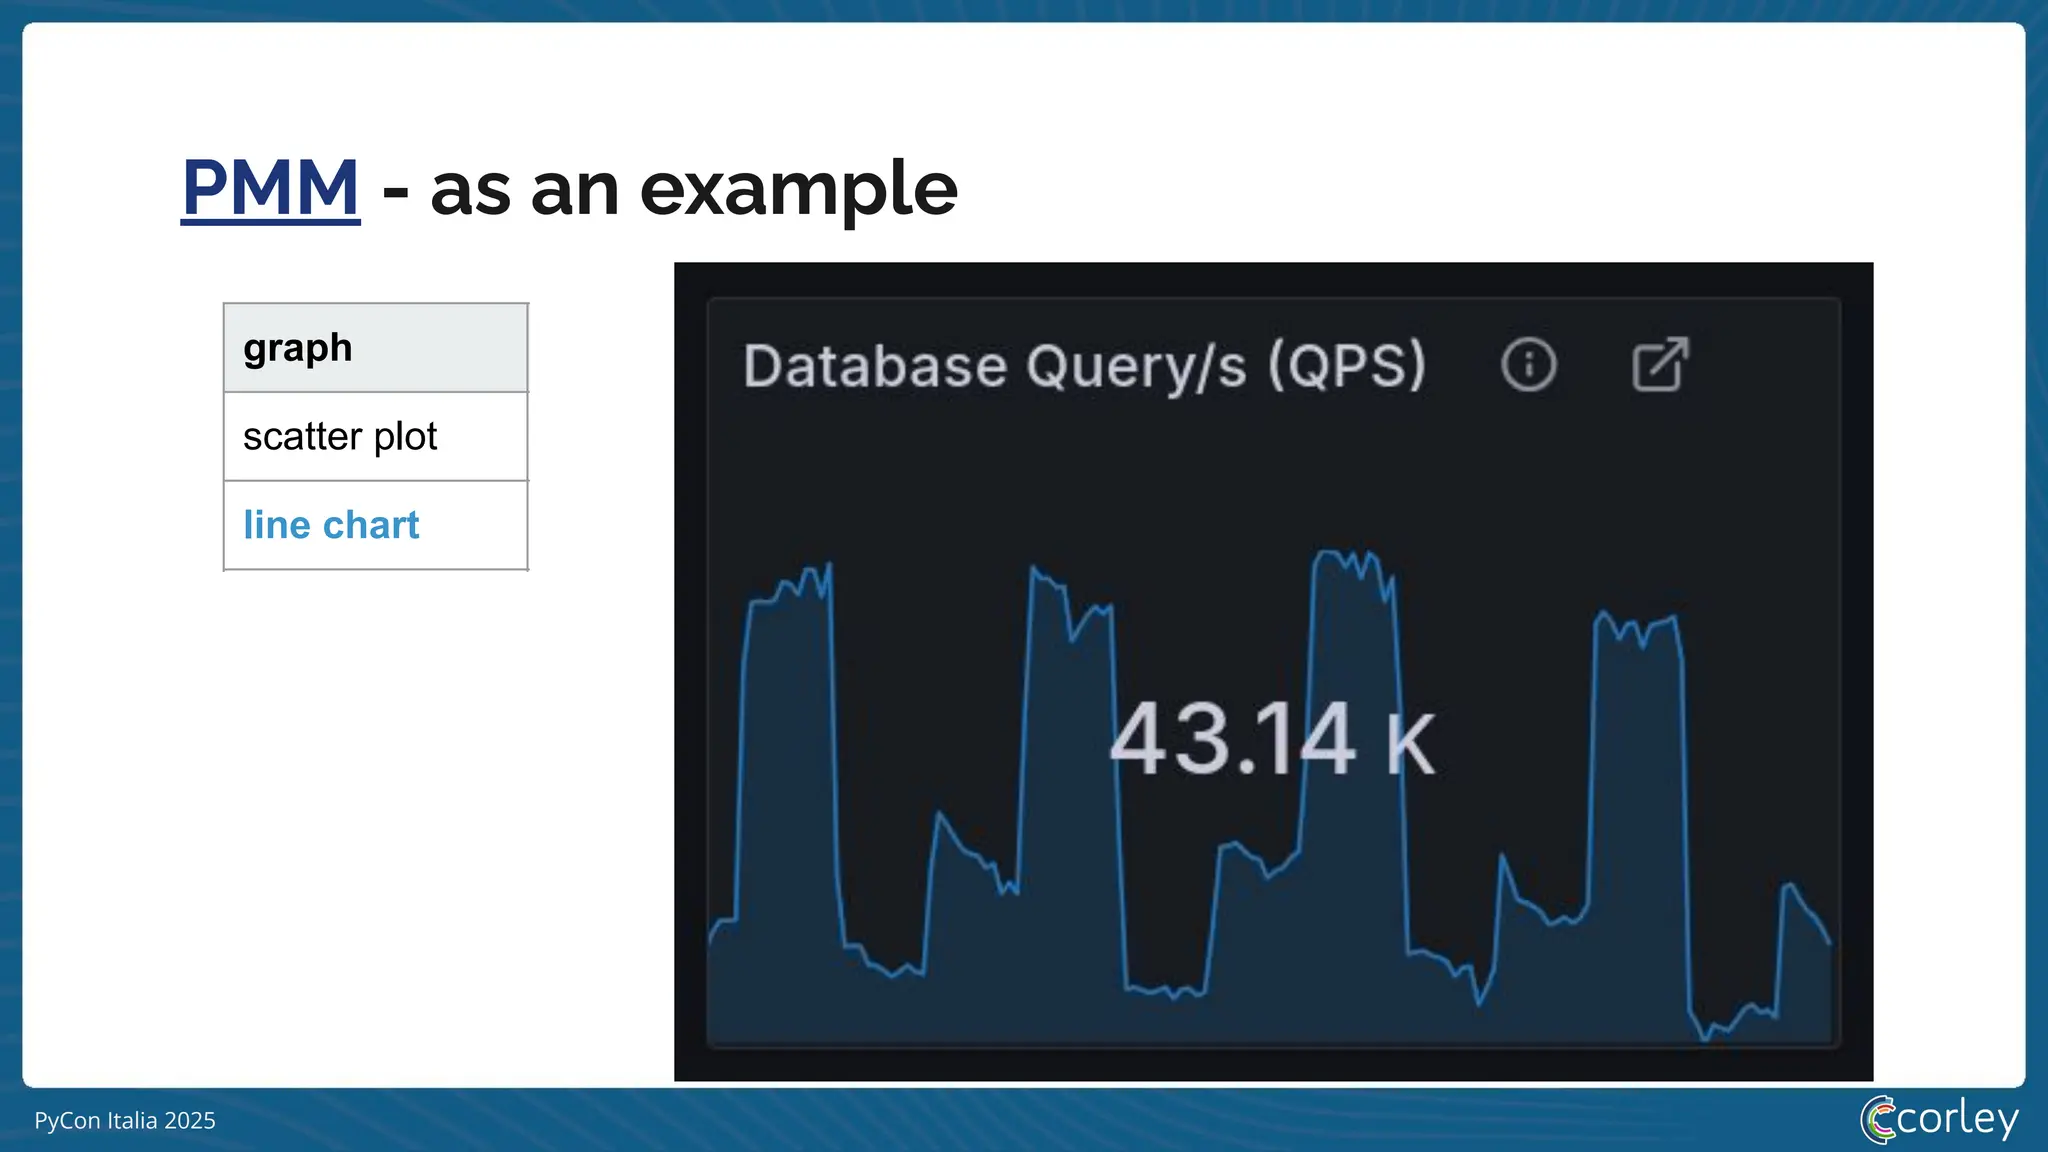
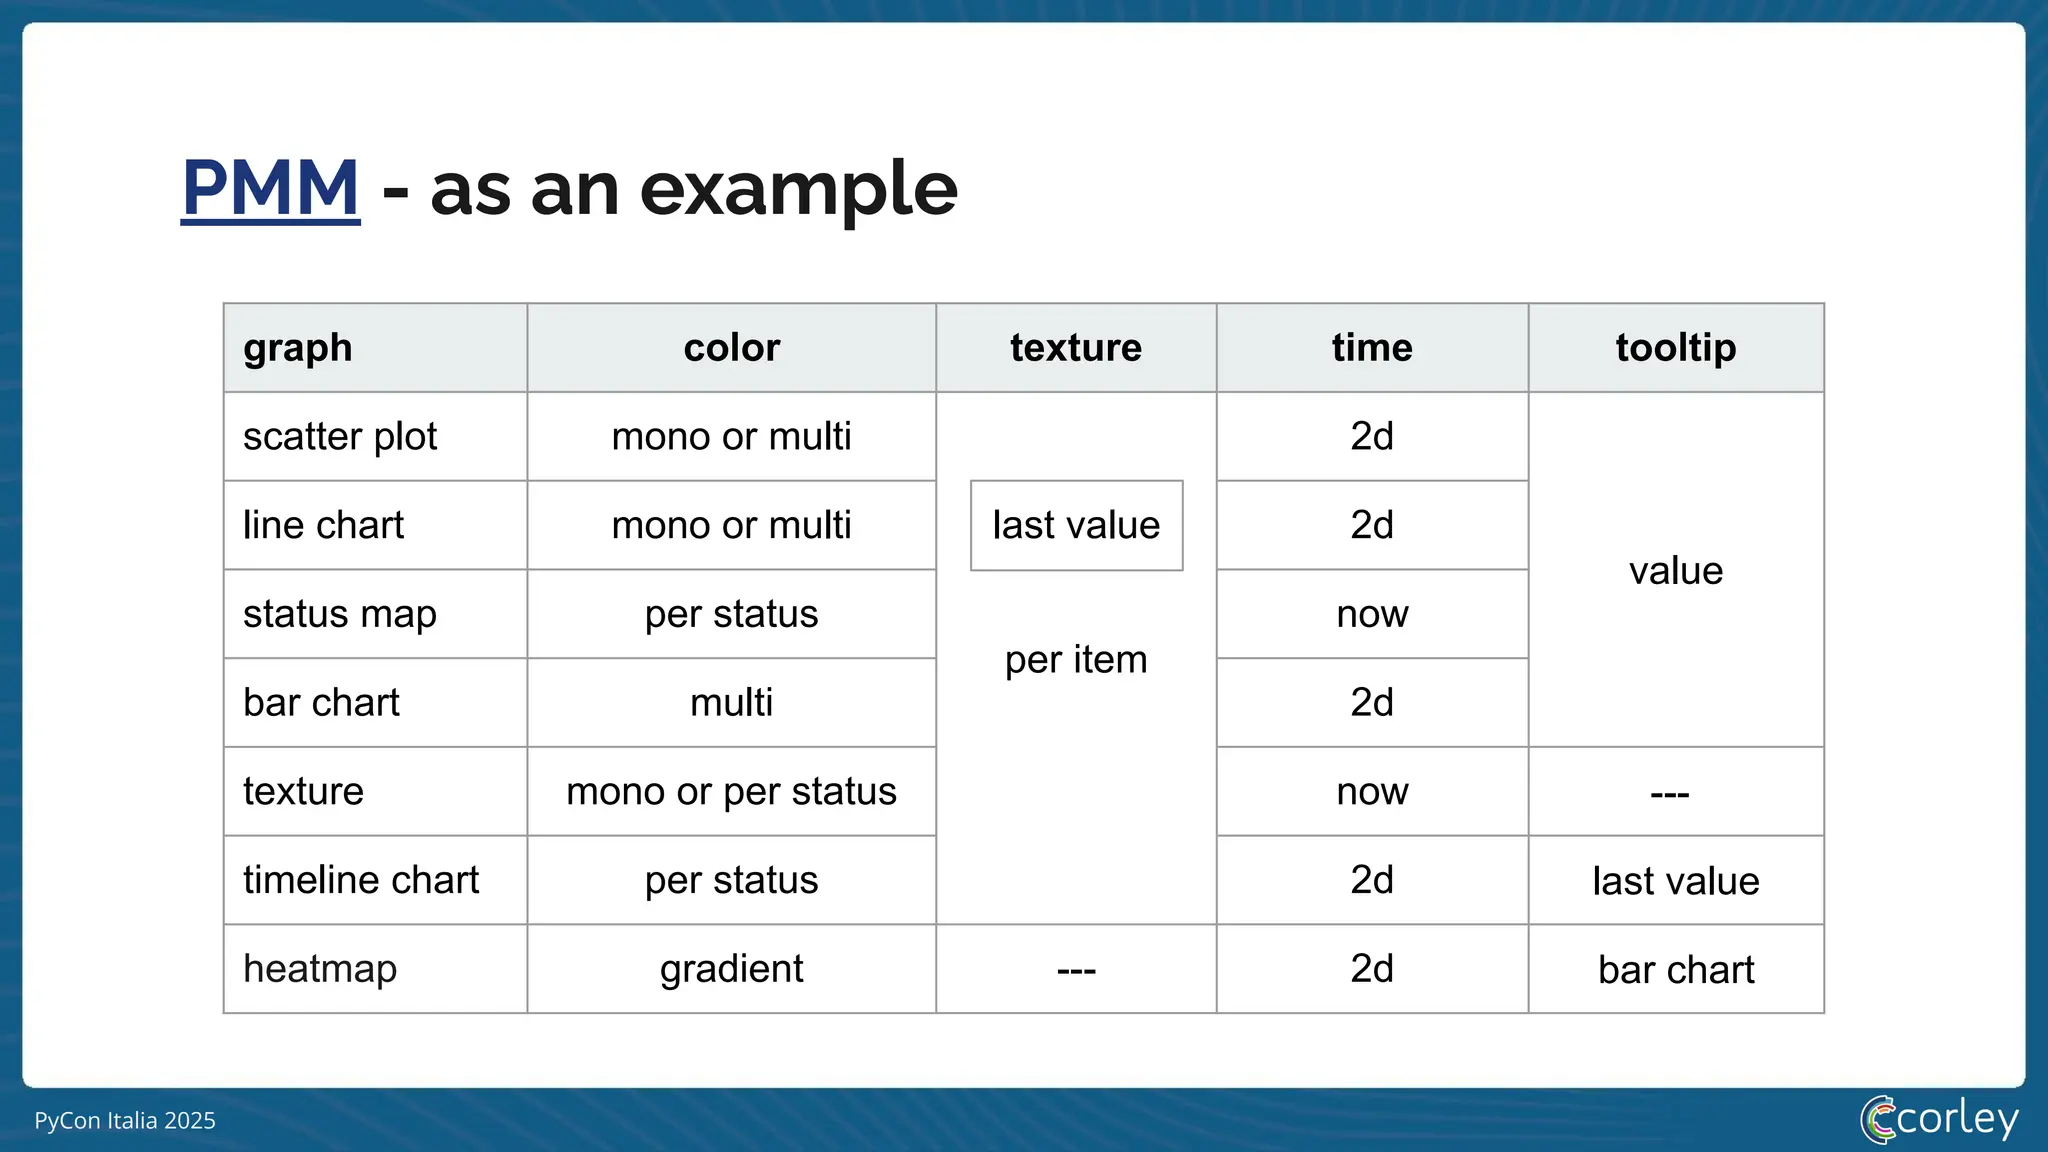
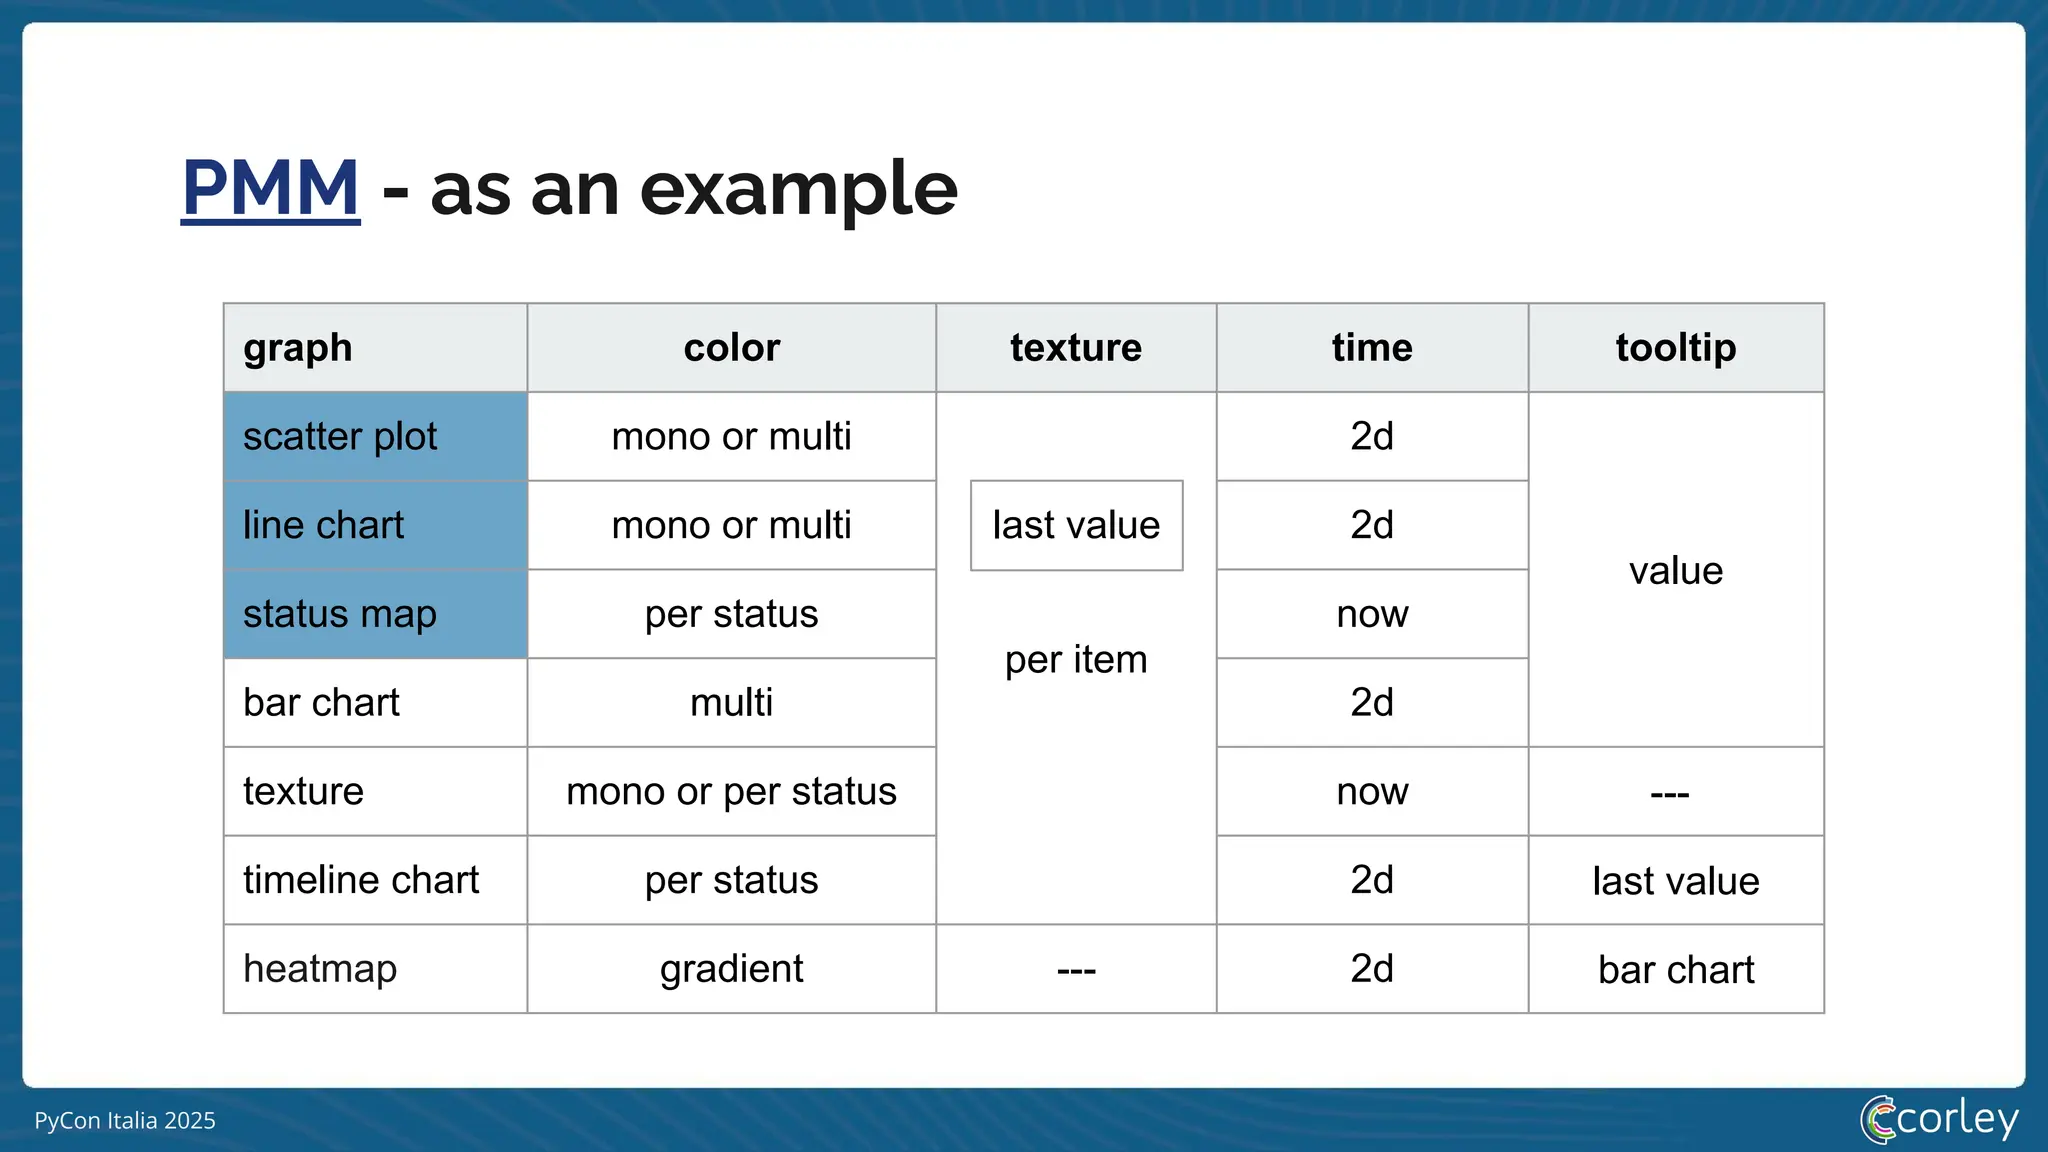
PMM- as an example
graph color texture time tooltip
scatter plot mono or multi
per item
2d
value
line chart mono or multi 2d
status map per status now
bar chart multi 2d
texture mono or per status now ---
timeline chart per status 2d last value
heatmap gradient --- 2d bar chart
last value
55.
PyCon Italia 2025
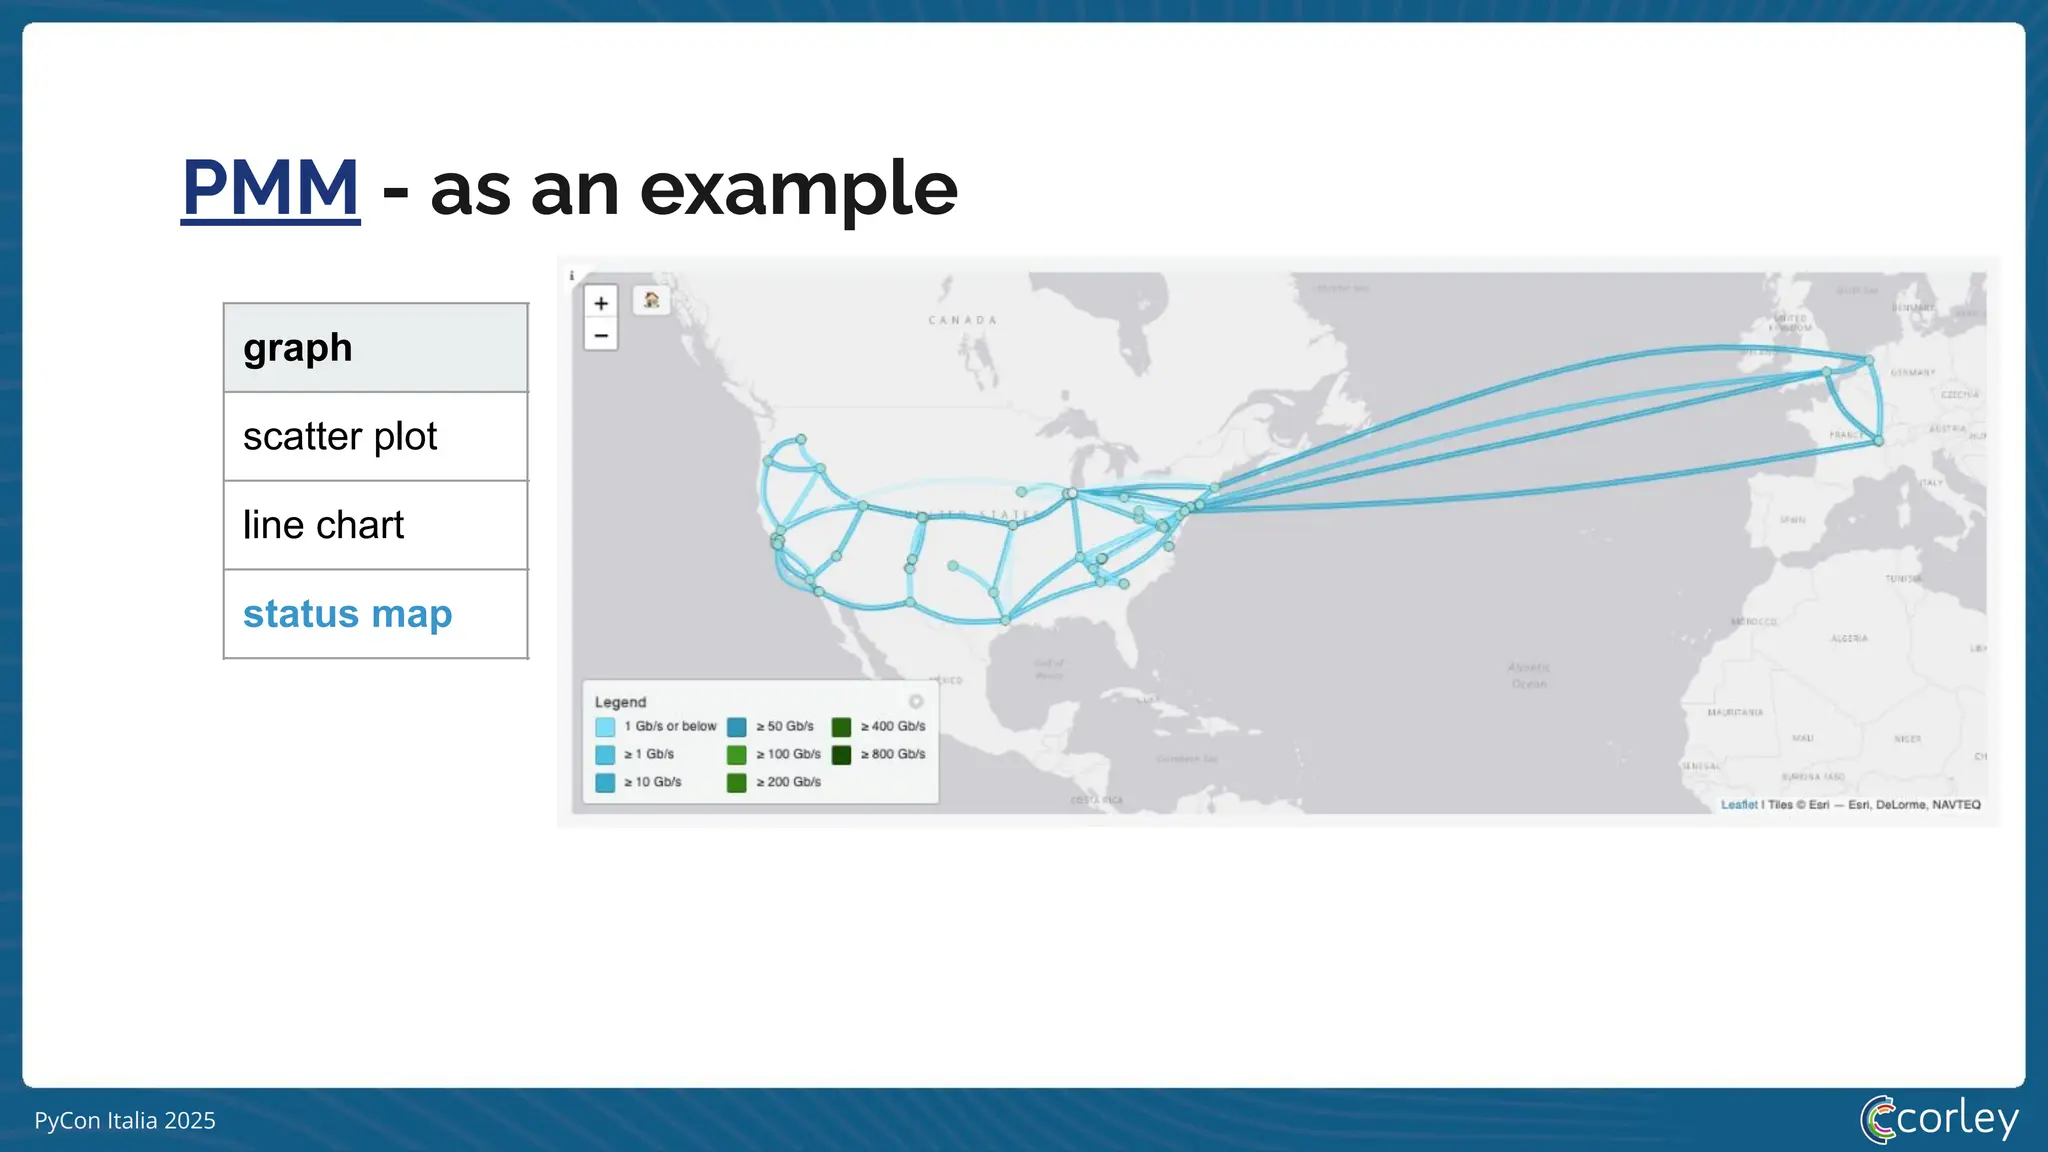
PMM- as an example
graph color texture time tooltip
scatter plot mono or multi
per item
2d
value
line chart mono or multi 2d
status map per status now
bar chart multi 2d
texture mono or per status now ---
timeline chart per status 2d last value
heatmap gradient --- 2d bar chart
last value
56.
PyCon Italia 2025
PMM- as an example
graph color texture time tooltip
scatter plot mono or multi
per item
2d
value
line chart mono or multi 2d
status map per status now
bar chart multi 2d
texture mono or per status now ---
timeline chart per status 2d last value
heatmap gradient --- 2d bar chart
last value
57.
PyCon Italia 2025
PMM- as an example
graph color texture time tooltip
scatter plot mono or multi
per item
2d
value
line chart mono or multi 2d
status map per status now
bar chart multi 2d
texture mono or per status now ---
timeline chart per status 2d last value
heatmap gradient --- 2d bar chart
last value
58.
PyCon Italia 2025
PMM- as an example
graph color texture time tooltip
scatter plot mono or multi
per item
2d
value
line chart mono or multi 2d
status map per status now
bar chart multi 2d
texture mono or per status now ---
timeline chart per status 2d last value
heatmap gradient --- 2d bar chart
last value
59.
PyCon Italia 2025
PMM- as an example
graph color texture time tooltip
scatter plot mono or multi
per item
2d
value
line chart mono or multi 2d
status map per status now
bar chart multi 2d
texture mono or per status now ---
timeline chart per status 2d last value
heatmap gradient --- 2d bar chart
last value
60.
PyCon Italia 2025
PMM- as an example
graph color texture time tooltip
scatter plot mono or multi
per item
2d
value
line chart mono or multi 2d
status map per status now
bar chart multi 2d
texture mono or per status now ---
timeline chart per status 2d last value
heatmap gradient --- 2d bar chart
last value
61.
PyCon Italia 2025
PMM- as an example
graph color texture time tooltip
scatter plot mono or multi
per item
2d
value
line chart mono or multi 2d
status map per status now
bar chart multi 2d
texture mono or per status now ---
timeline chart per status 2d last value
heatmap gradient --- 2d bar chart
last value
62.
PyCon Italia 2025
PMM- as an example
graph color texture time tooltip
scatter plot mono or multi
per item
2d
value
line chart mono or multi 2d
status map per status now
bar chart multi 2d
texture mono or per status now ---
timeline chart per status 2d last value
heatmap gradient --- 2d bar chart
last value
63.
PyCon Italia 2025
PMM- as an example
graph color texture time tooltip
scatter plot mono or multi
per item
2d
value
line chart mono or multi 2d
status map per status now
bar chart multi 2d
texture mono or per status now ---
timeline chart per status 2d last value
heatmap gradient --- 2d bar chart
last value
64.
PyCon Italia 2025
PMM- as an example
graph color texture time tooltip
scatter plot mono or multi
per item
2d
value
line chart mono or multi 2d
status map per status now
bar chart multi 2d
texture mono or per status now ---
timeline chart per status 2d last value
heatmap gradient --- 2d bar chart
last value
65.
PyCon Italia 2025
PMM- as an example
graph color texture time tooltip
scatter plot mono or multi
per item
2d
value
line chart mono or multi 2d
status map per status now
bar chart multi 2d
texture mono or per status now ---
timeline chart per status 2d last value
heatmap gradient --- 2d bar chart
last value
https://pilestone.com/pages/color-blindness-simulator
66.
PyCon Italia 2025
PMM- as an example
graph color texture time tooltip
scatter plot mono or multi
per item
2d
value
line chart mono or multi 2d
status map per status now
bar chart multi 2d
texture mono or per status now ---
timeline chart per status 2d last value
heatmap gradient --- 2d bar chart
last value
67.
PyCon Italia 2025
PMM- as an example
graph color texture time tooltip
scatter plot mono or multi
per item
2d
value
line chart mono or multi 2d
status map per status now
bar chart multi 2d
texture mono or per status now ---
timeline chart per status 2d last value
heatmap gradient --- 2d bar chart
last value
68.
PyCon Italia 2025
PMM- as an example
graph color texture time tooltip
scatter plot mono or multi
per item
2d
value
line chart mono or multi 2d
status map per status now
bar chart multi 2d
texture mono or per status now ---
timeline chart per status 2d last value
heatmap gradient --- 2d bar chart
last value
69.
PyCon Italia 2025
PMM- as an example
graph color texture time tooltip
scatter plot mono or multi
per item
2d
value
line chart mono or multi 2d
status map per status now
bar chart multi 2d
texture mono or per status now ---
timeline chart per status 2d last value
heatmap gradient --- 2d bar chart
last value
70.
PyCon Italia 2025
PMM- as an example
graph color texture time tooltip
scatter plot mono or multi
per item
2d
value
line chart mono or multi 2d
status map per status now
bar chart multi 2d
texture mono or per status now ---
timeline chart per status 2d last value
heatmap gradient --- 2d bar chart
last value
71.
PyCon Italia 2025
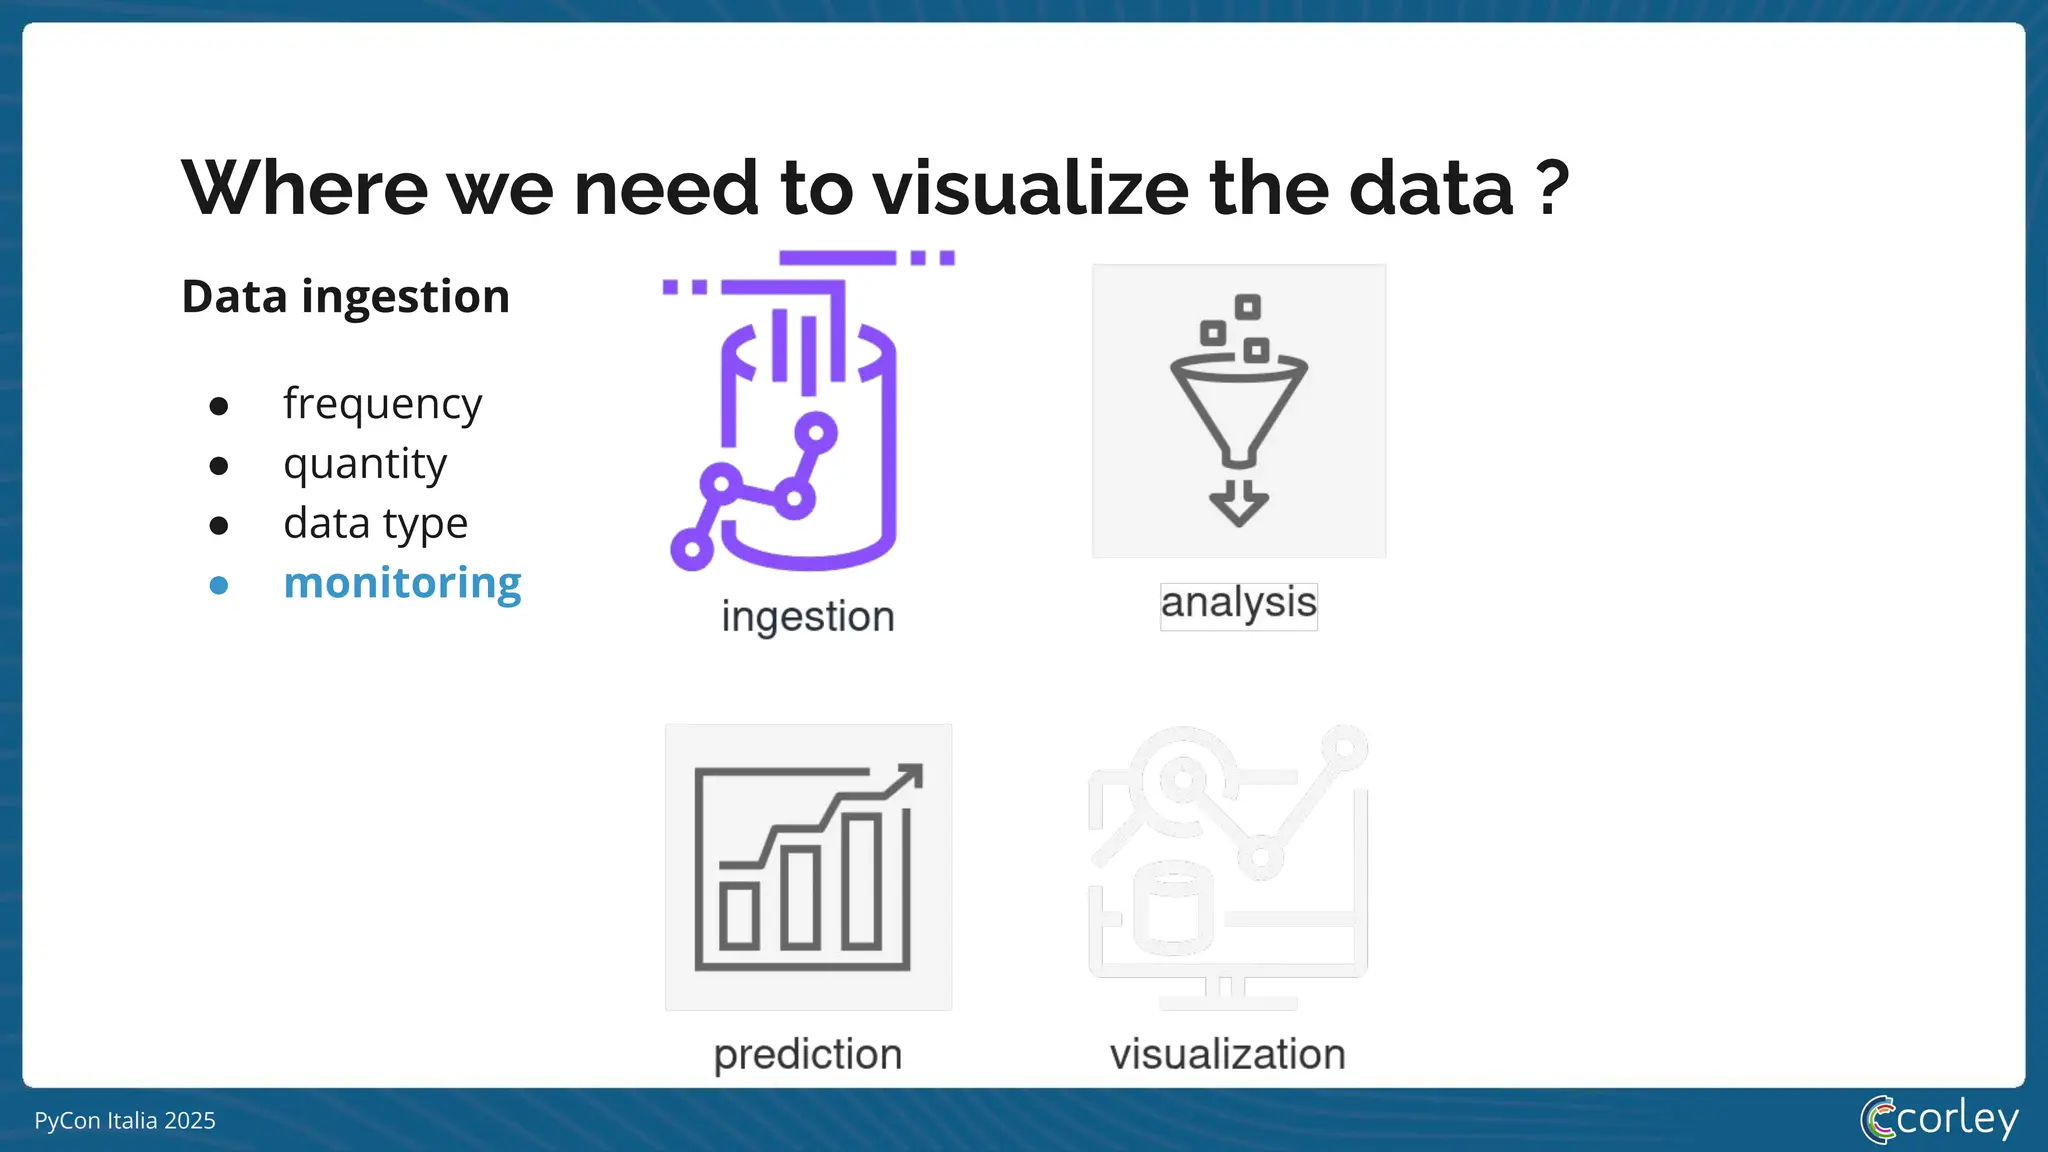
Wherewe need to visualize the data ?
Data ingestion
● frequency
● quantity
● data type
● monitoring


![[DSC Europe 25] Marija Vlajkovic & Andrea Radonjanin - Integration of AI tool...](https://cdn.slidesharecdn.com/ss_thumbnails/qf1jrglttoc3bm8s3aop-final-integration-of-ai-tools-251208151905-394f3a6a-thumbnail.jpg?width=640&height=640&fit=bounds)

![[DSC Europe 25] Vladimir Jelic - The AI-Driven Security Shift From Reactive D...](https://cdn.slidesharecdn.com/ss_thumbnails/6g5gj25mtjwayniqem1t-6-251209104645-7a5a5fc6-thumbnail.jpg?width=640&height=640&fit=bounds)
![[DSC Europe 25] Debmalya Biswas - Agentification: the art of transforming man...](https://cdn.slidesharecdn.com/ss_thumbnails/r5azlggvtqiaiiusrqdr-4-251212103249-5a12c89b-thumbnail.jpg?width=640&height=640&fit=bounds)
![[DSC Europe 25] Branko Urosevic -Rethinking Financial Talent: Integrating Cod...](https://cdn.slidesharecdn.com/ss_thumbnails/8jjrus8ttko6qj64f58f-3-251212103250-642c6374-thumbnail.jpg?width=640&height=640&fit=bounds)

![[DSC Europe 25] Milan Zdravkovic - The road less traveled in District Heating...](https://cdn.slidesharecdn.com/ss_thumbnails/nfaboniqwsz4ucyctnmy-2-milan-zdravkovic-dsc2025-the-road-less-traveled-in-district-heating-operation-251208151905-f56388a5-thumbnail.jpg?width=640&height=640&fit=bounds)
![[DSC Europe 25] Nikolay Burlutskiy - Best Practices for Building Enterprise M...](https://cdn.slidesharecdn.com/ss_thumbnails/uirvaiuvq8y1w8hzd9tx-7-251212103249-2619edb4-thumbnail.jpg?width=640&height=640&fit=bounds)
![[DSC Europe 25] Jon Dajci - Bridging TradFi and DeFi: Building the Future of ...](https://cdn.slidesharecdn.com/ss_thumbnails/fqmhfvlbqhkihjvqvhmu-7-251211083849-6af7e325-thumbnail.jpg?width=640&height=640&fit=bounds)


![[DSC Europe 25] Milan Sekuloski - Data, Defence, and Development: Cybersecuri...](https://cdn.slidesharecdn.com/ss_thumbnails/dfrkwwx4qly6atqpbl4z-4-251209104645-c3d4b0ca-thumbnail.jpg?width=640&height=640&fit=bounds)


![[DSC Europe 25] Dragana Ilic - AI for Big Data in Astronomy.pptx](https://cdn.slidesharecdn.com/ss_thumbnails/8palya86qaatvjhva1ms-2-dragana-ilic-ai-ilic-251208151906-652b819c-thumbnail.jpg?width=640&height=640&fit=bounds)

