Download to read offline
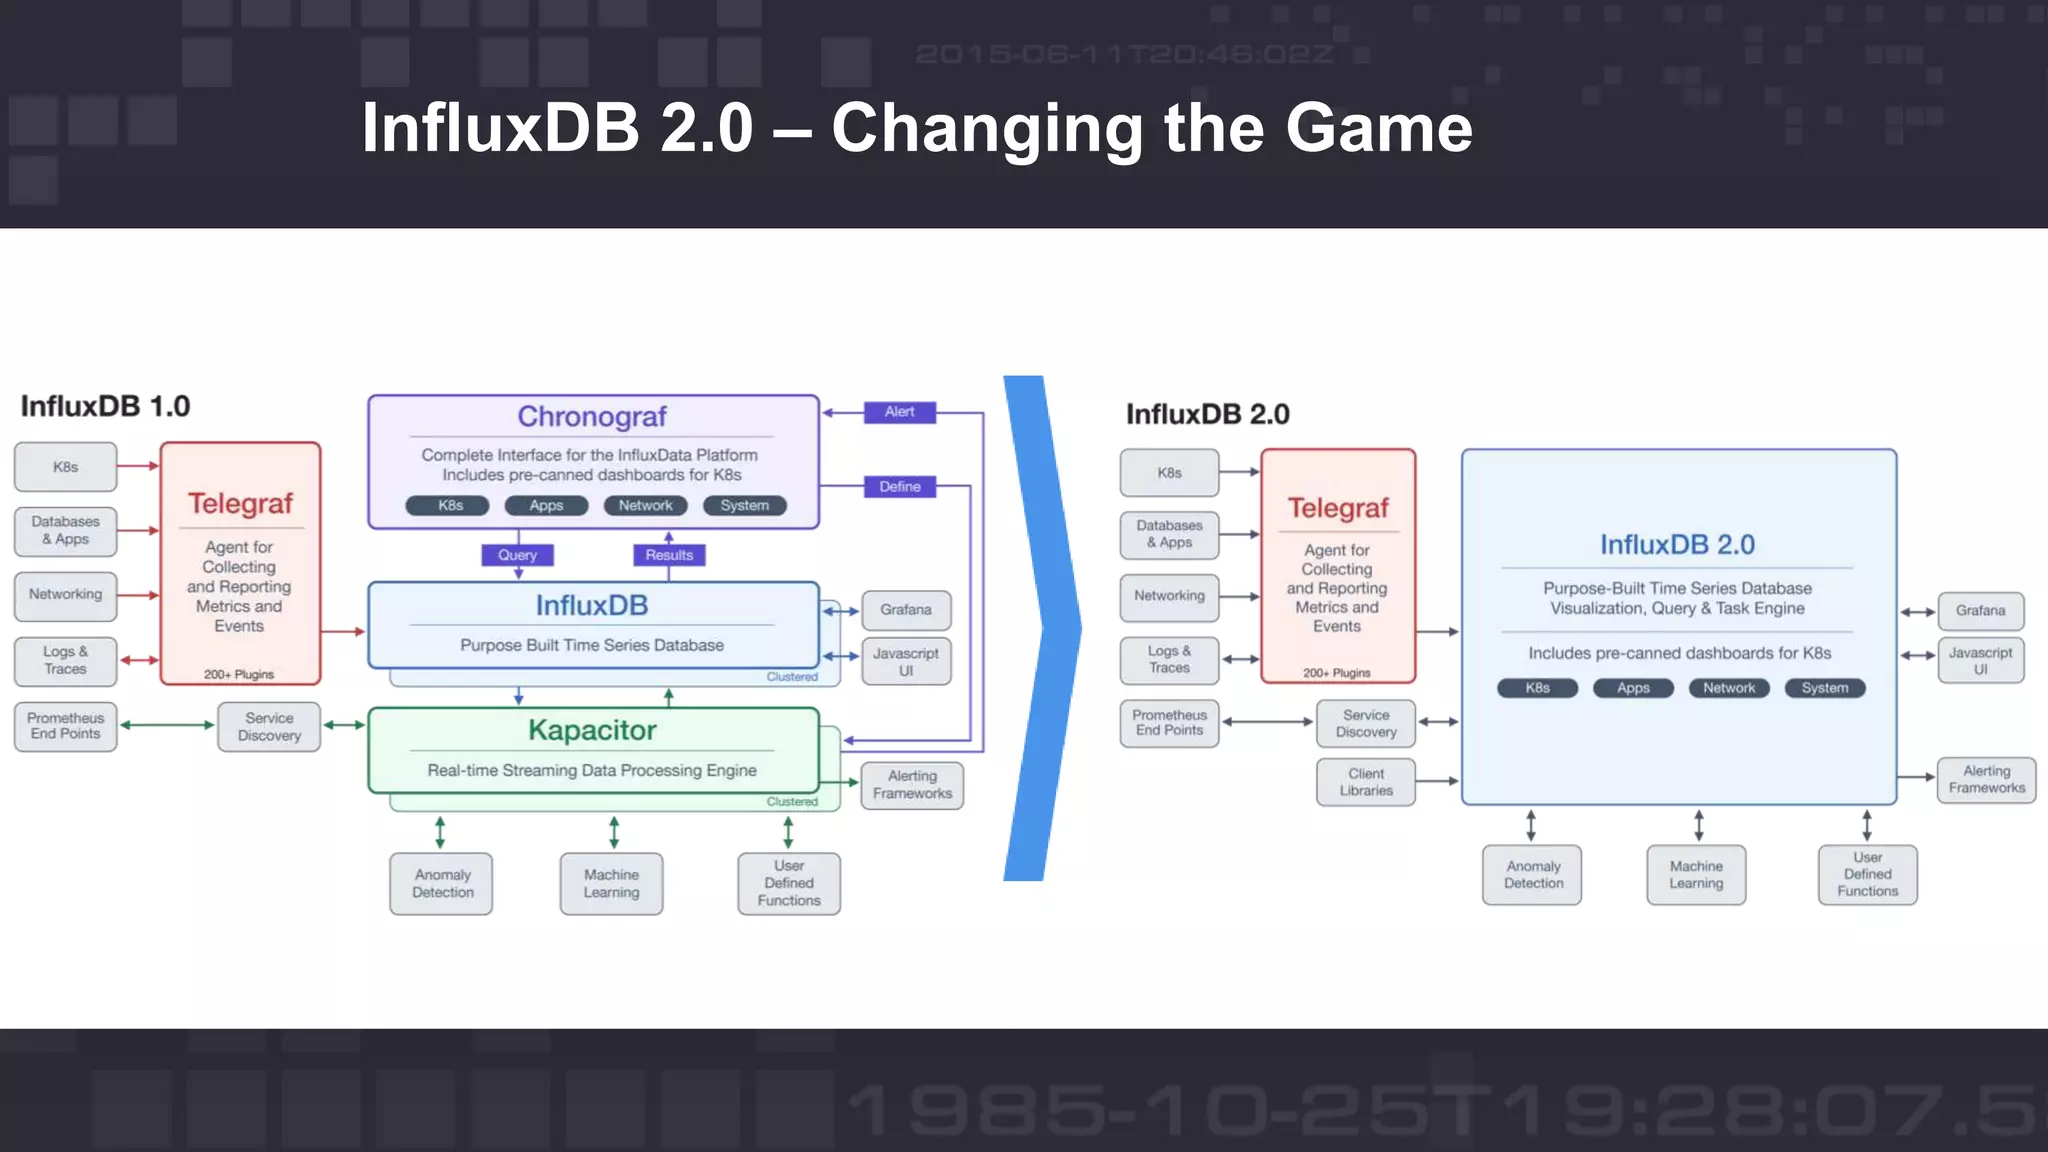
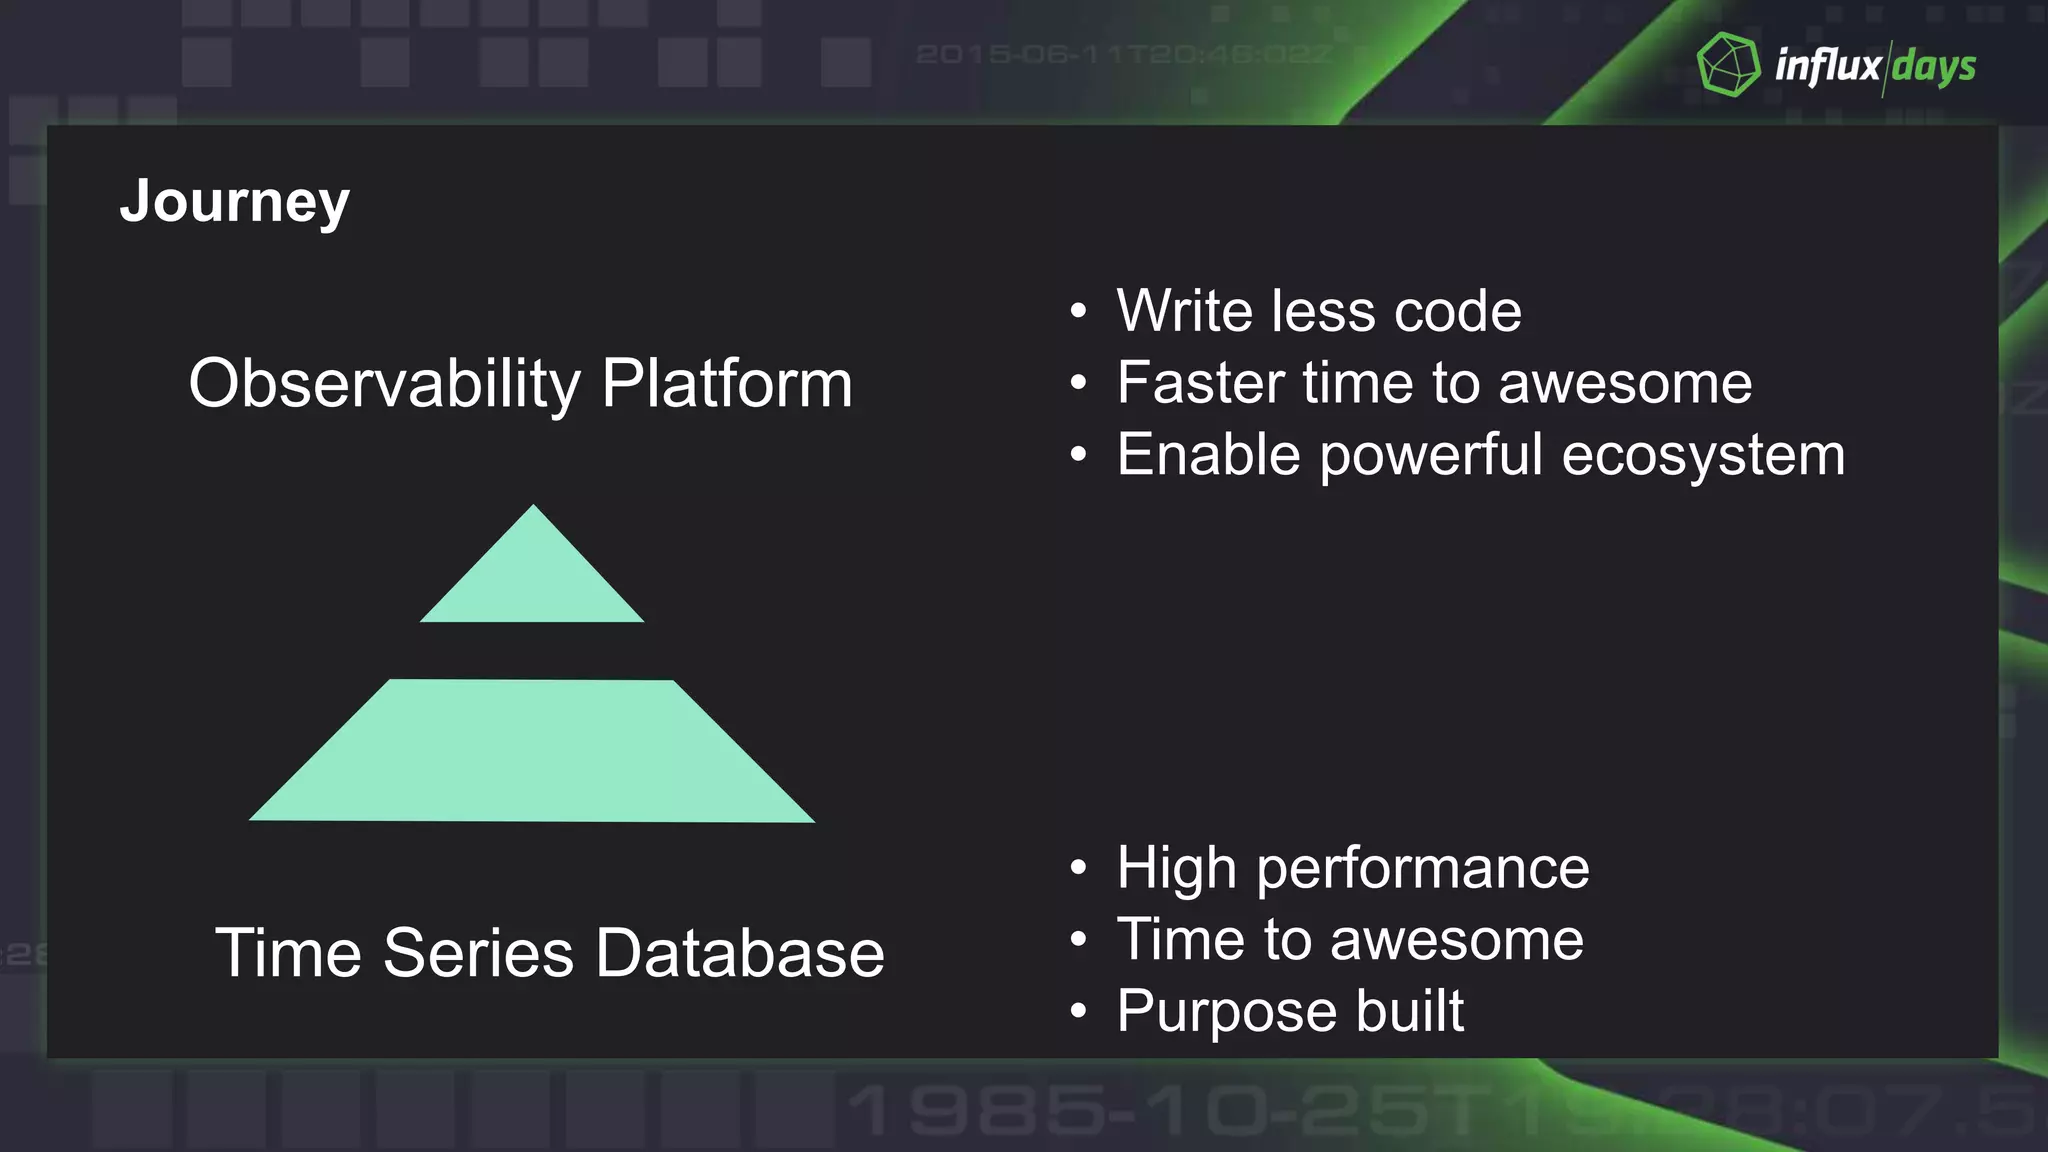
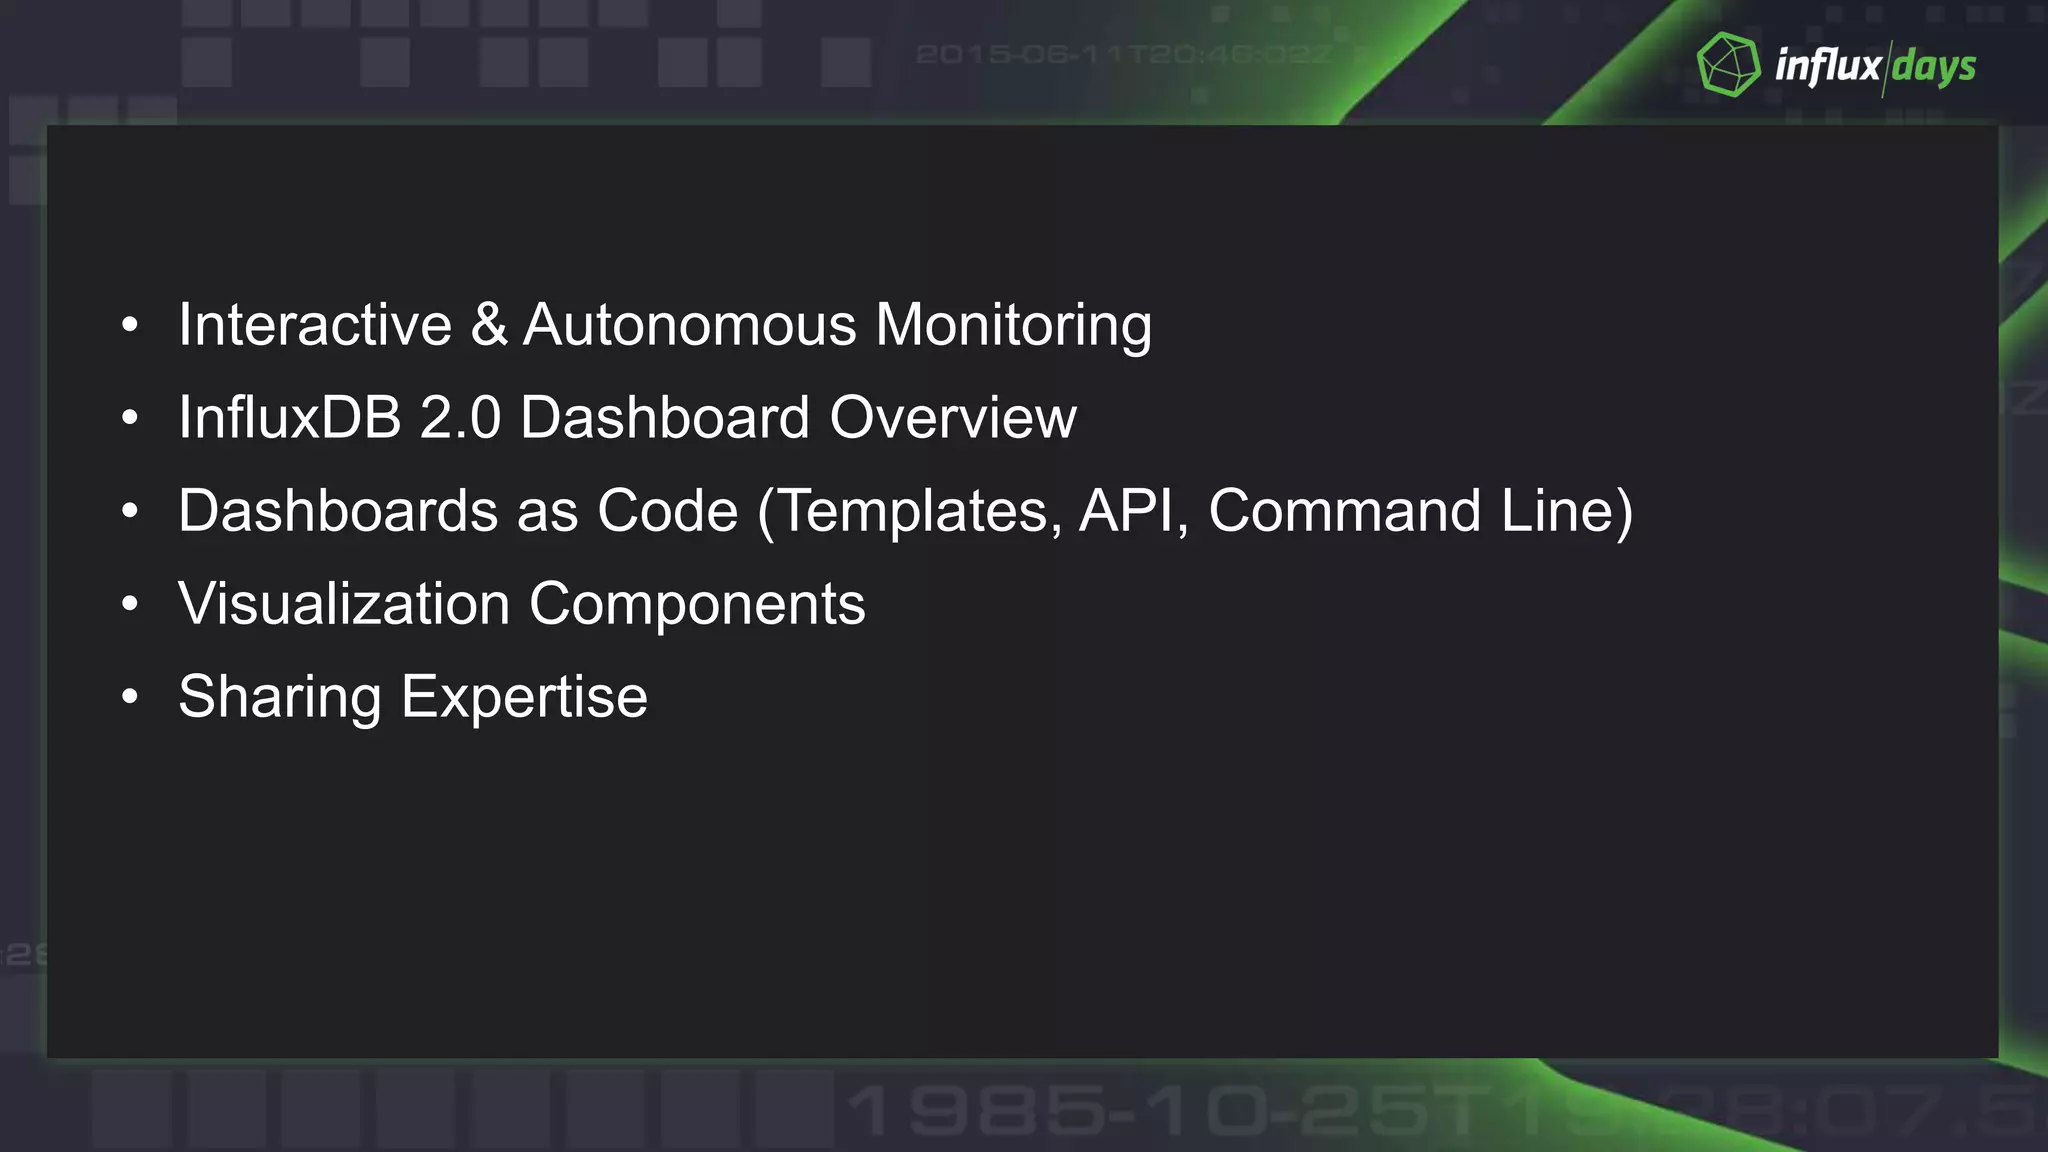
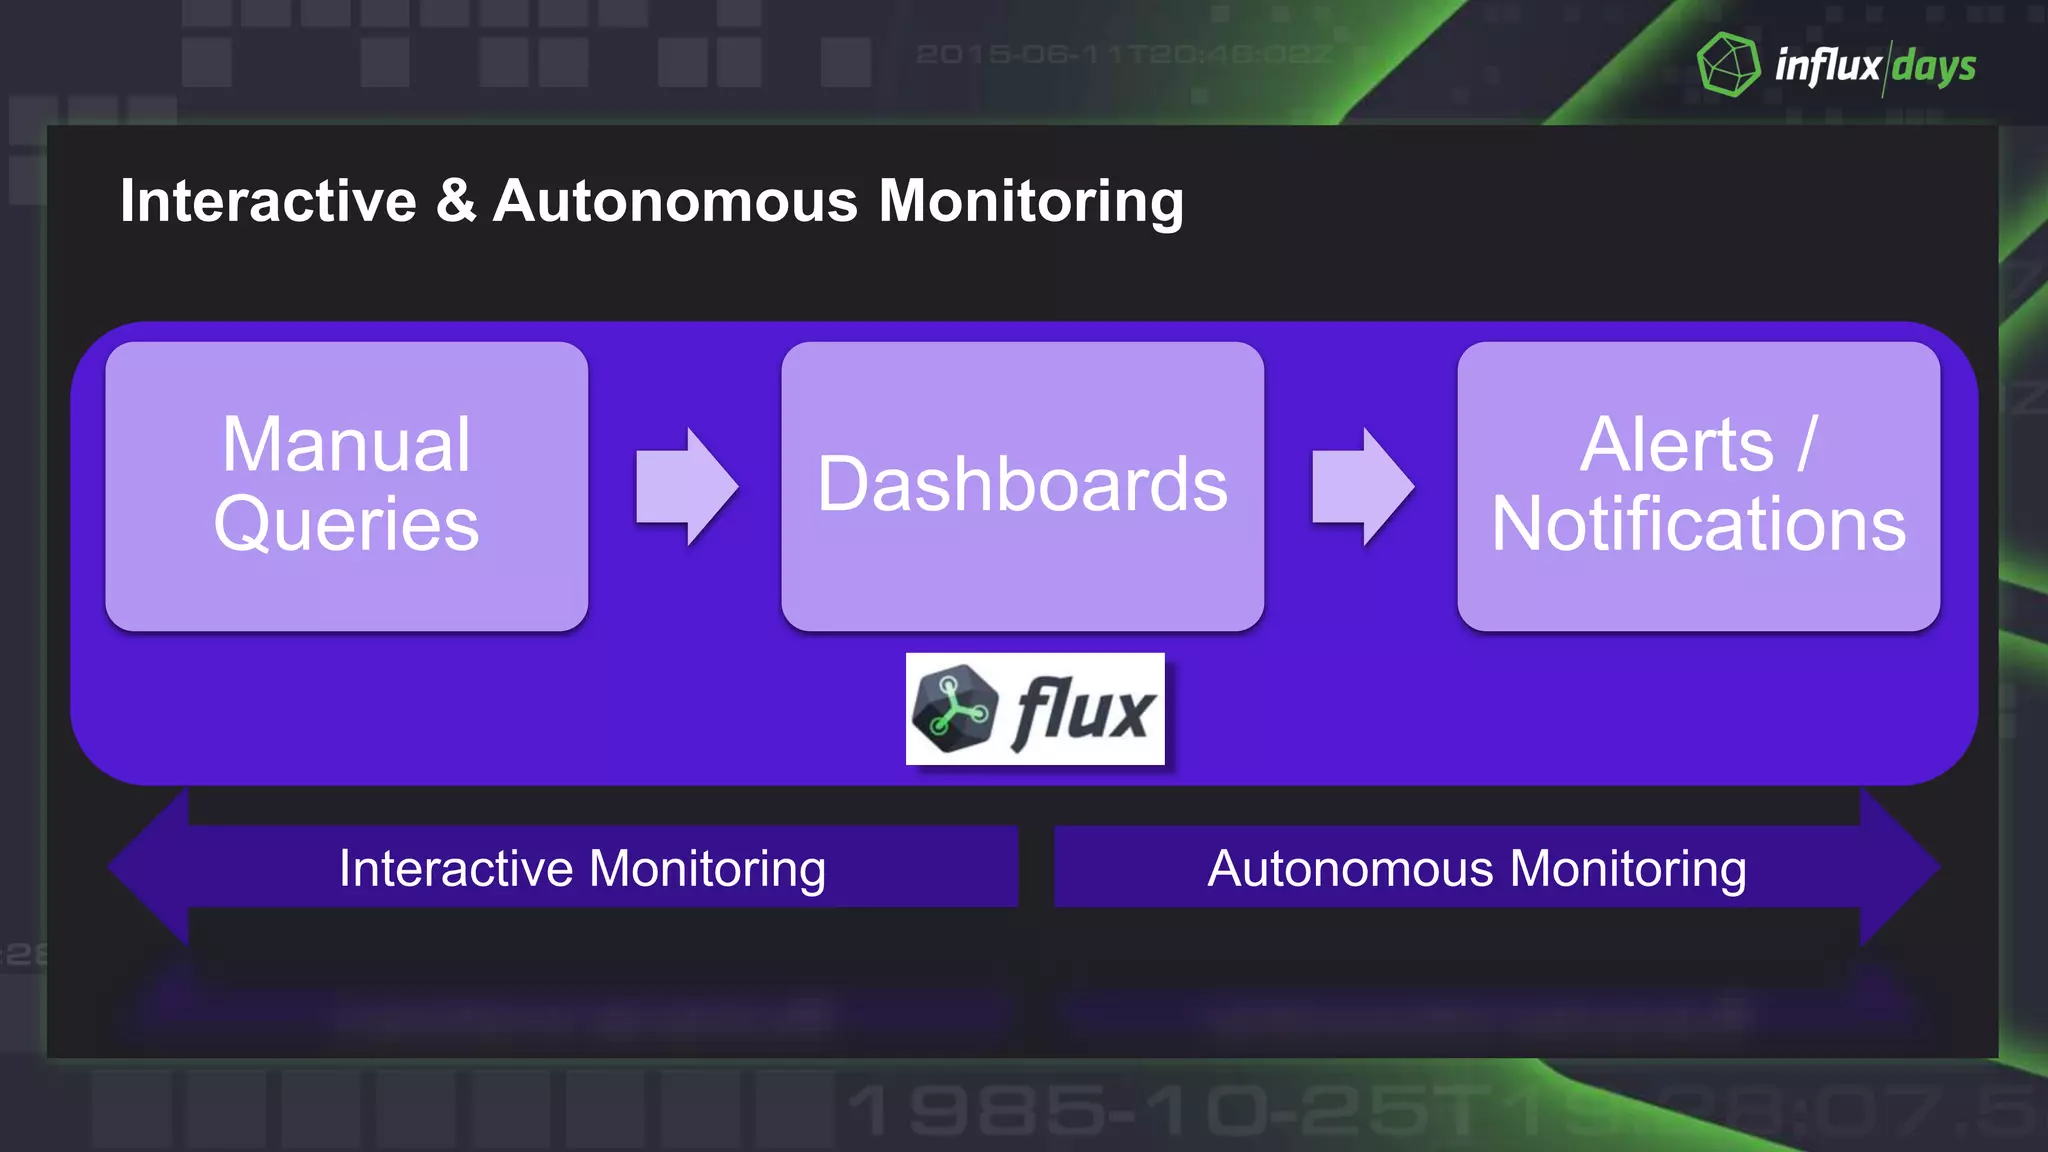
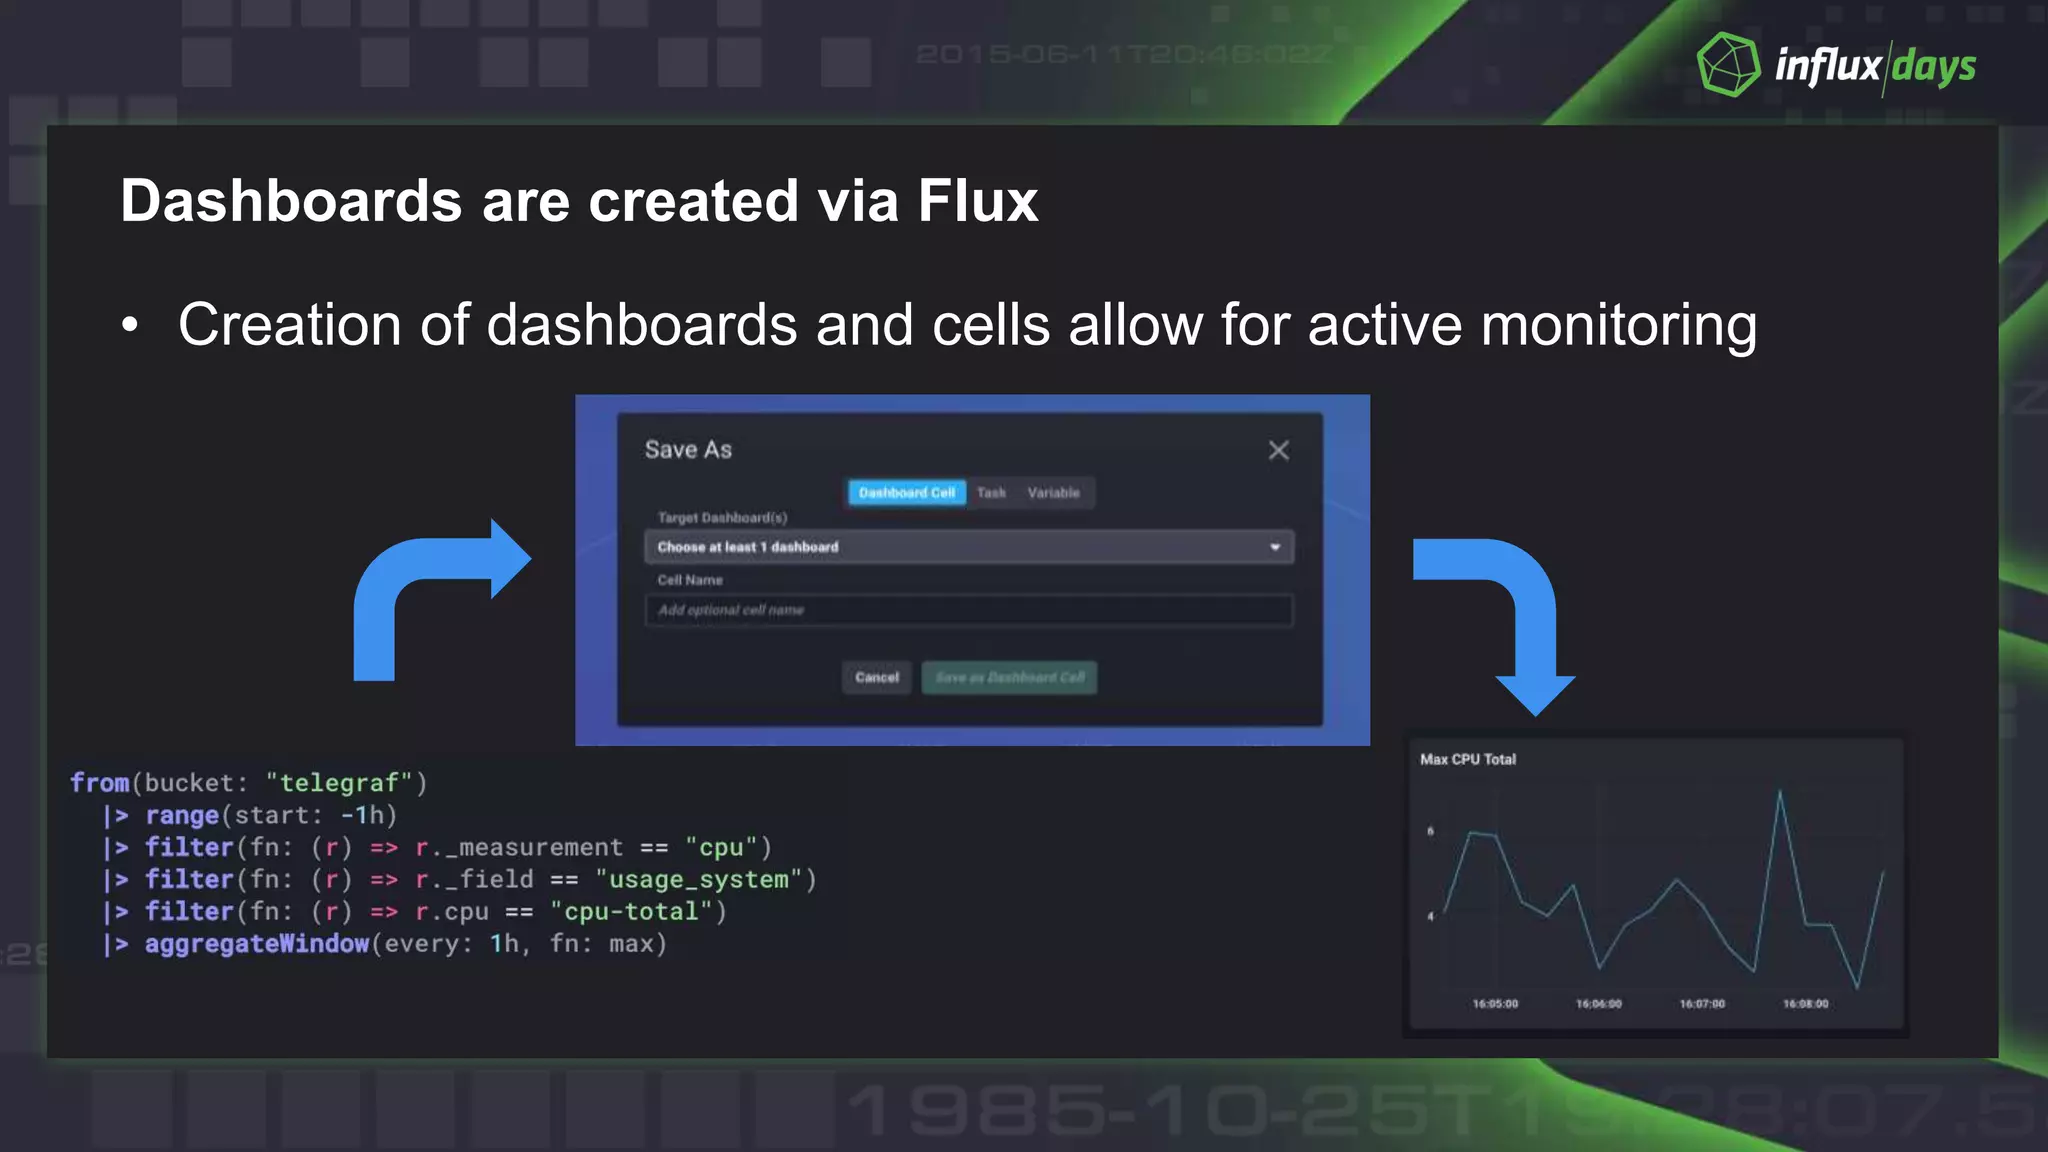

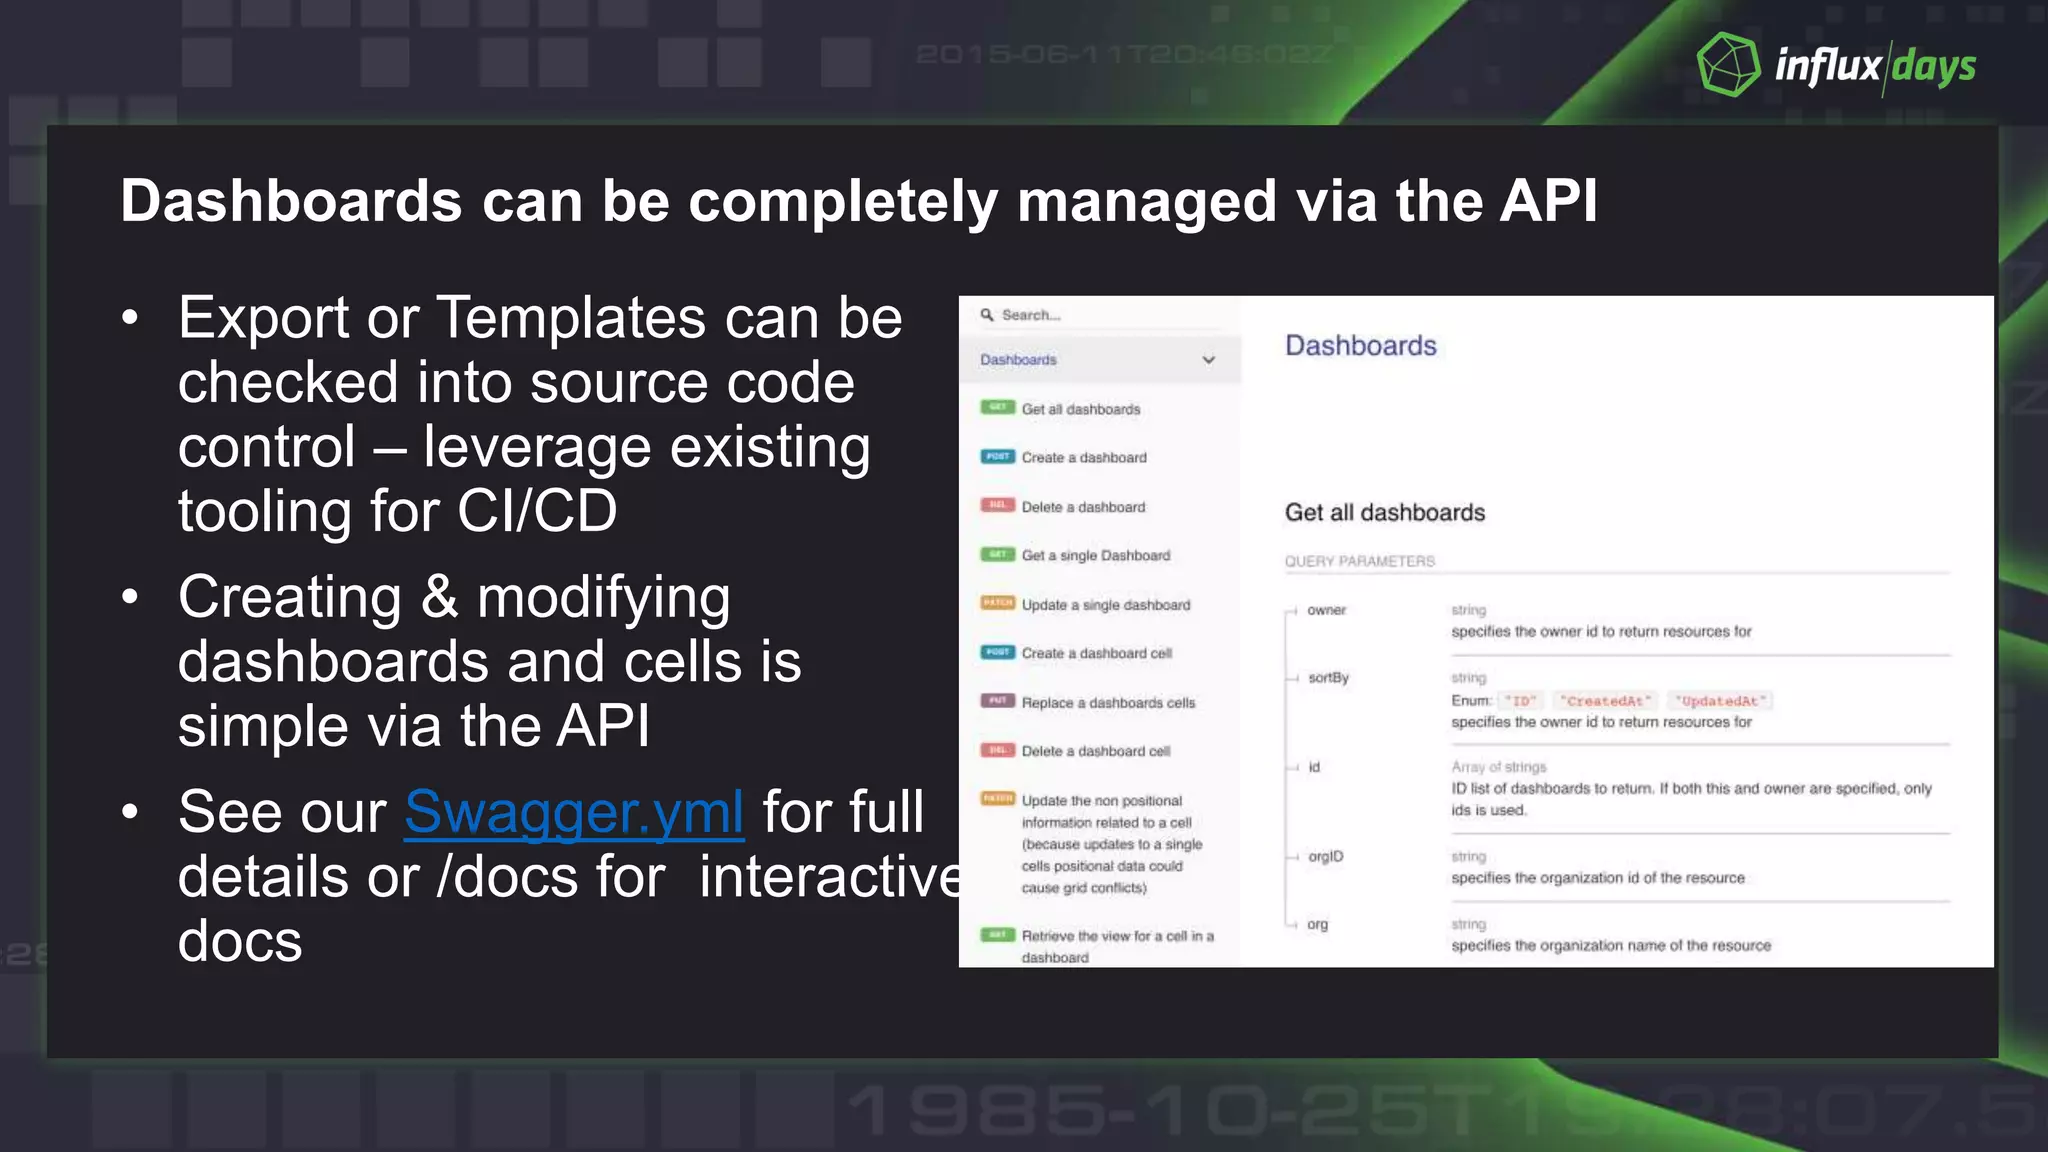
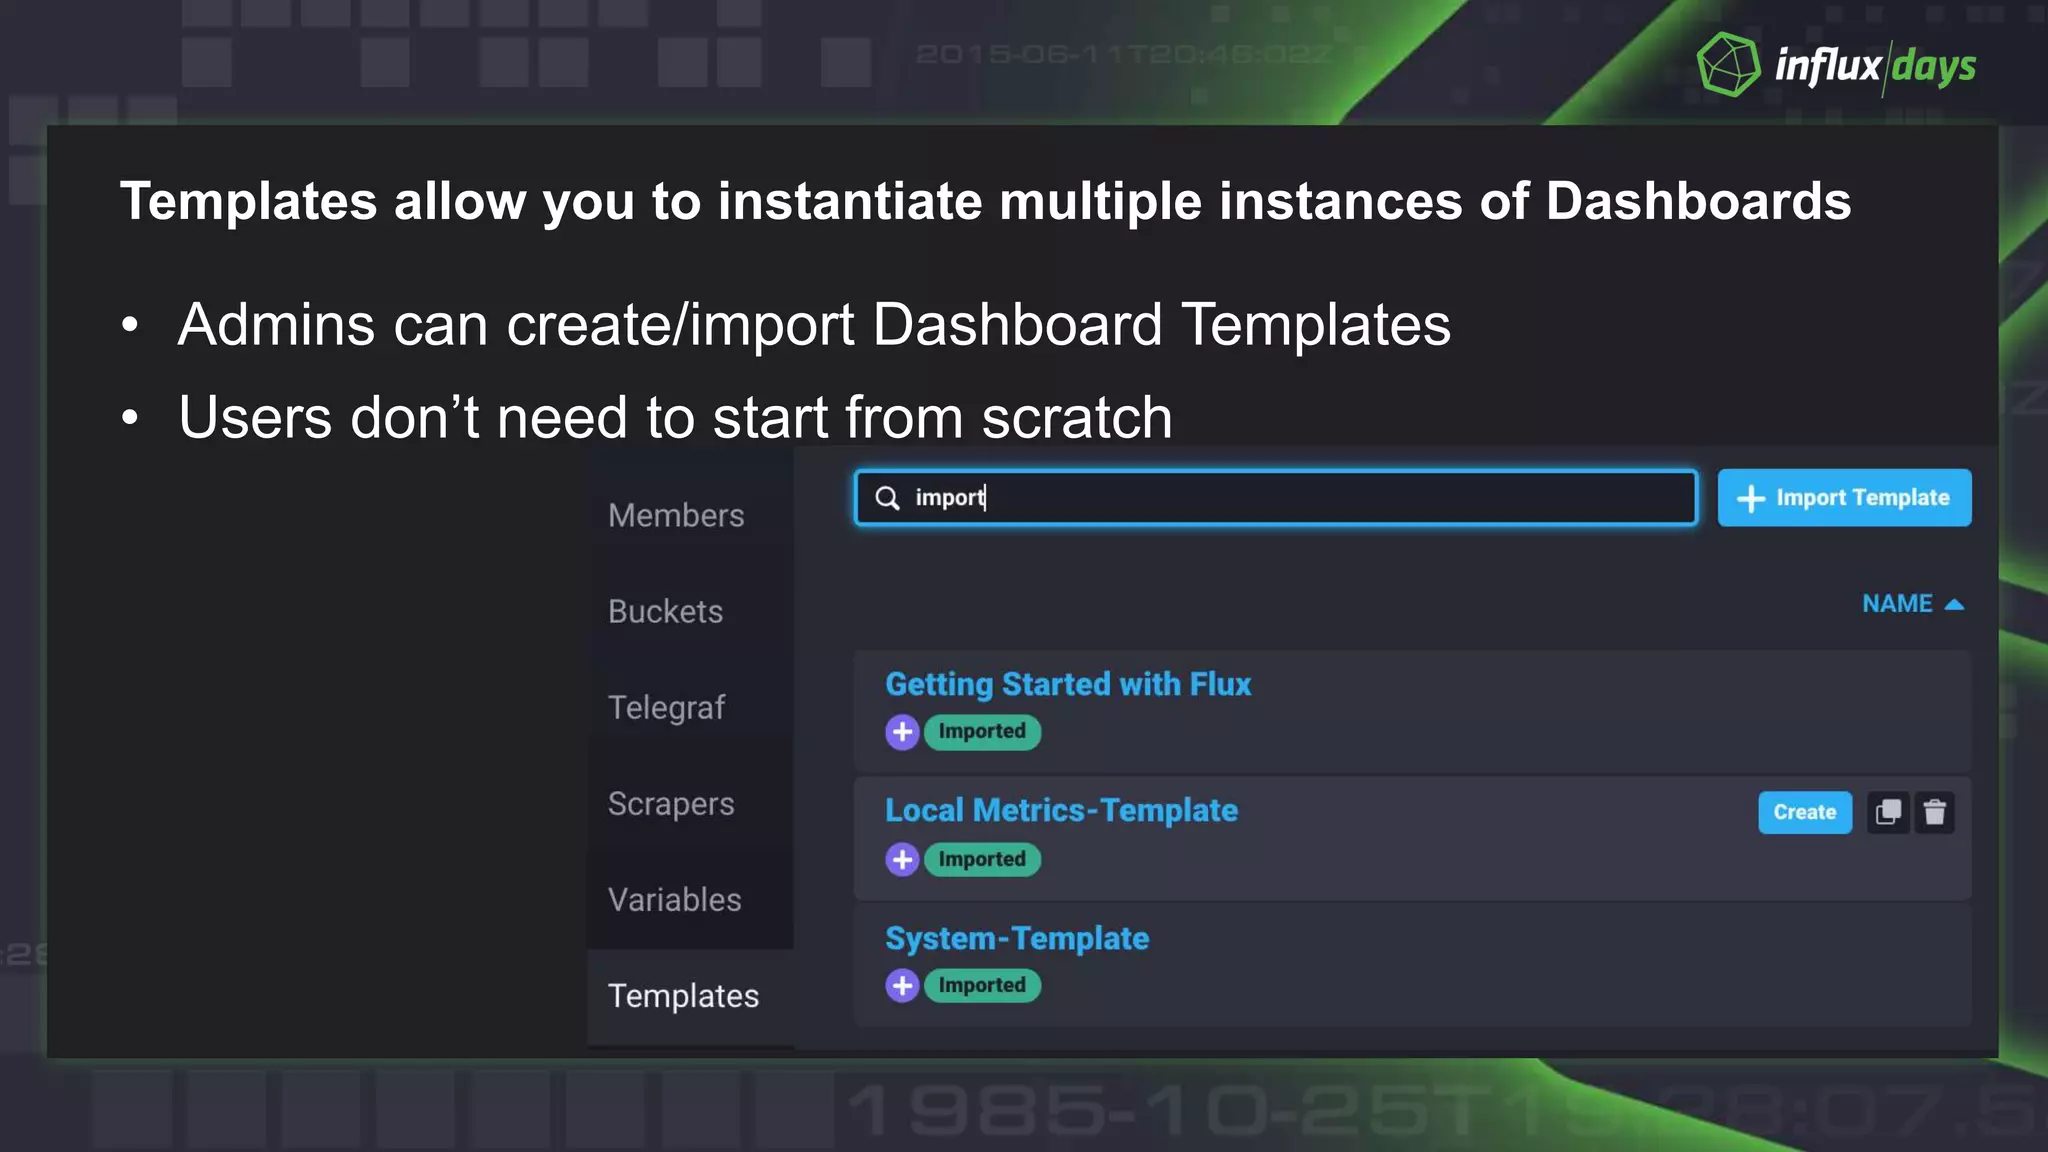
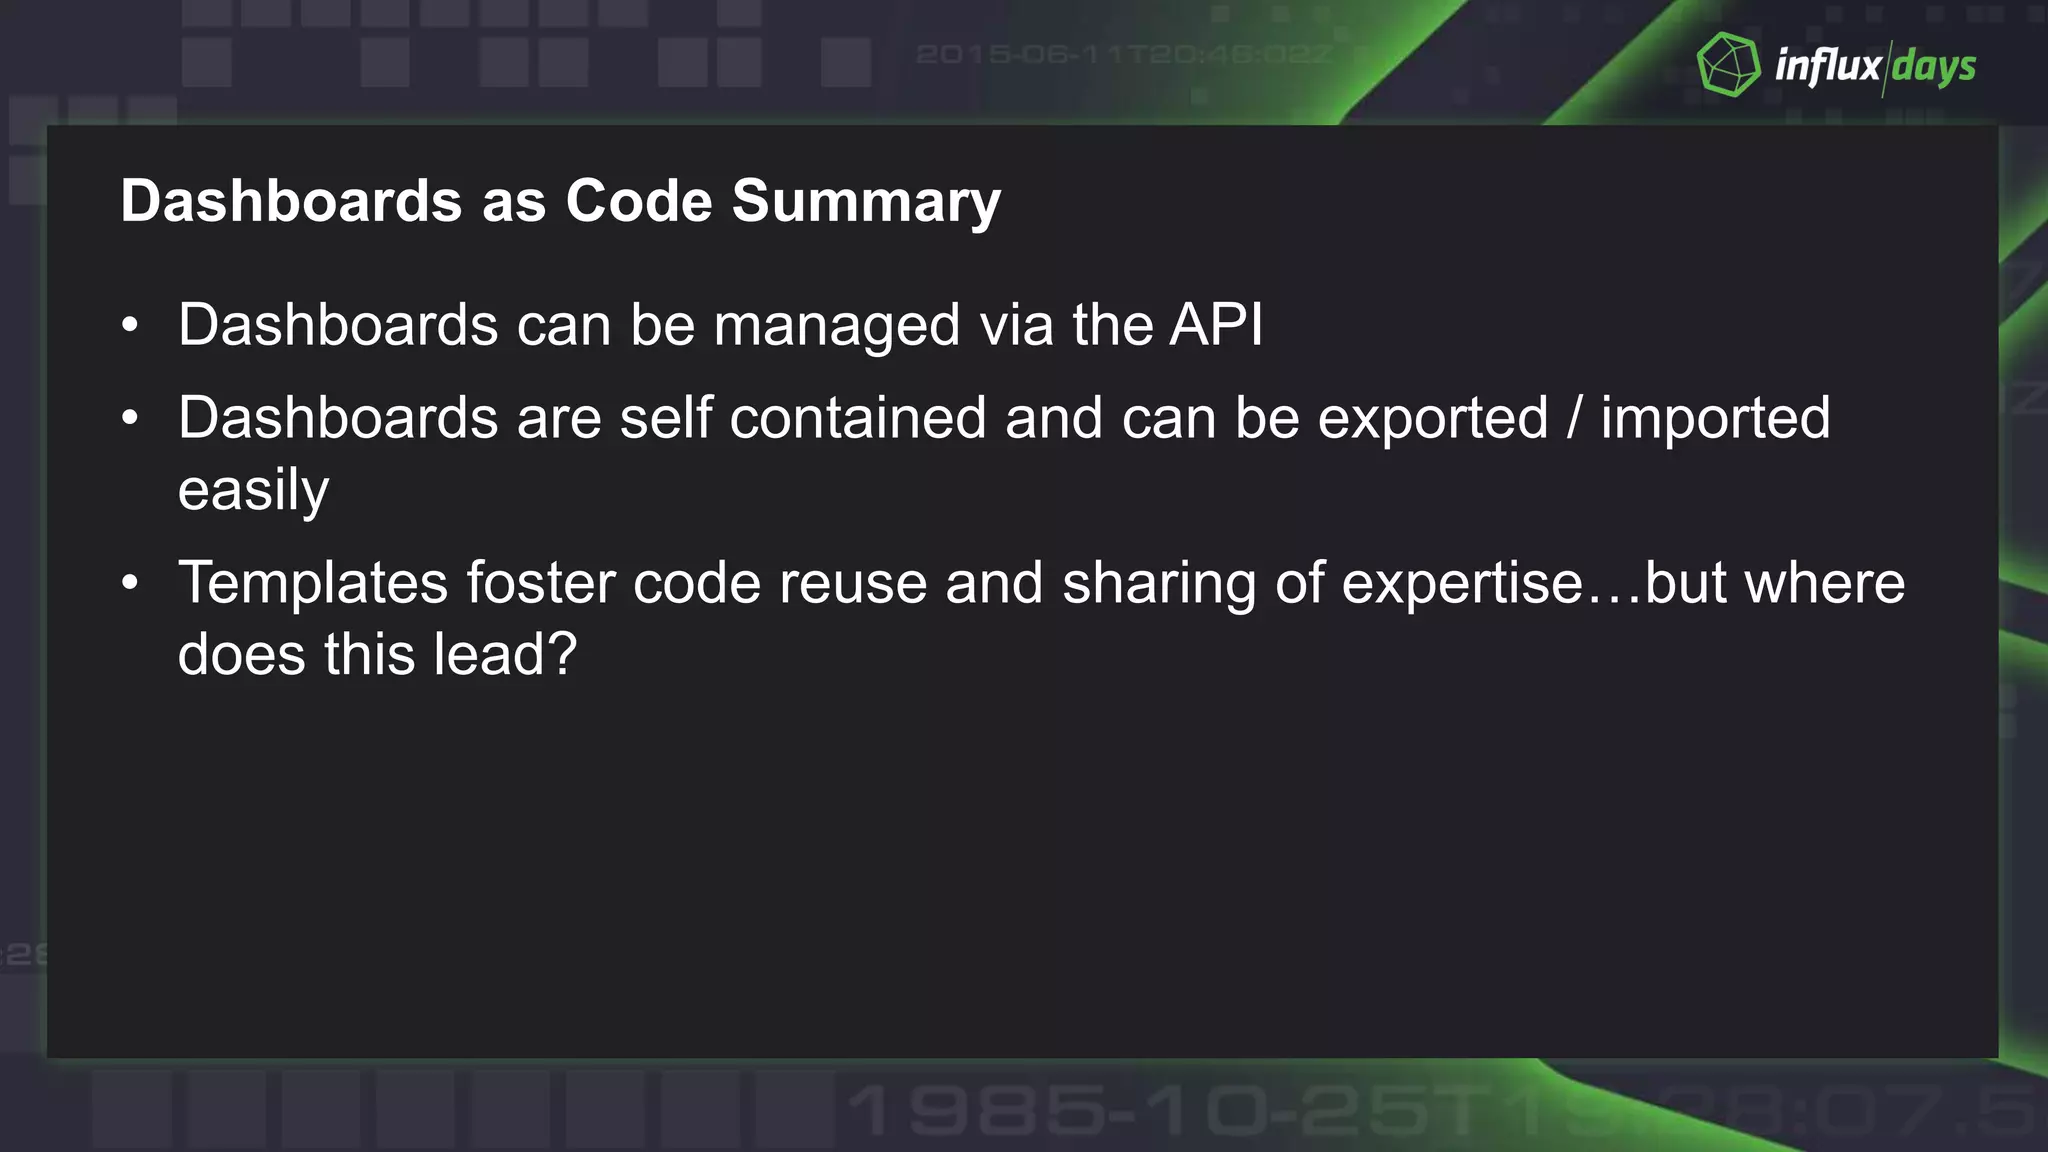
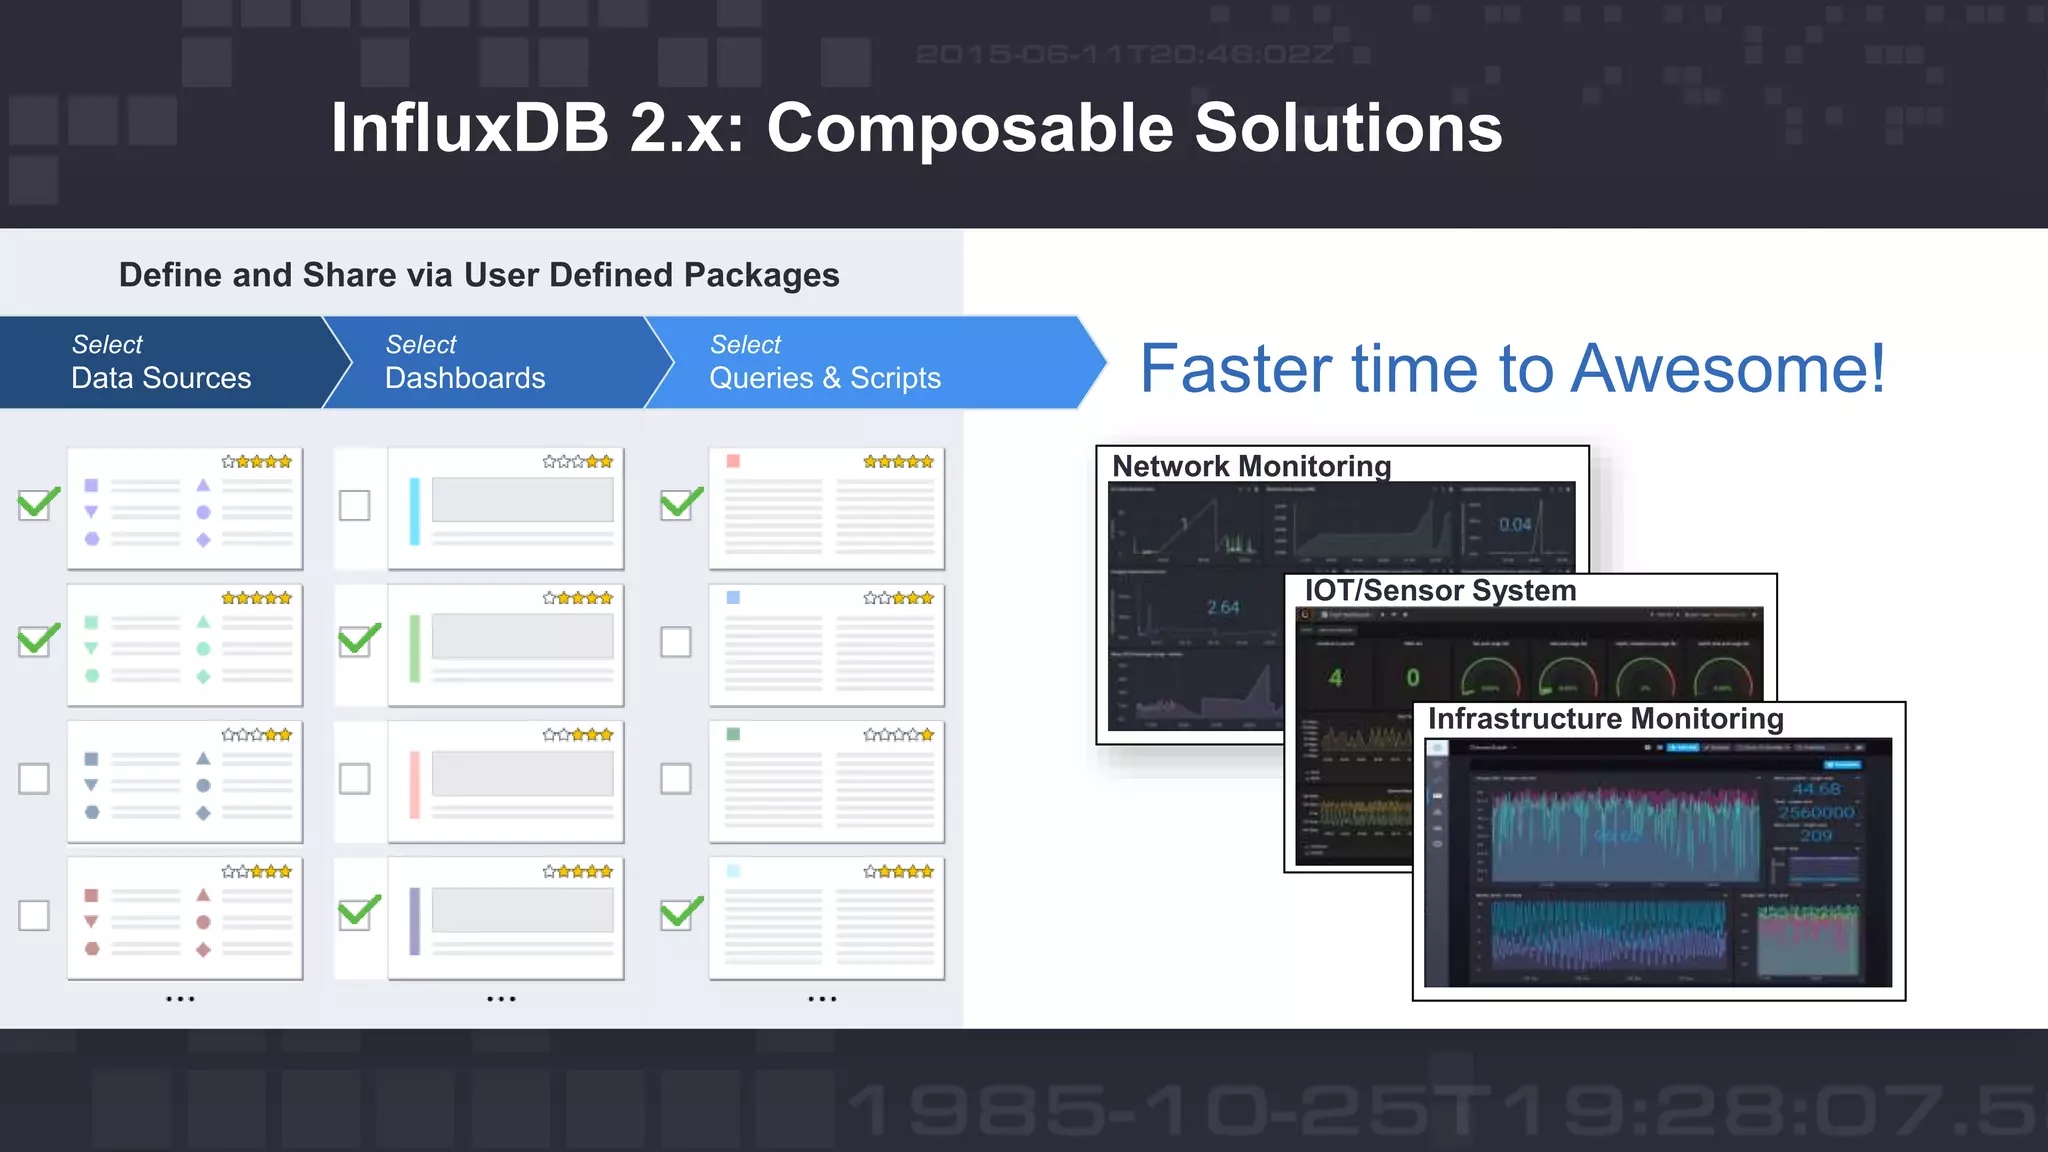


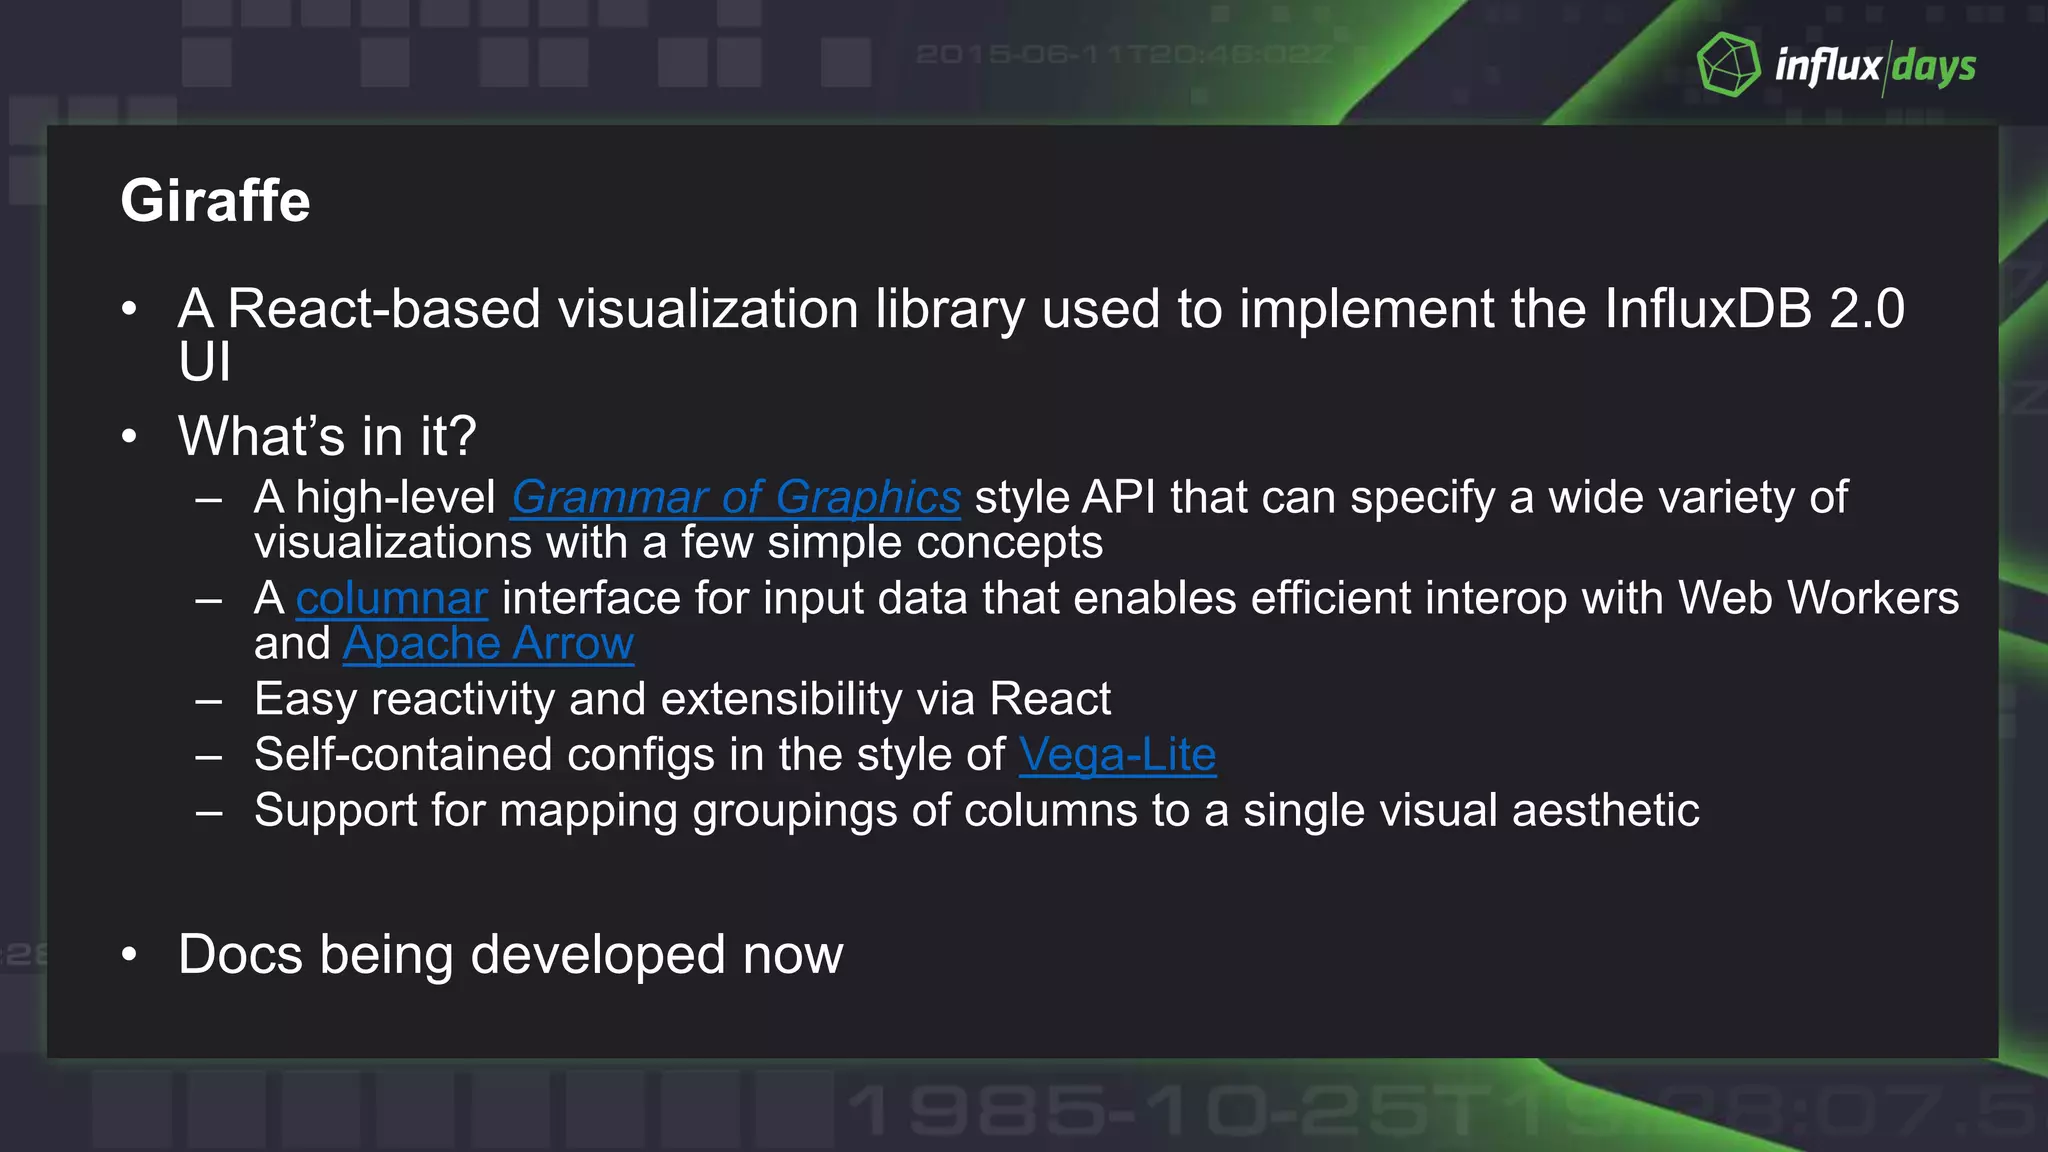
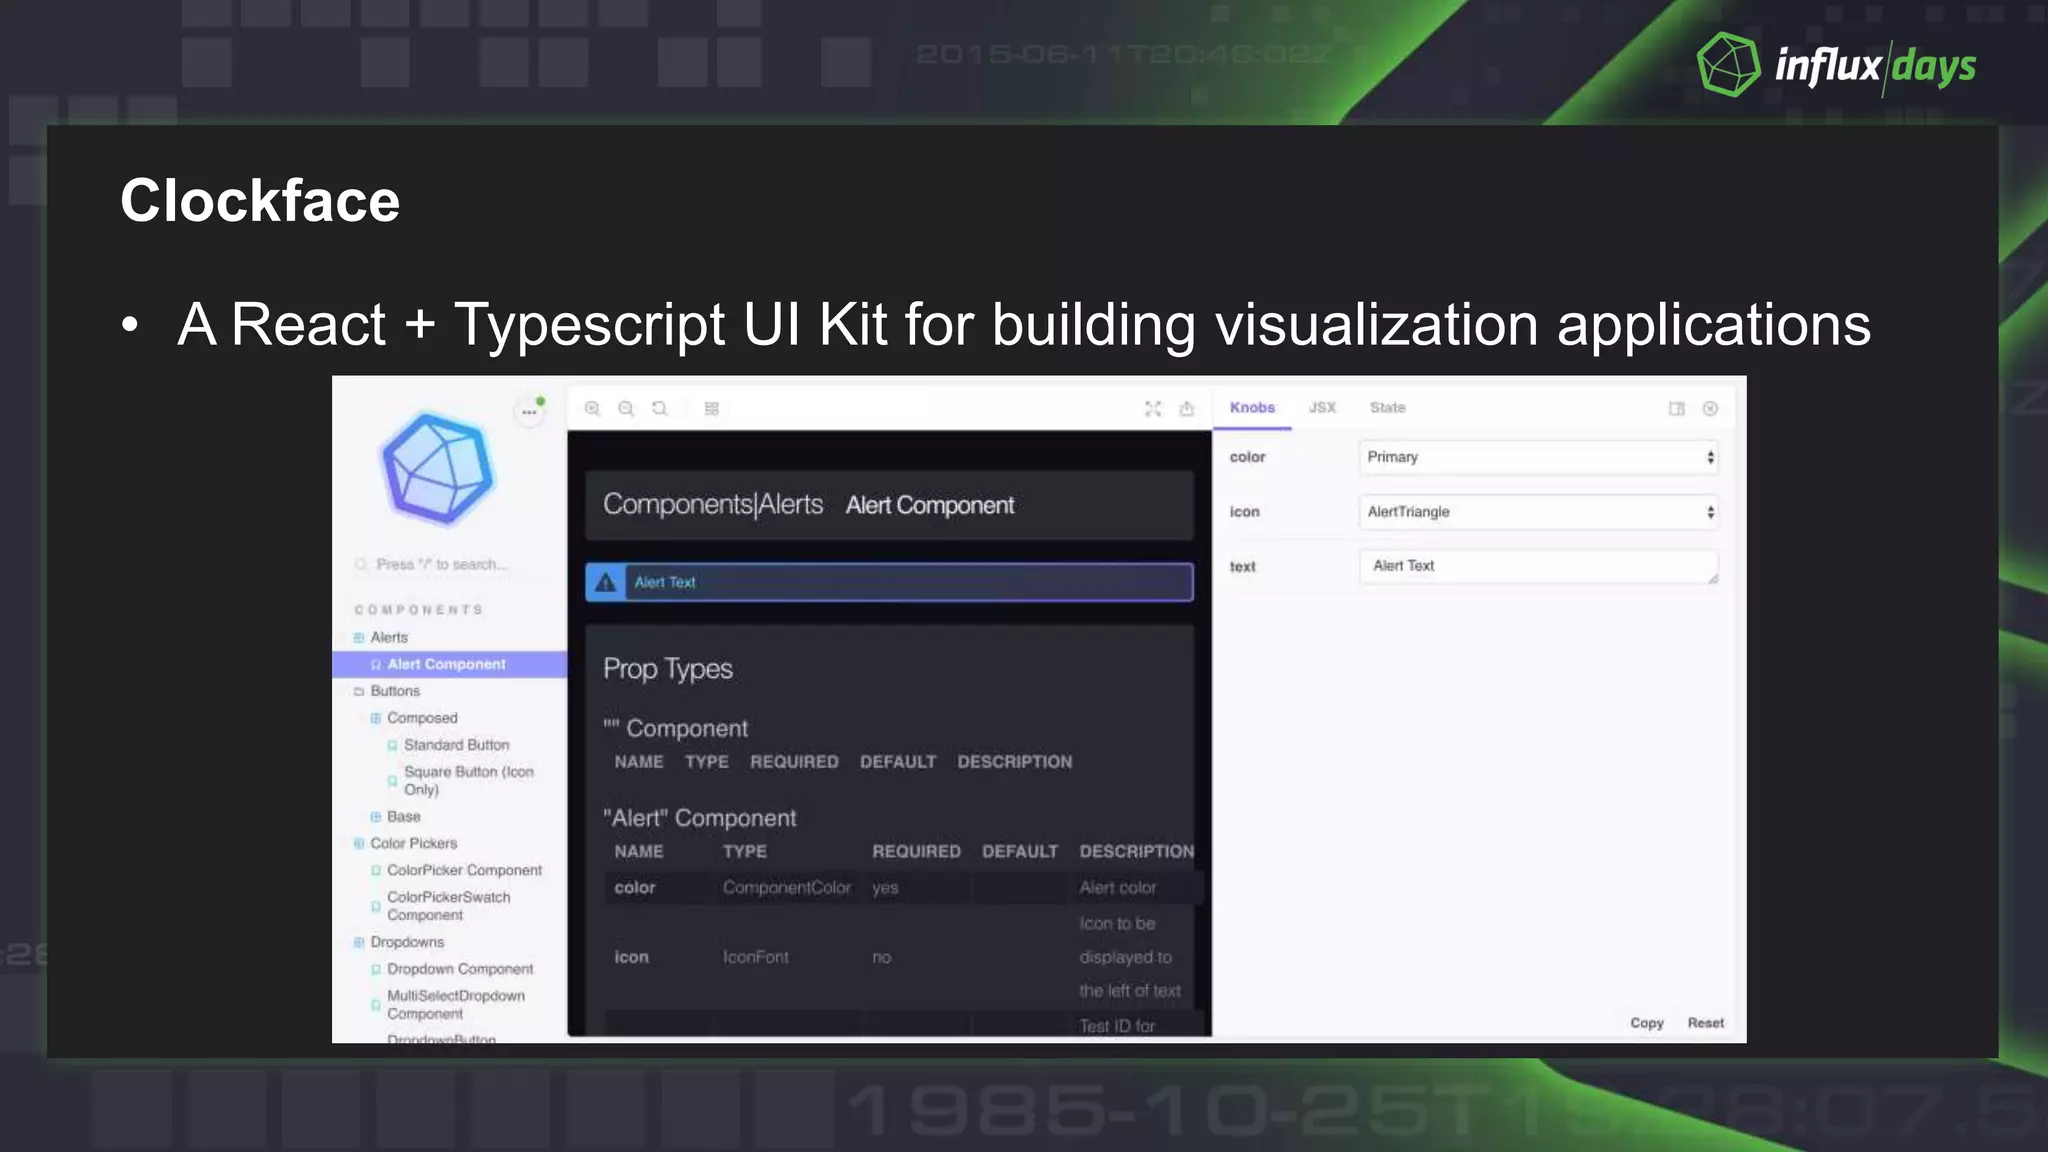


InfluxDB 2.0 introduces a time series database and observability platform that enables quicker development with features like dashboards as code, interactive monitoring, and advanced data visualization. The platform allows for the creation and management of dashboards through an API, facilitating code reuse via templates and fostering collaboration. Key components include the Giraffe and Clockface libraries for visualization, and a call to action invites users to explore the platform's capabilities.


![Rick Spencer & Wojciech Kocjan [InfluxData] | Visualizing InfluxDB 2.0 Dashbo...](https://cdn.slidesharecdn.com/ss_thumbnails/visualizinginfluxdb2-201007154355-thumbnail.jpg?width=640&height=640&fit=bounds)
![Evan Kaplan [InfluxData] | InfluxDays Opening Remarks | InfluxDays NA 2021](https://cdn.slidesharecdn.com/ss_thumbnails/influxdaysevan-211026235203-thumbnail.jpg?width=640&height=640&fit=bounds)

![Tim Hall [InfluxData] | InfluxDB Roadmap | InfluxDays Virtual Experience NA 2020](https://cdn.slidesharecdn.com/ss_thumbnails/influxdaysna2020-influxdbroadmap1-201111180905-thumbnail.jpg?width=640&height=640&fit=bounds)


![Tim Hall [InfluxData] | InfluxDays Keynote: InfluxDB Roadmap | InfluxDays NA ...](https://cdn.slidesharecdn.com/ss_thumbnails/influxdaysna2021-roadmap-211026005403-thumbnail.jpg?width=640&height=640&fit=bounds)
![Paul Dix [InfluxData] | InfluxDays Opening Keynote | InfluxDays Virtual Exper...](https://cdn.slidesharecdn.com/ss_thumbnails/influxdays-opening-keynote-paul-dix-200623175743-thumbnail.jpg?width=640&height=640&fit=bounds)

![Paul Dix [InfluxData] | InfluxDays Keynote: Future of InfluxDB | InfluxDays N...](https://cdn.slidesharecdn.com/ss_thumbnails/2021-10-26whytimeseries-influxdaysna-211026005527-thumbnail.jpg?width=640&height=640&fit=bounds)
![Tim Hall [InfluxData] | InfluxDB Roadmap | InfluxDays Virtual Experience Lond...](https://cdn.slidesharecdn.com/ss_thumbnails/influxdb-roadmap-tim-hall-200623173849-thumbnail.jpg?width=640&height=640&fit=bounds)
![Ryan Betts [InfluxData] | InfluxDB Platform Performance | InfluxDays Virtual ...](https://cdn.slidesharecdn.com/ss_thumbnails/influxdaysna-ryan-201110022532-thumbnail.jpg?width=640&height=640&fit=bounds)


![Ward Bowman [PTC] | ThingWorx Long-Term Data Storage with InfluxDB | InfluxDa...](https://cdn.slidesharecdn.com/ss_thumbnails/influxdays-221027185325-5d2f430b-thumbnail.jpg?width=640&height=640&fit=bounds)


![Steinkamp, Clifford [InfluxData] | Welcome to InfluxDays 2022 - Day 2 | Influ...](https://cdn.slidesharecdn.com/ss_thumbnails/influxdays2022welcometoday2-221020215815-c8463942-thumbnail.jpg?width=640&height=640&fit=bounds)
![Steinkamp, Clifford [InfluxData] | Closing Thoughts | InfluxDays 2022](https://cdn.slidesharecdn.com/ss_thumbnails/influxdays2022closingthoughtsday2-221020220104-abde55ea-thumbnail.jpg?width=640&height=640&fit=bounds)
![Steinkamp, Clifford [InfluxData] | Closing Thoughts Day 1 | InfluxDays 2022](https://cdn.slidesharecdn.com/ss_thumbnails/influxdays2022closingthoughtsday1-221020215301-f8040e1f-thumbnail.jpg?width=640&height=640&fit=bounds)

![Scott Anderson [InfluxData] | New & Upcoming Flux Features | InfluxDays 2022](https://cdn.slidesharecdn.com/ss_thumbnails/influxdays2022-fluxupdates-scott-221021210238-9d323cba-thumbnail.jpg?width=640&height=640&fit=bounds)


