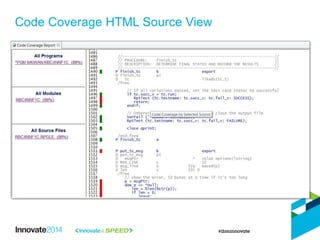
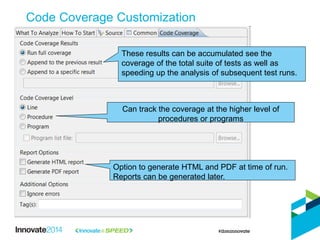
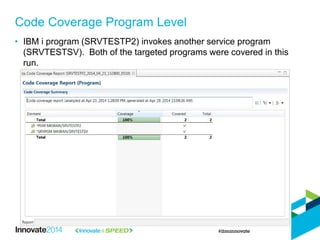
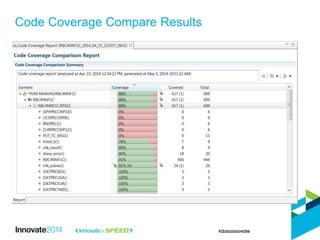
Downloaded 142 times


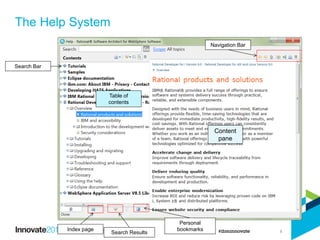
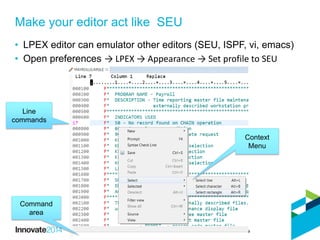

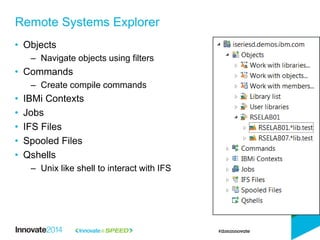
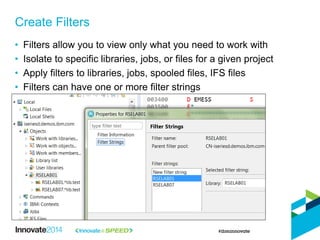


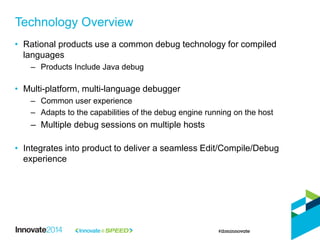


The document outlines a guide for becoming a proficient developer on the IBM i platform using Rational Developer for i, emphasizing the importance of mastering various development tools and techniques in a structured manner. It covers key features such as source code management, debugging practices, and the utilization of various design tools to improve development efficiency. The information provided is intended for developers in finance, insurance, healthcare, manufacturing, and government sectors, underlining an agile methodology towards enterprise modernization.