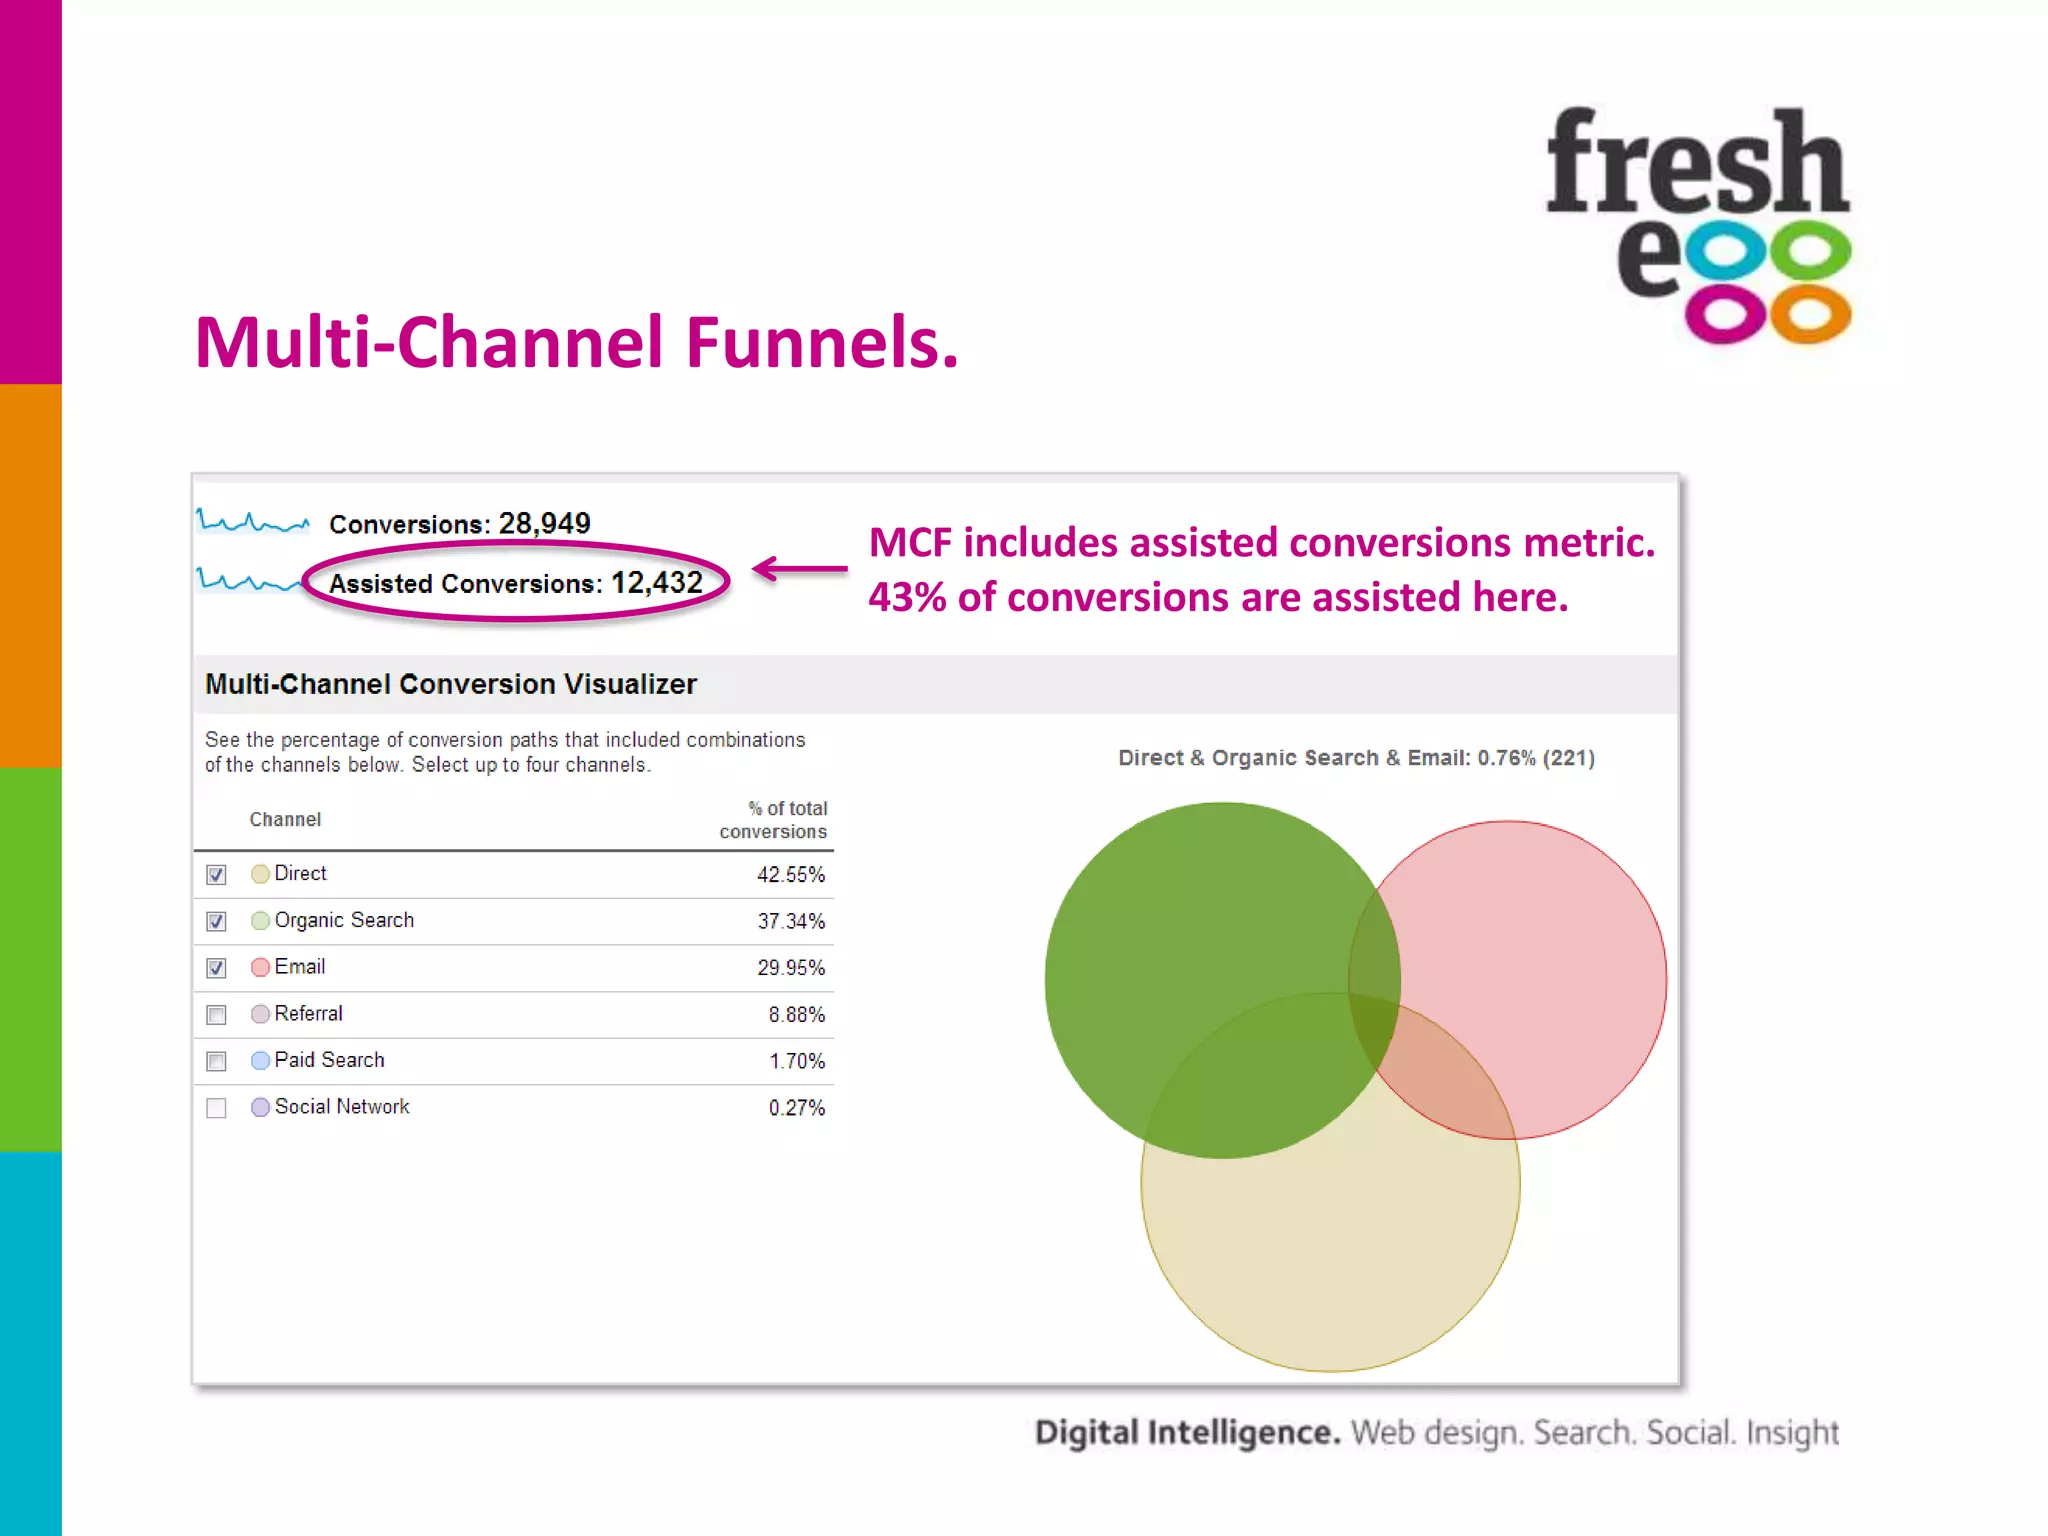
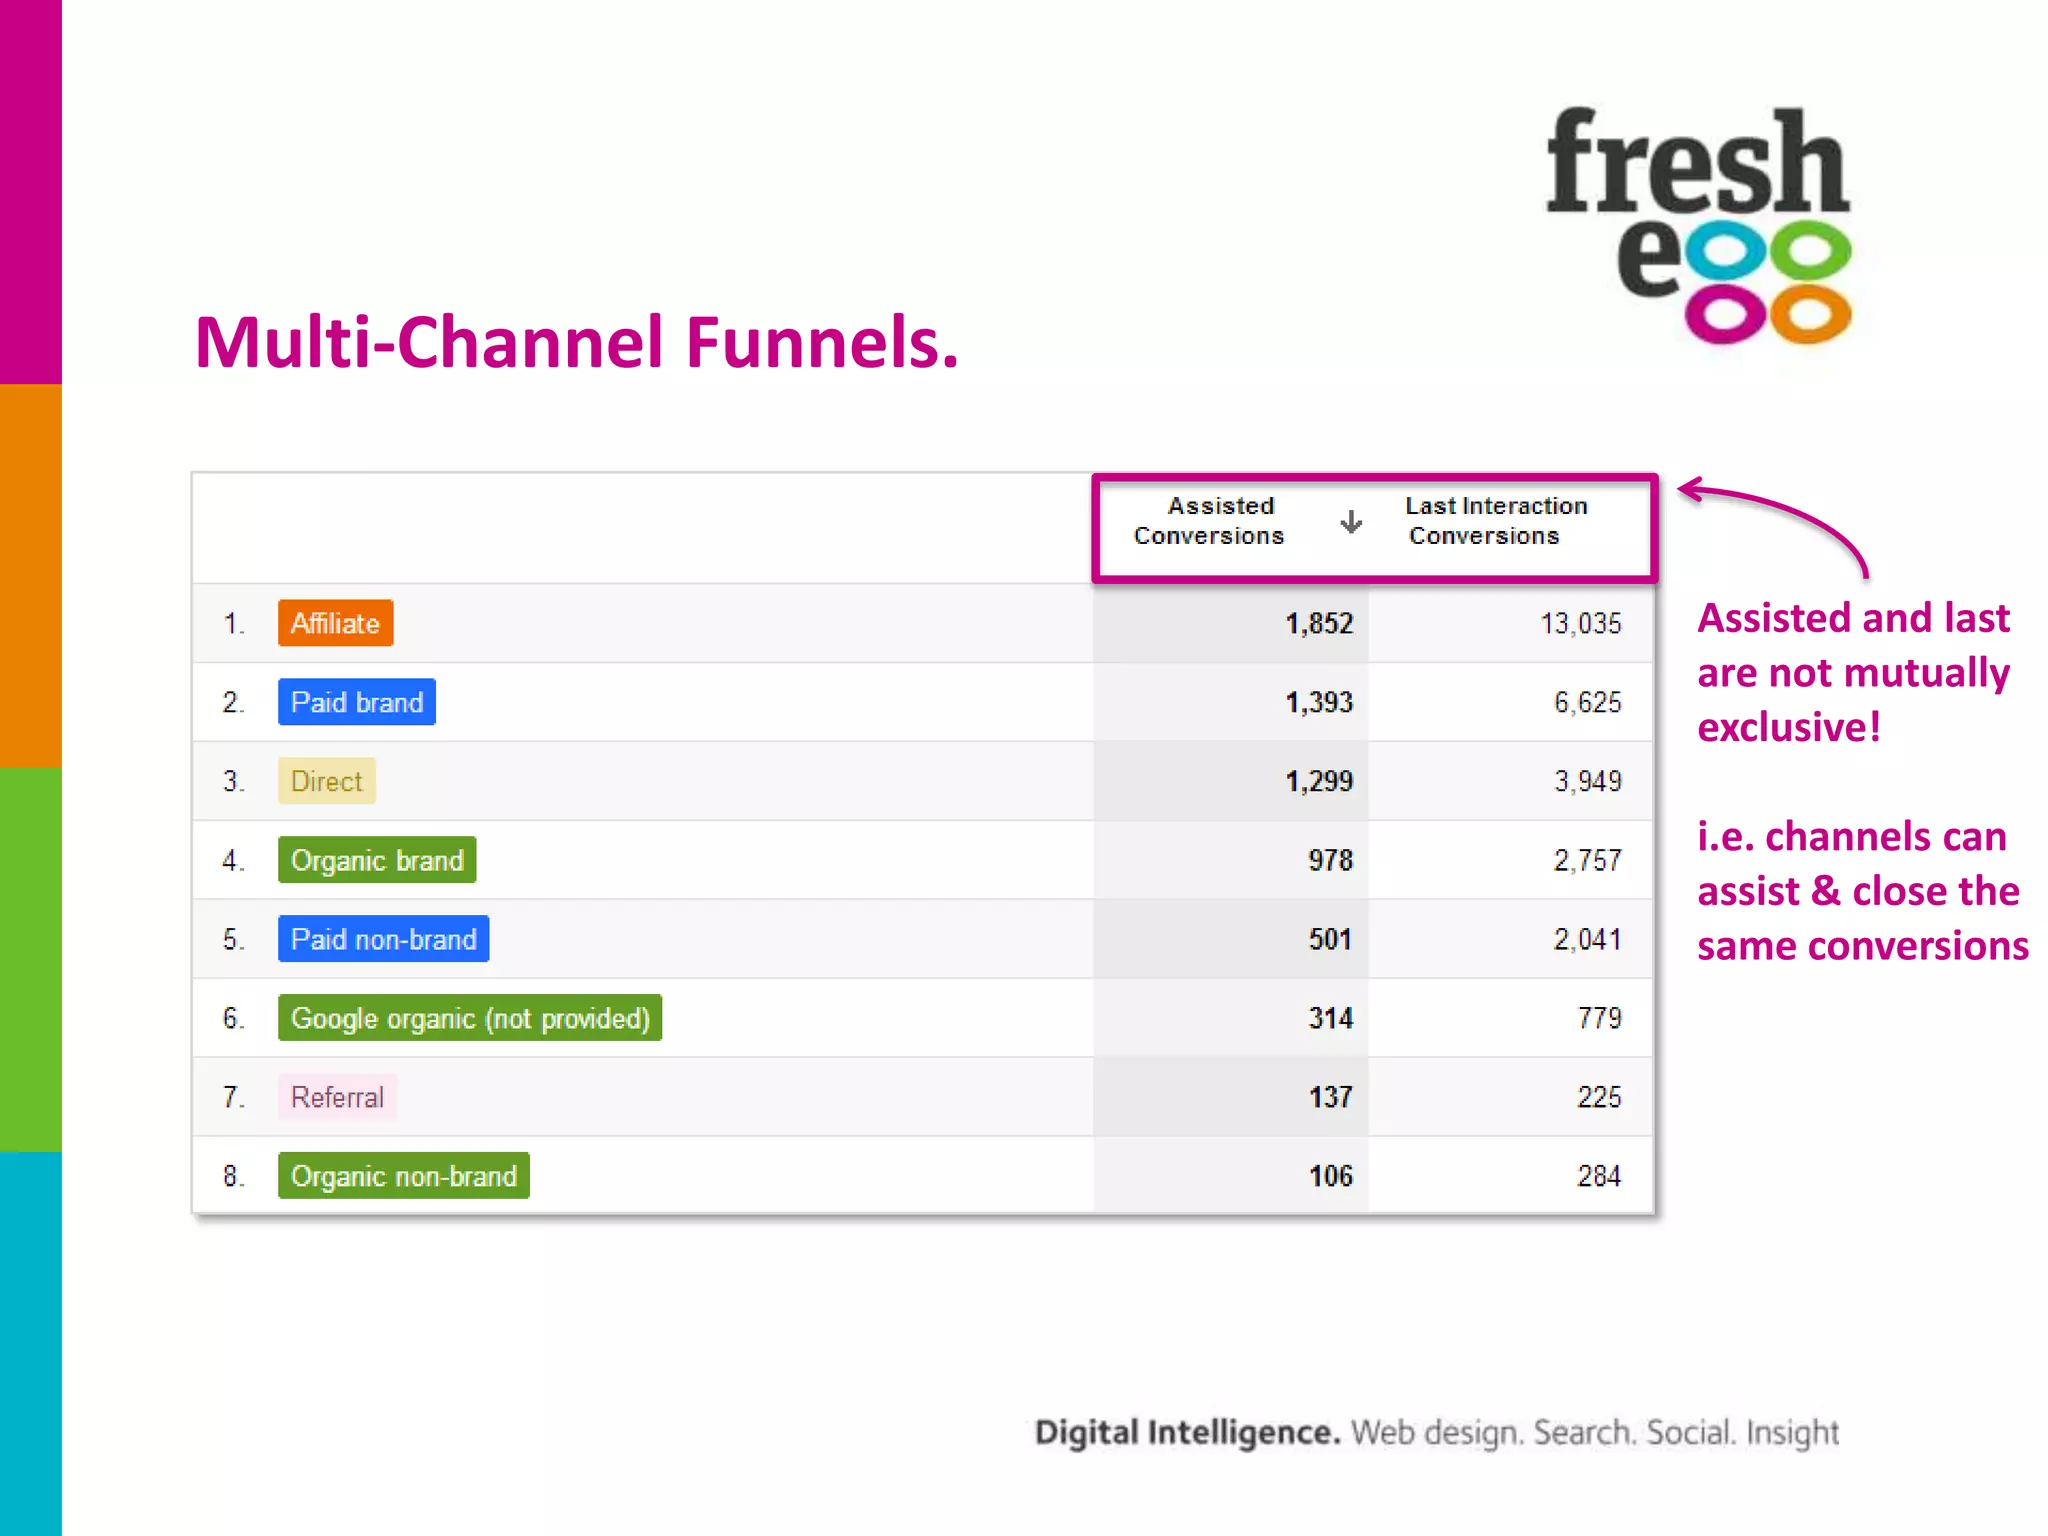
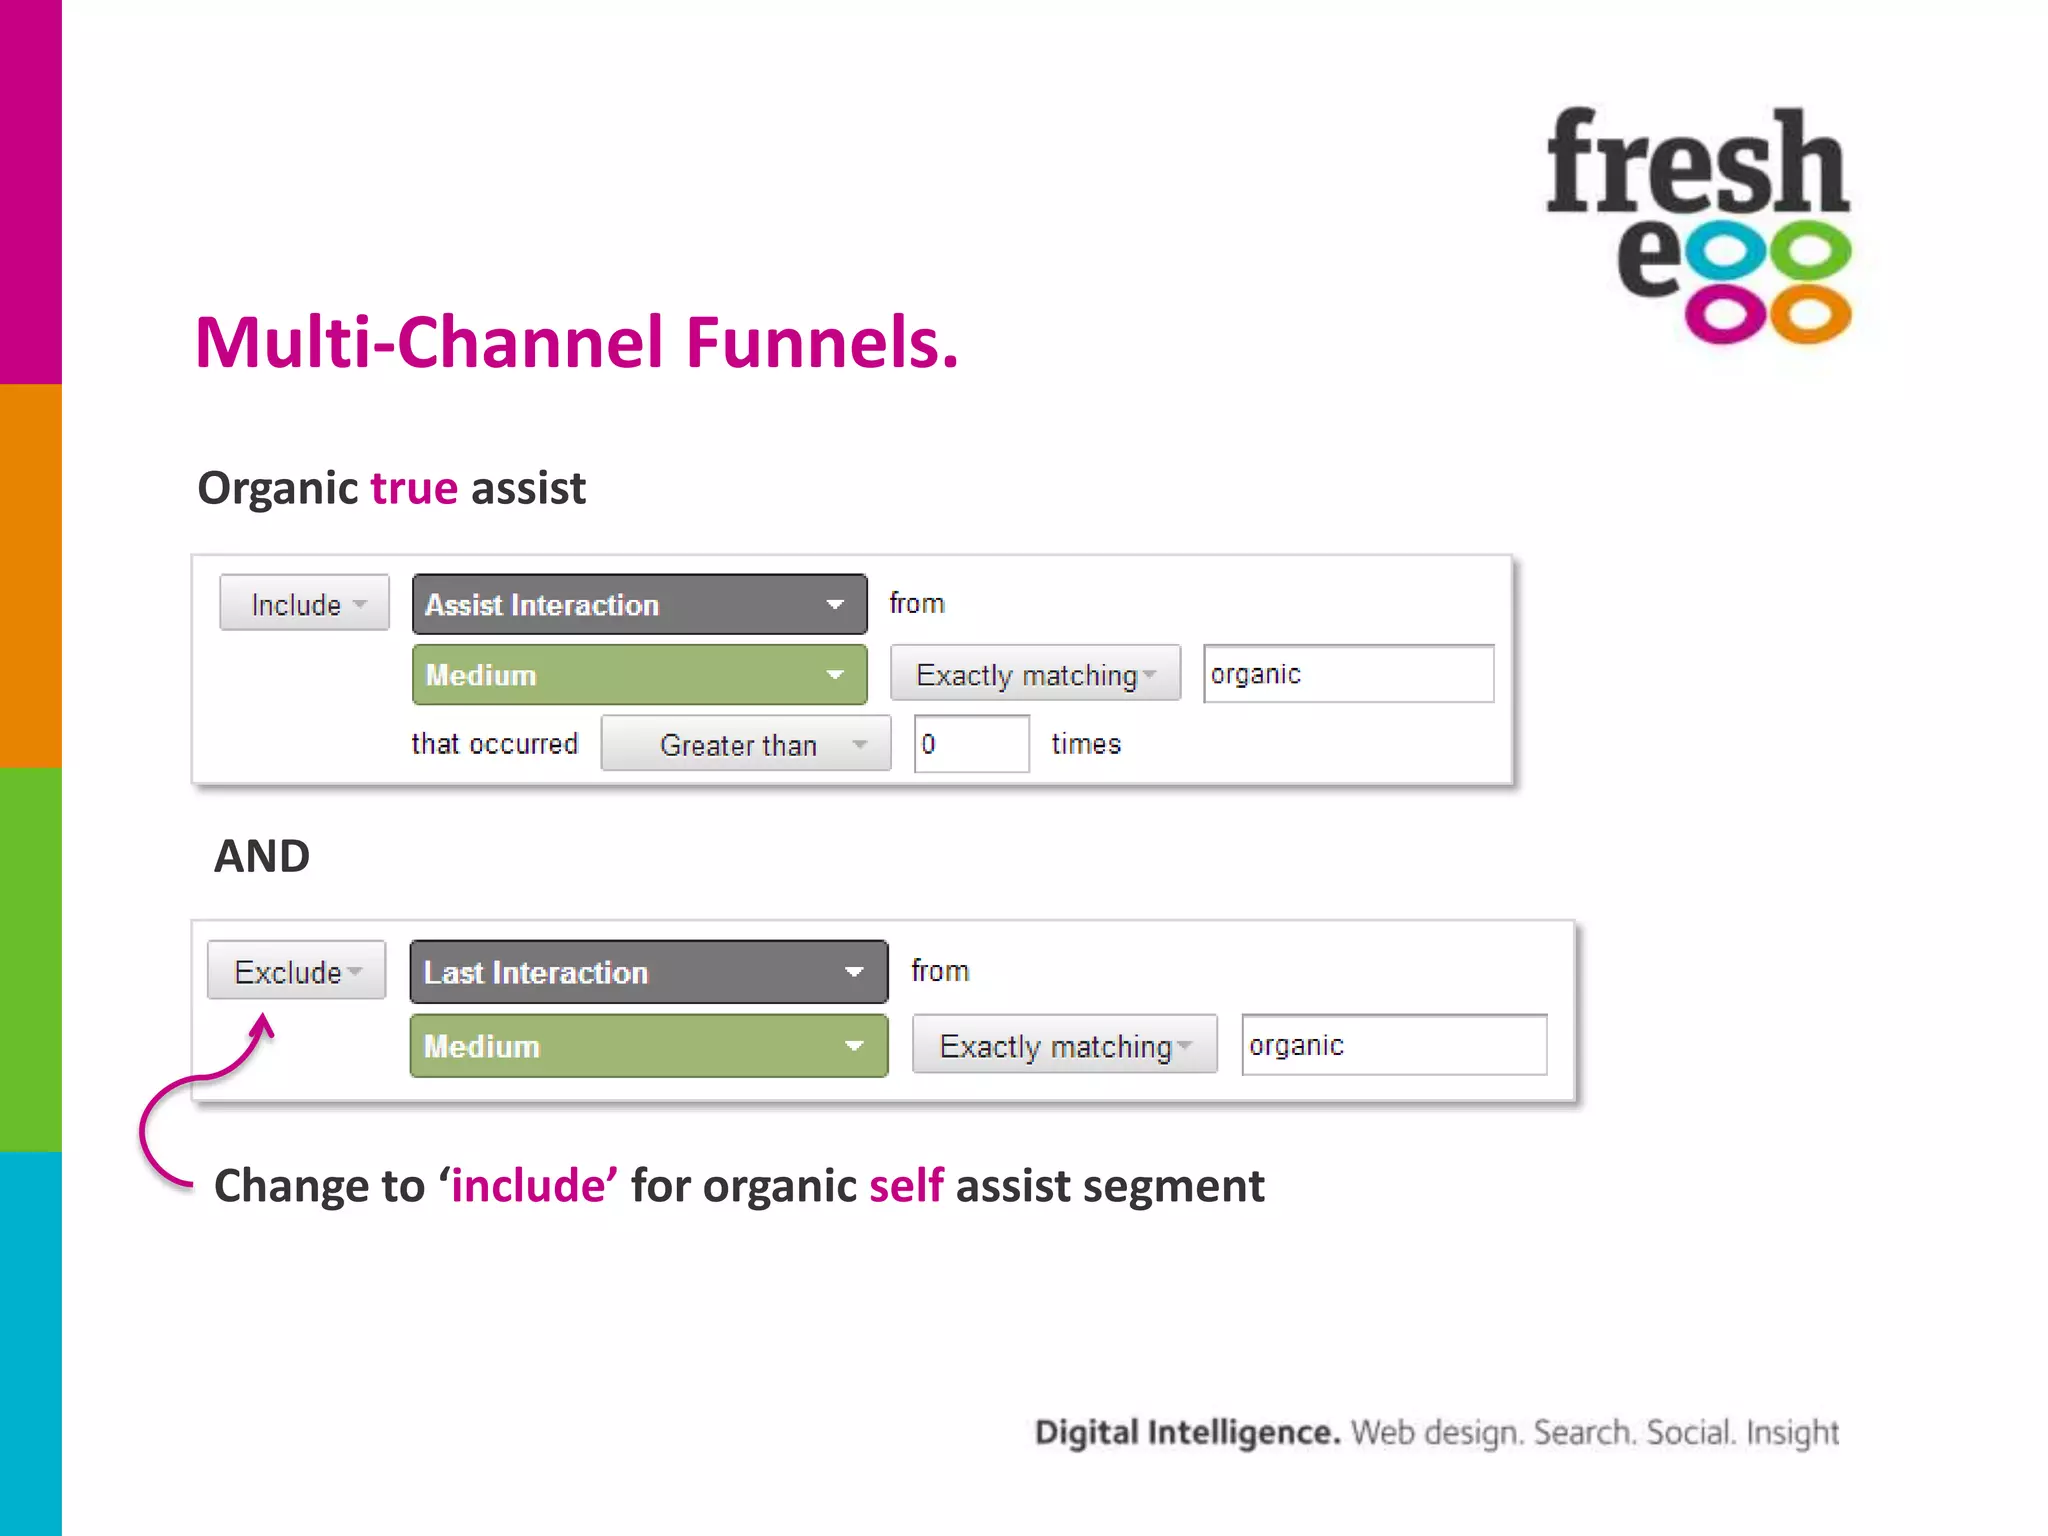
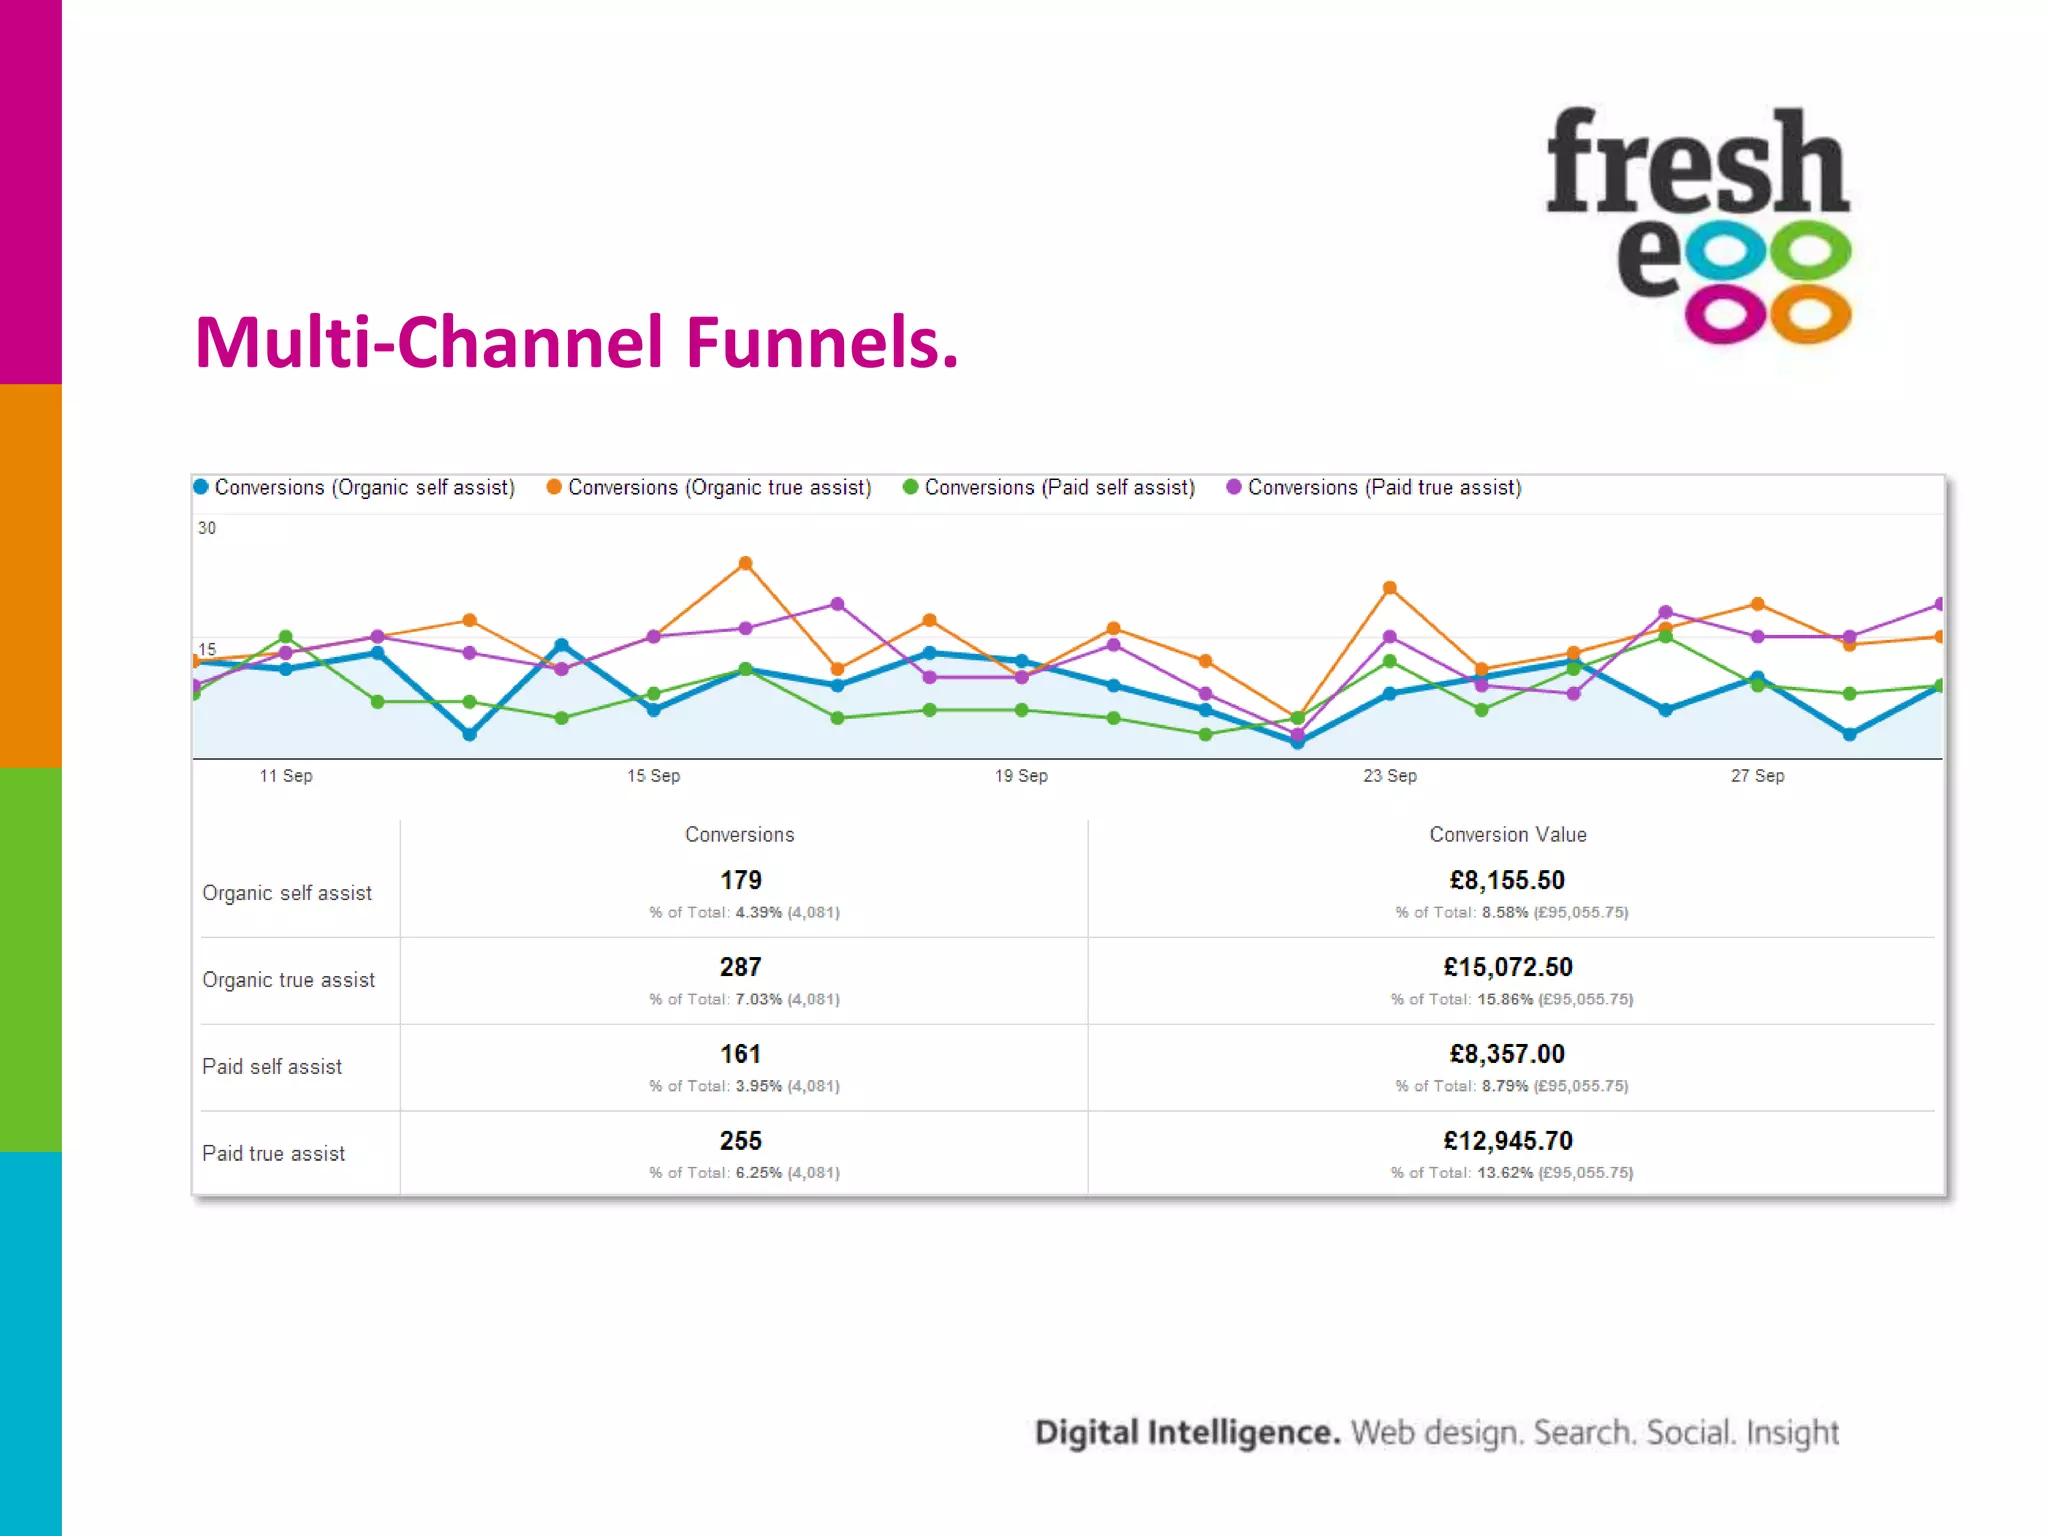
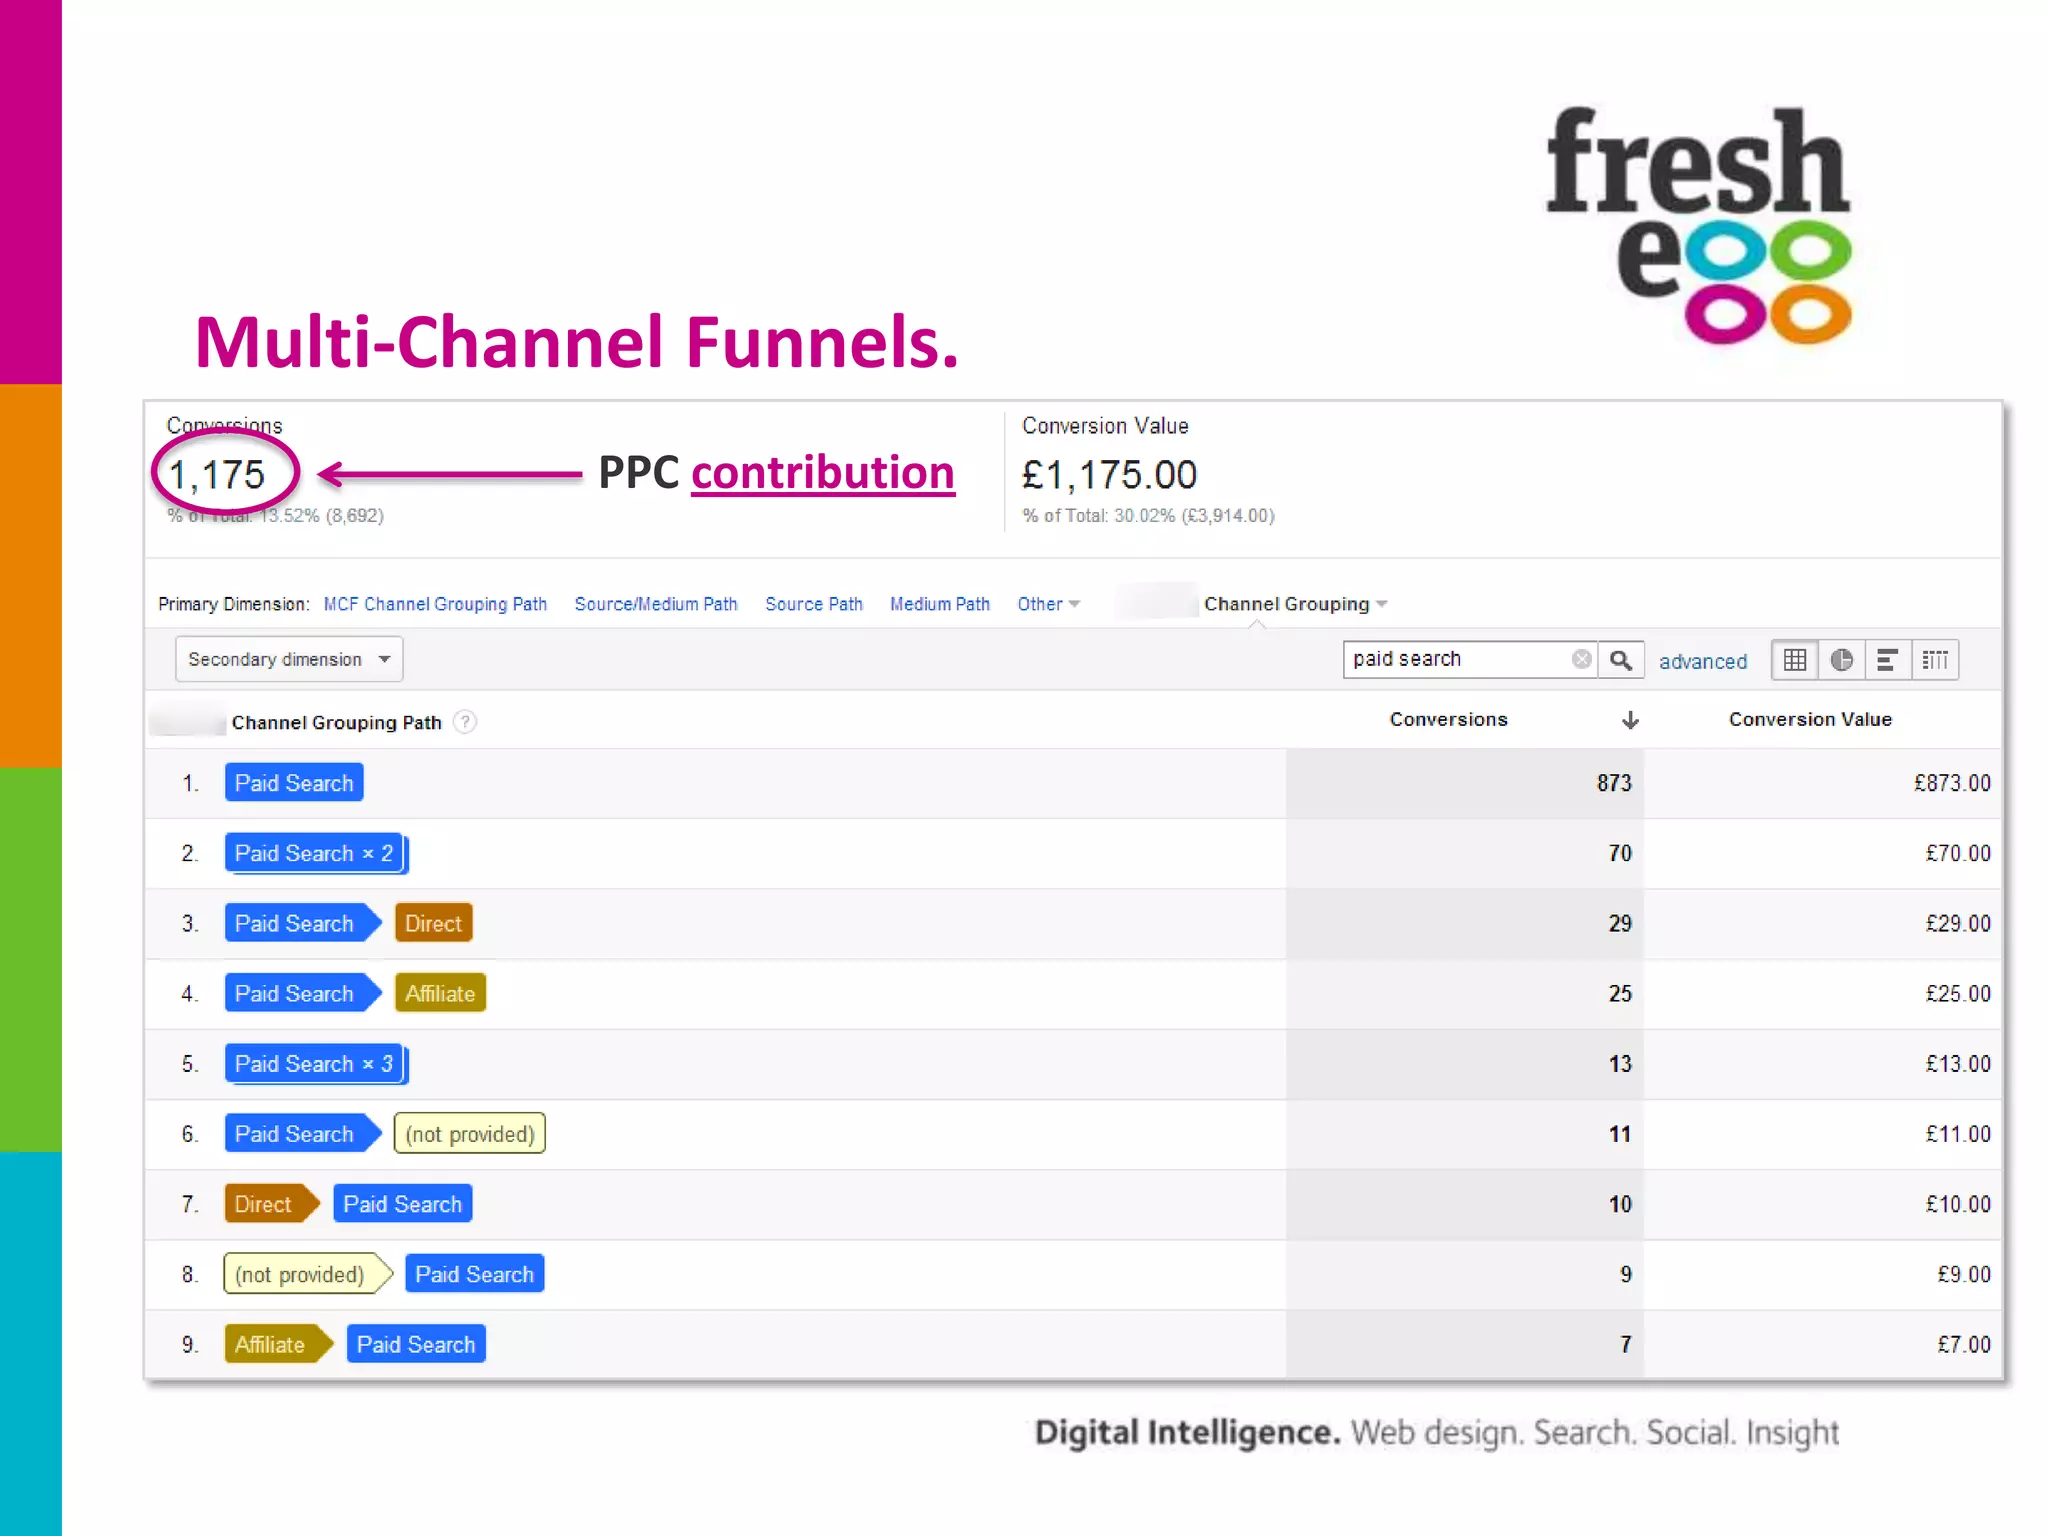
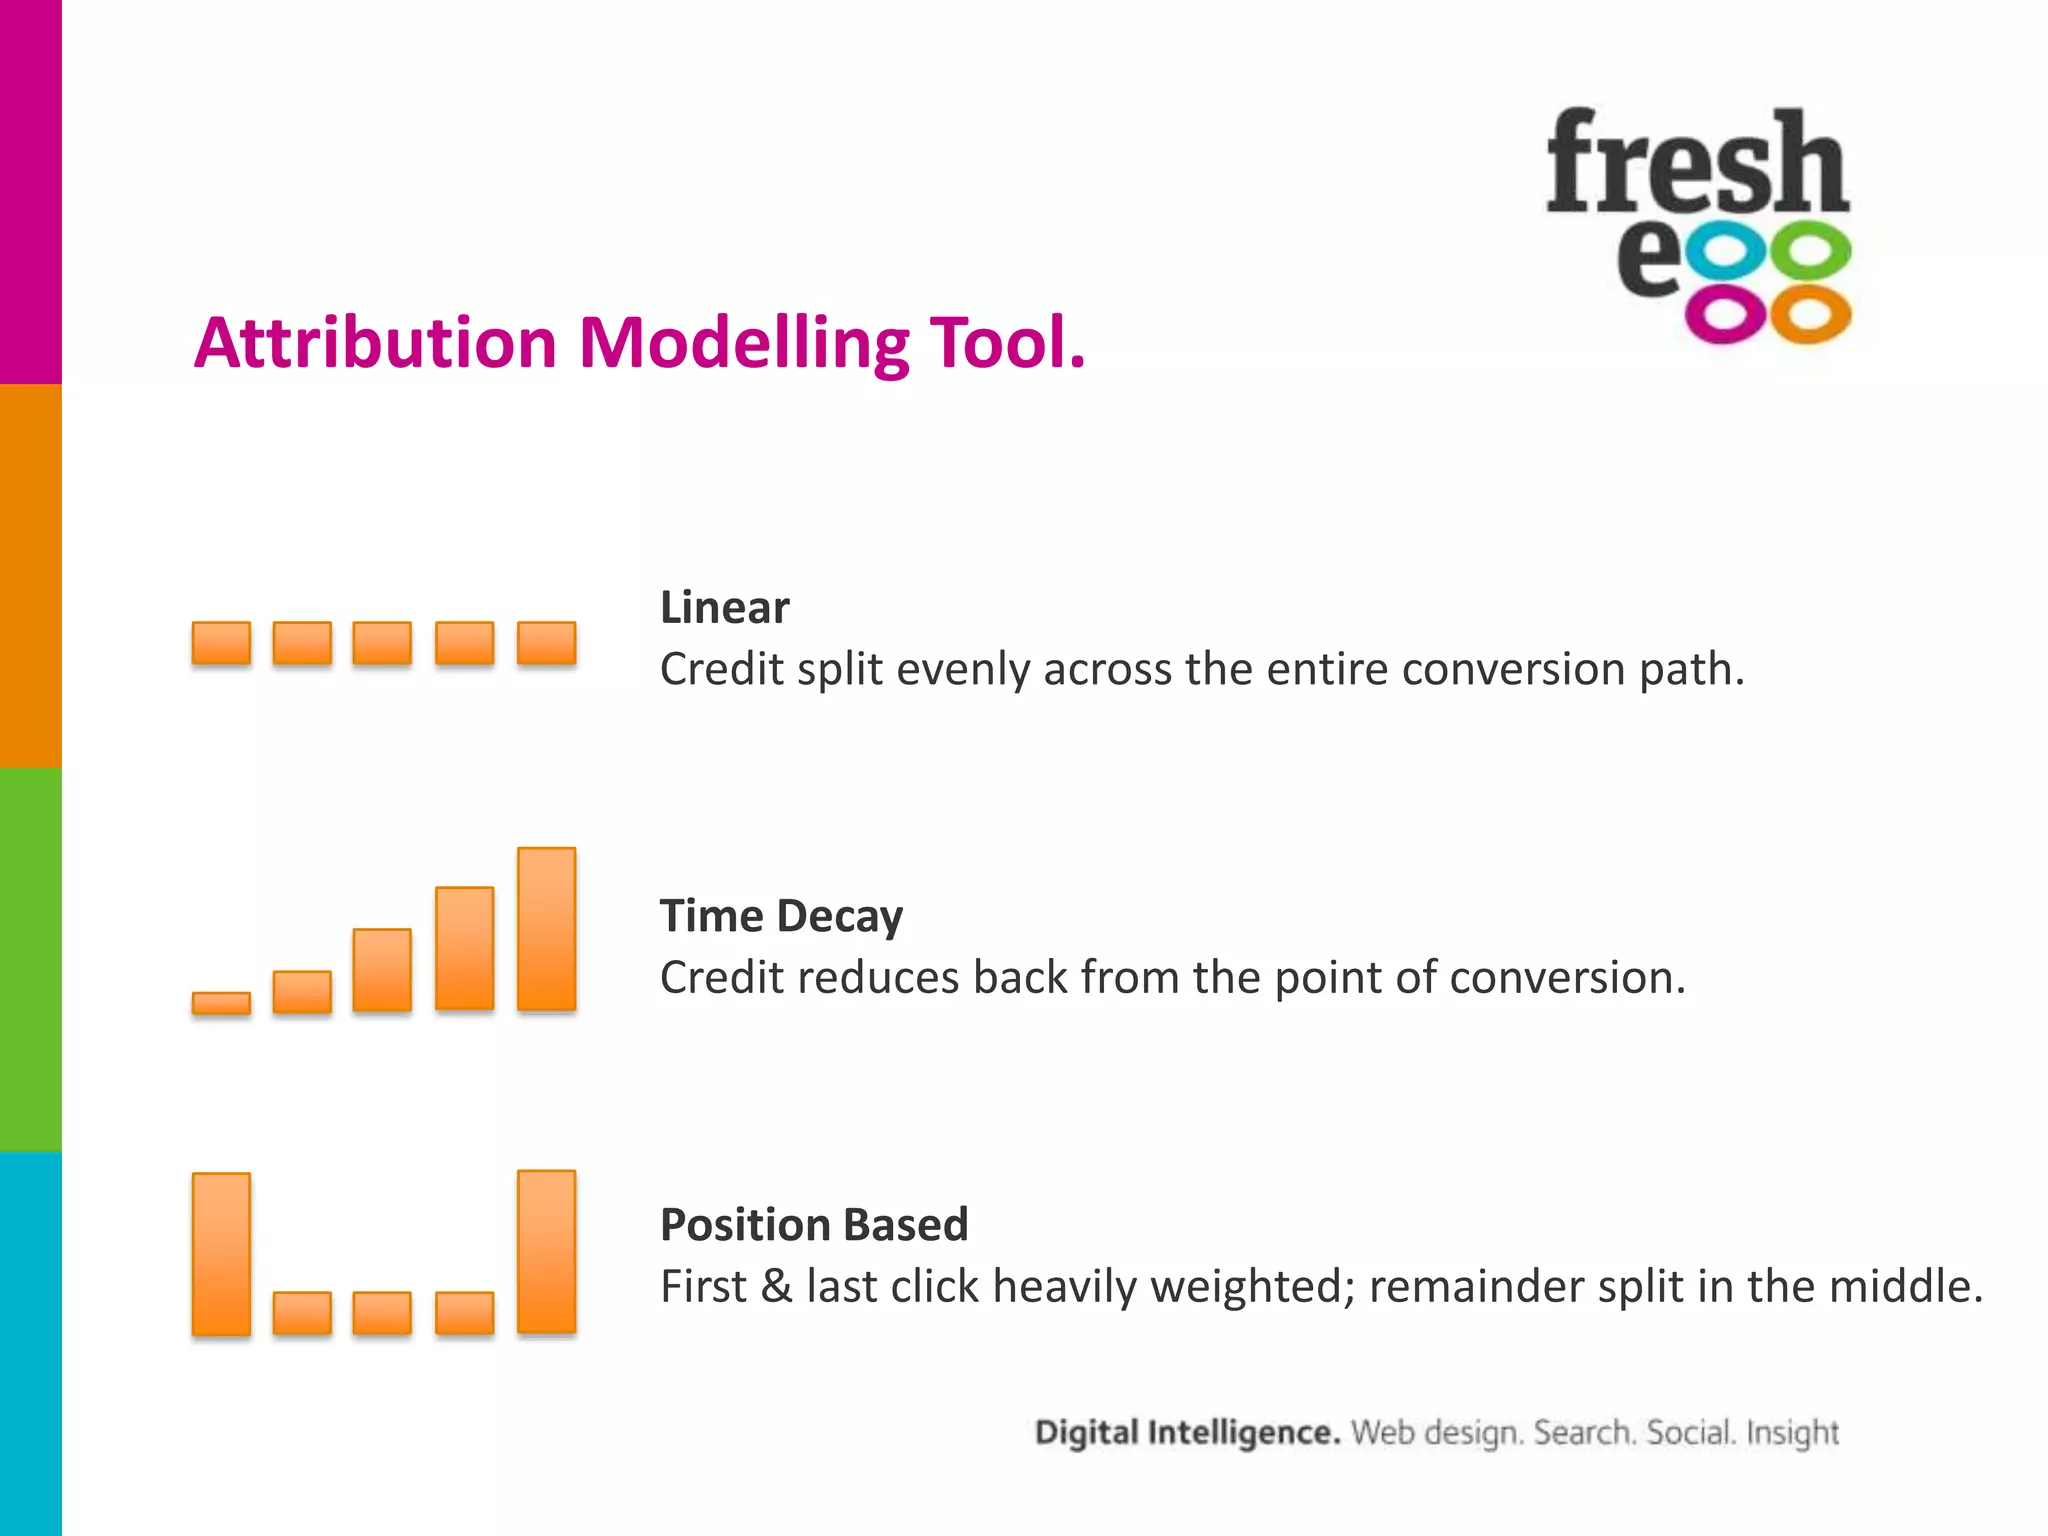
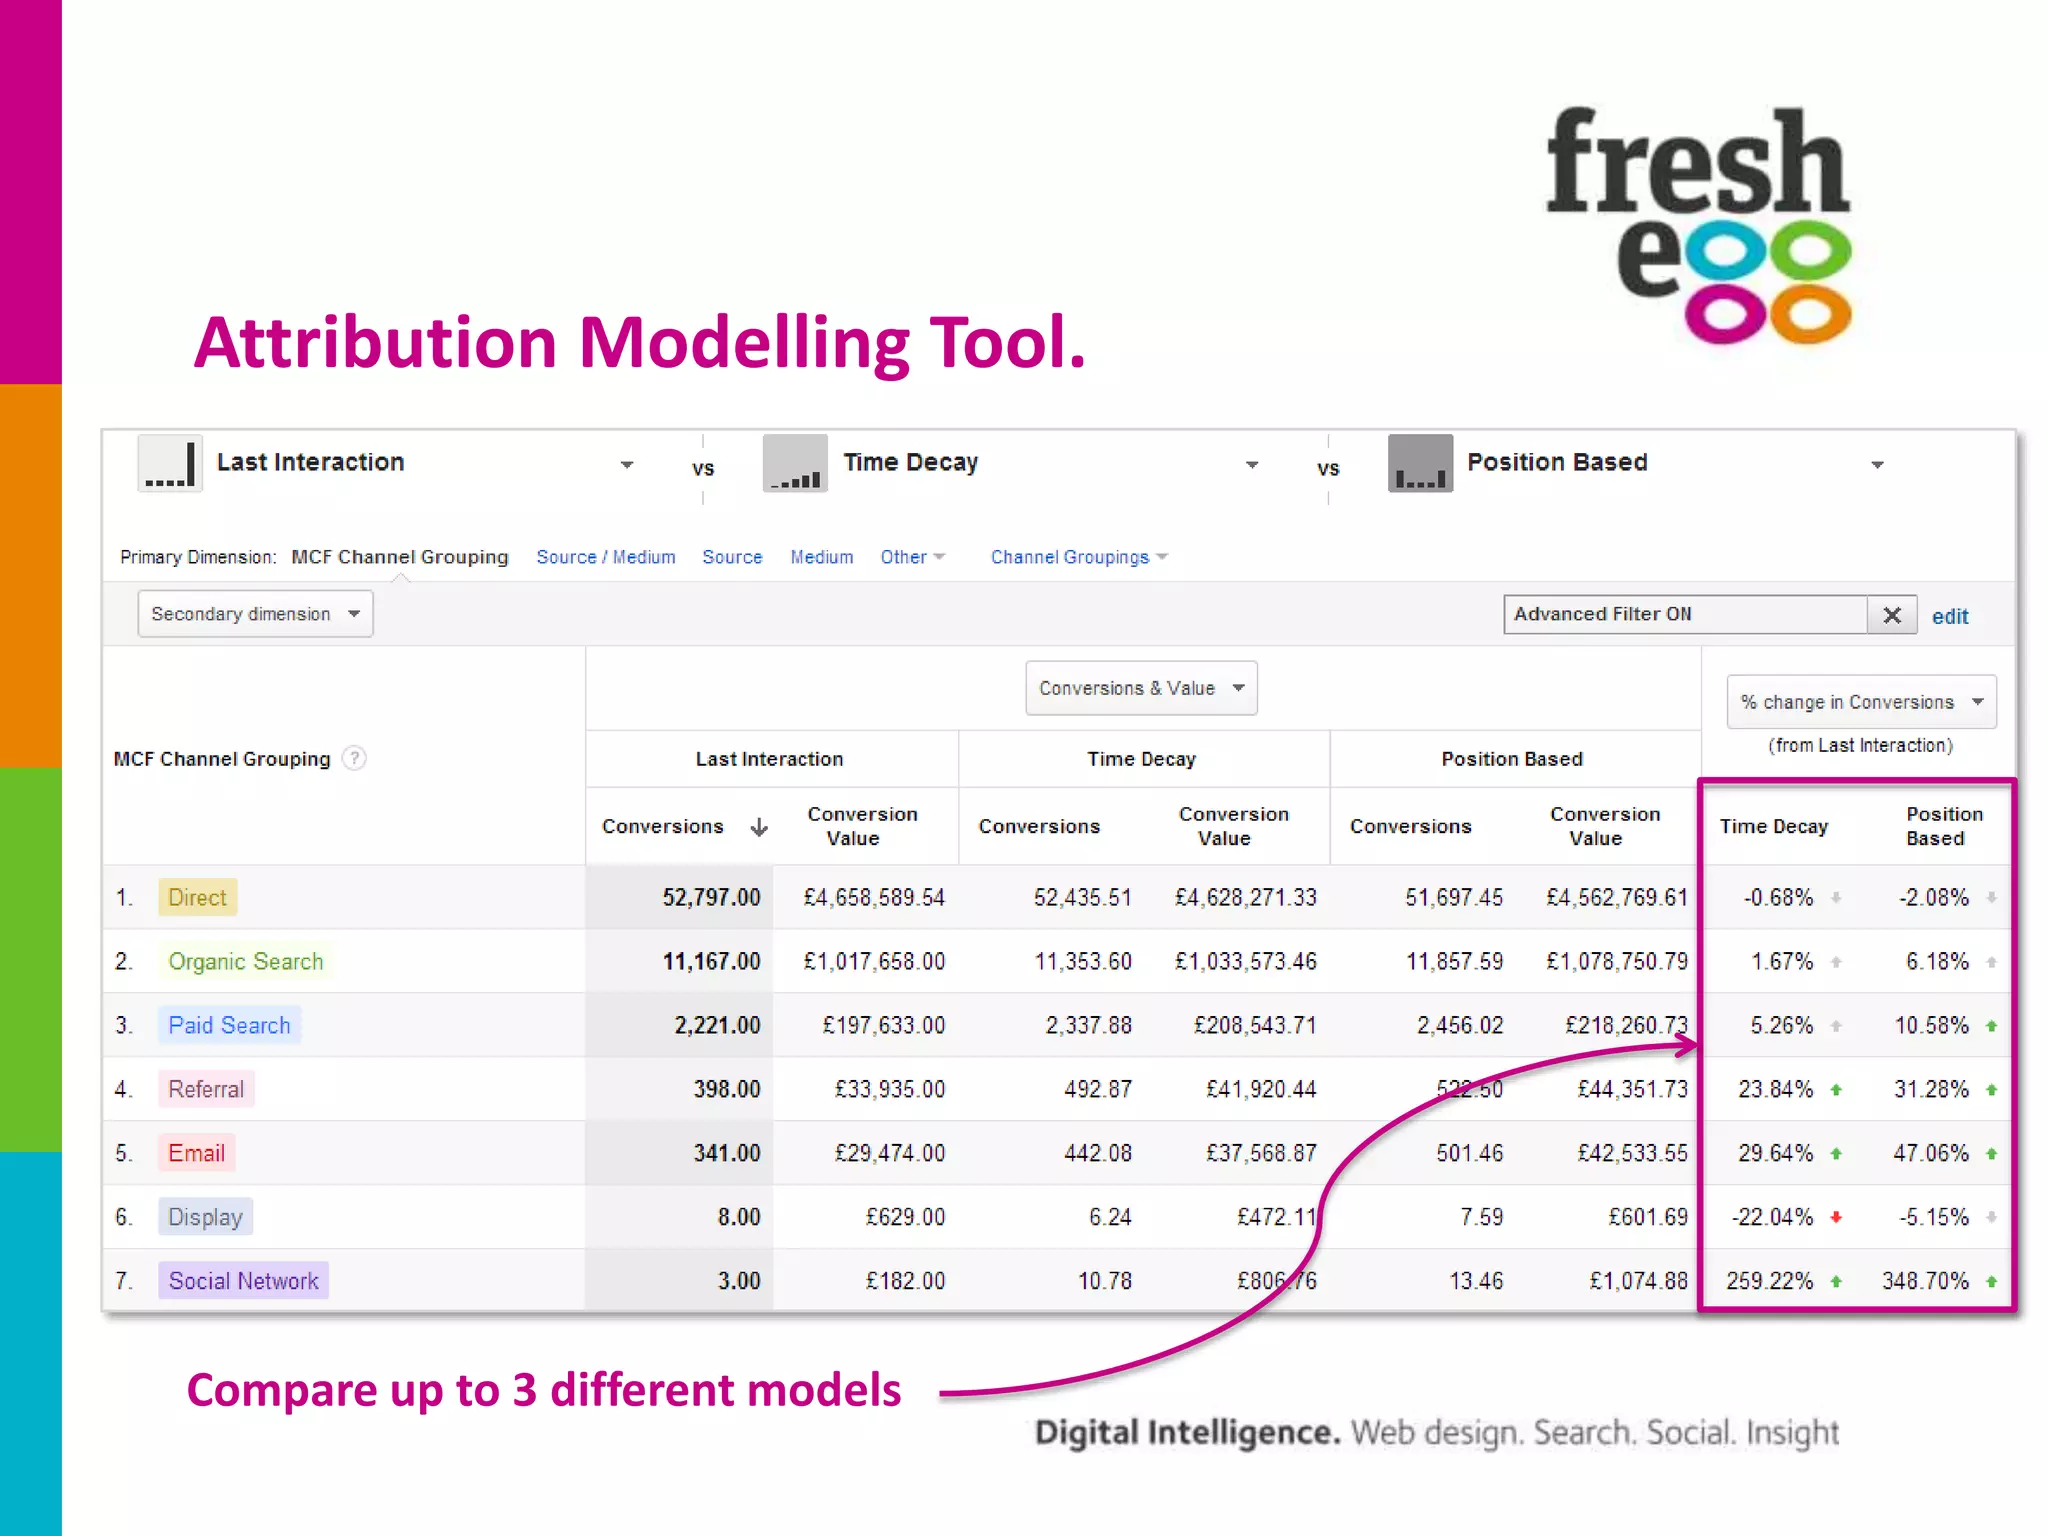
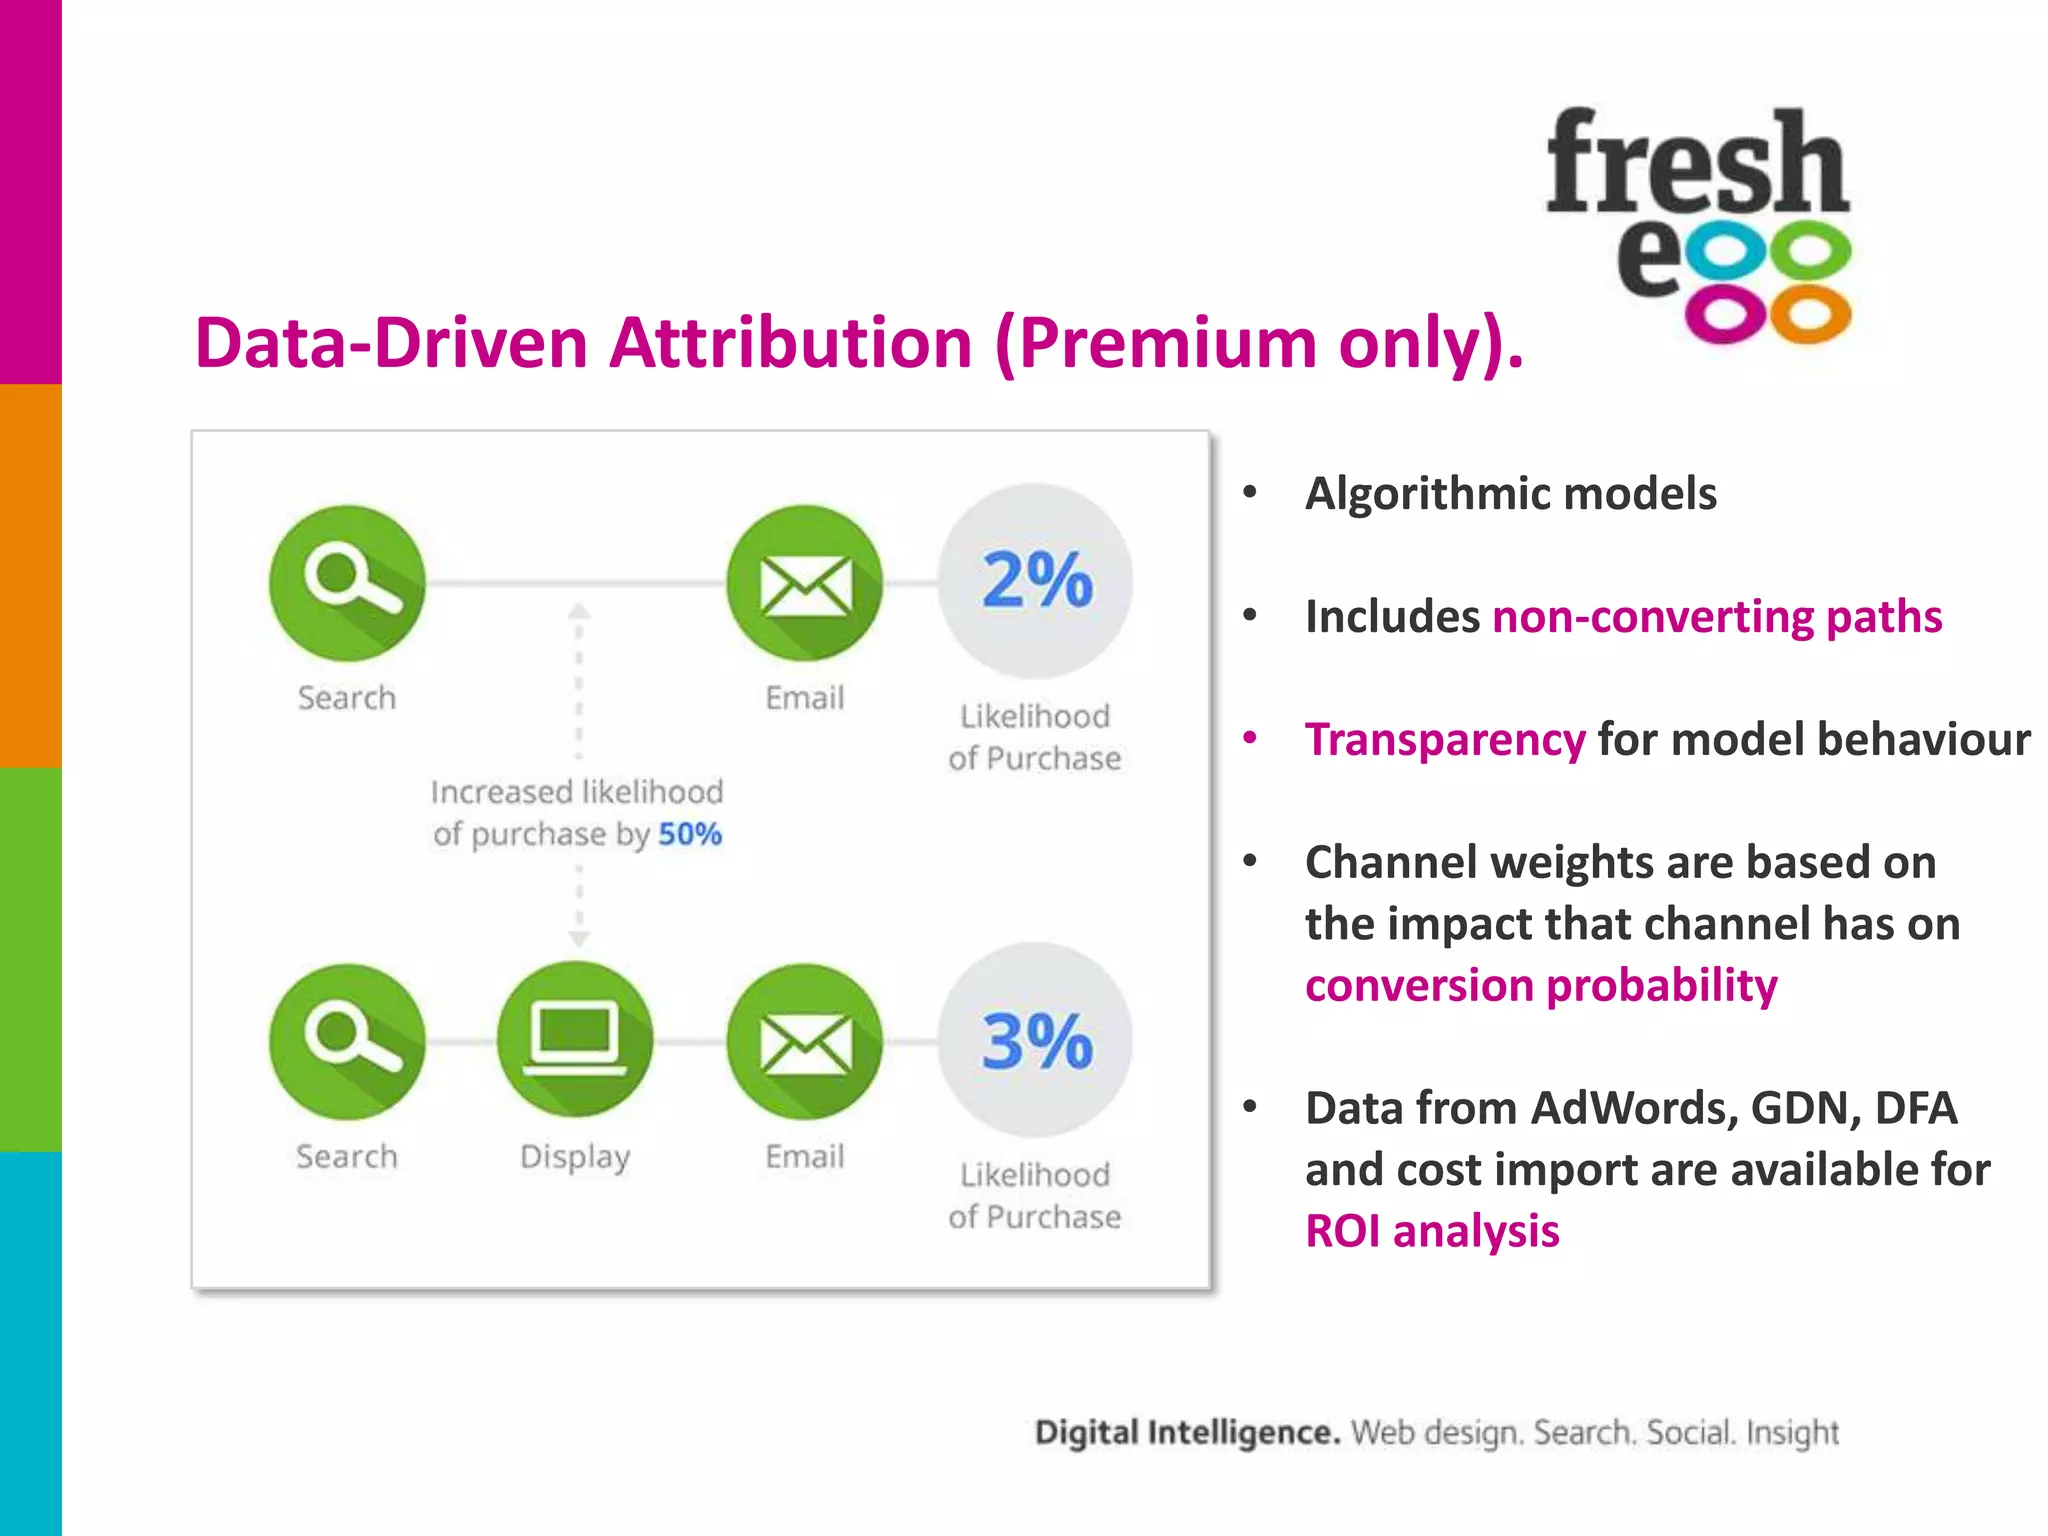
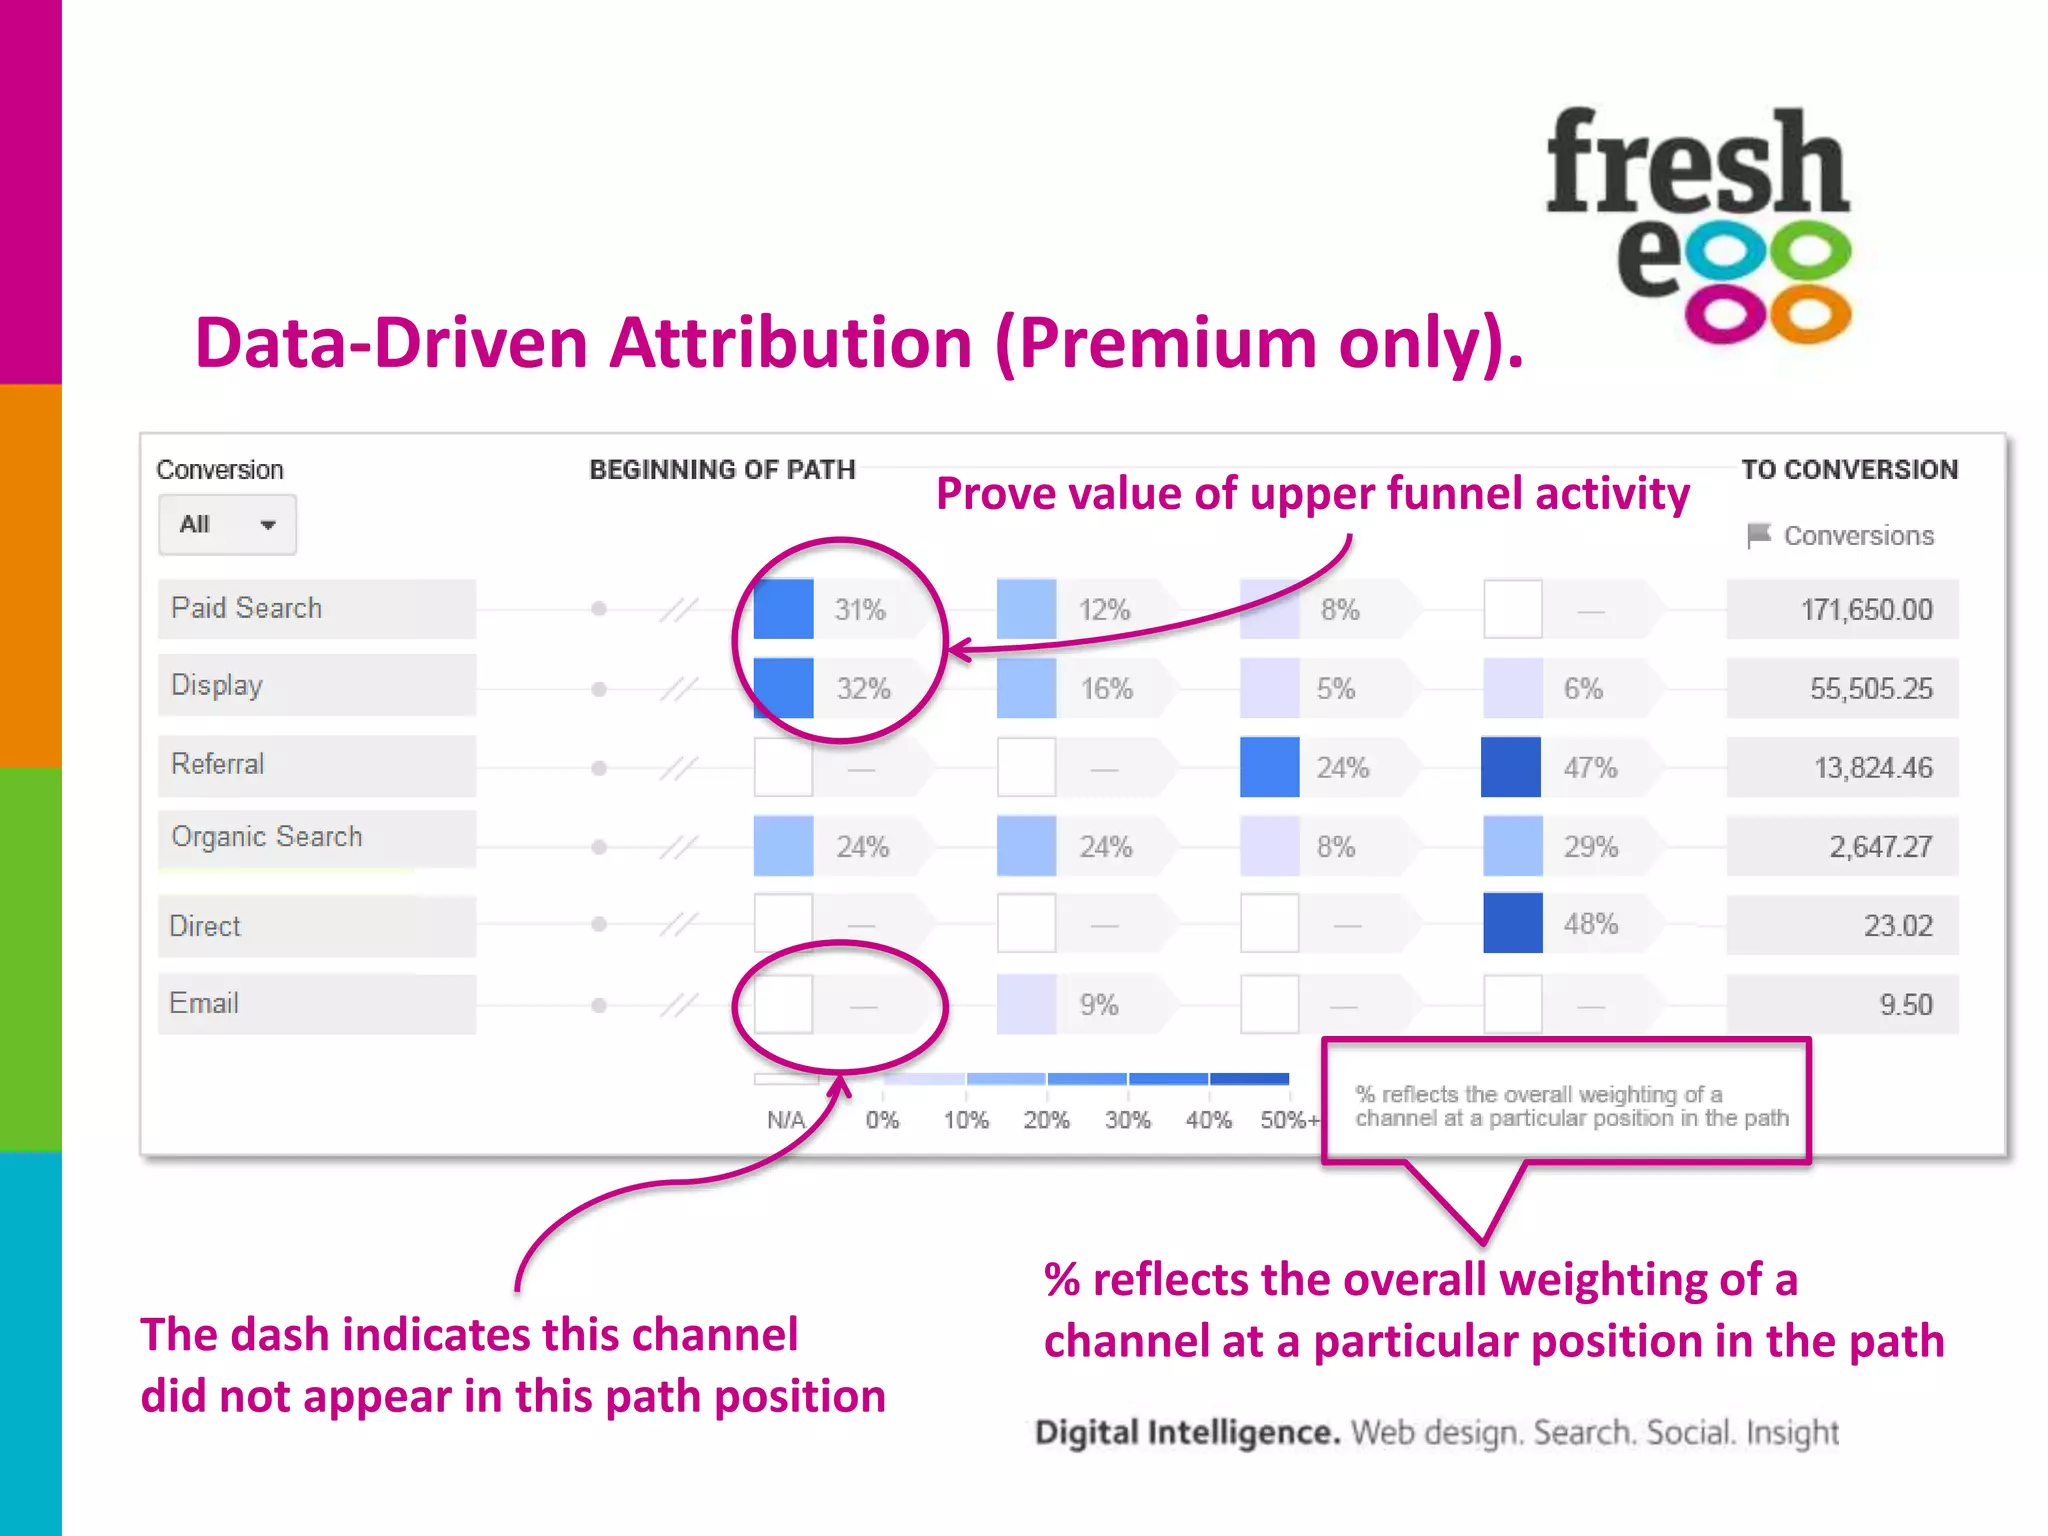
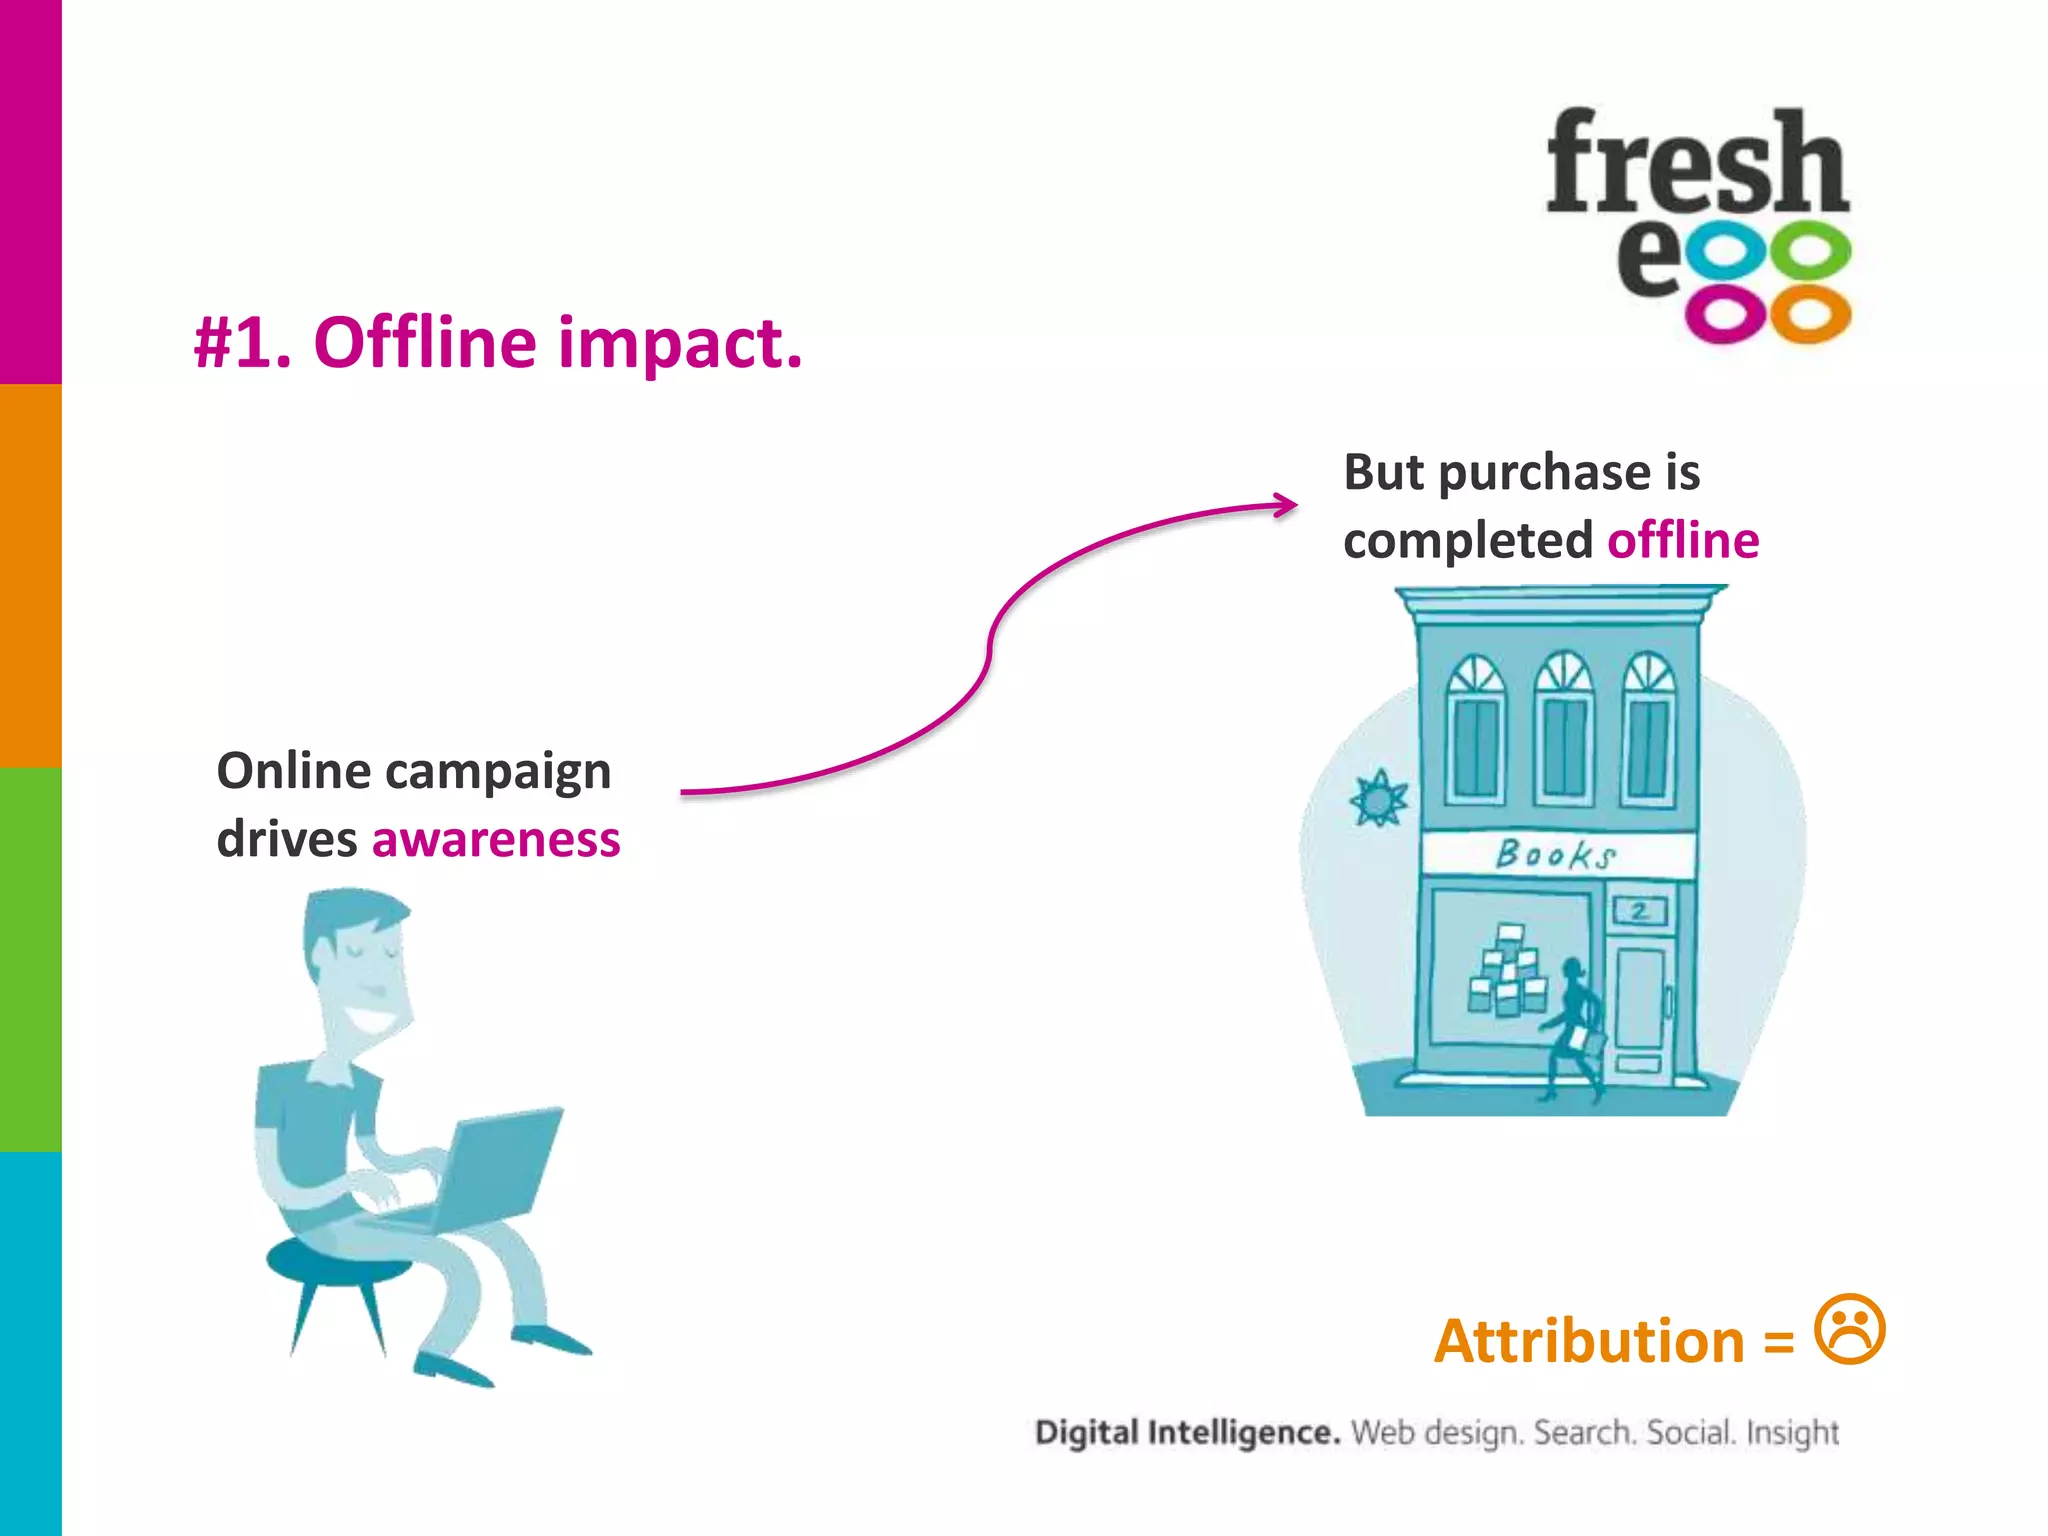
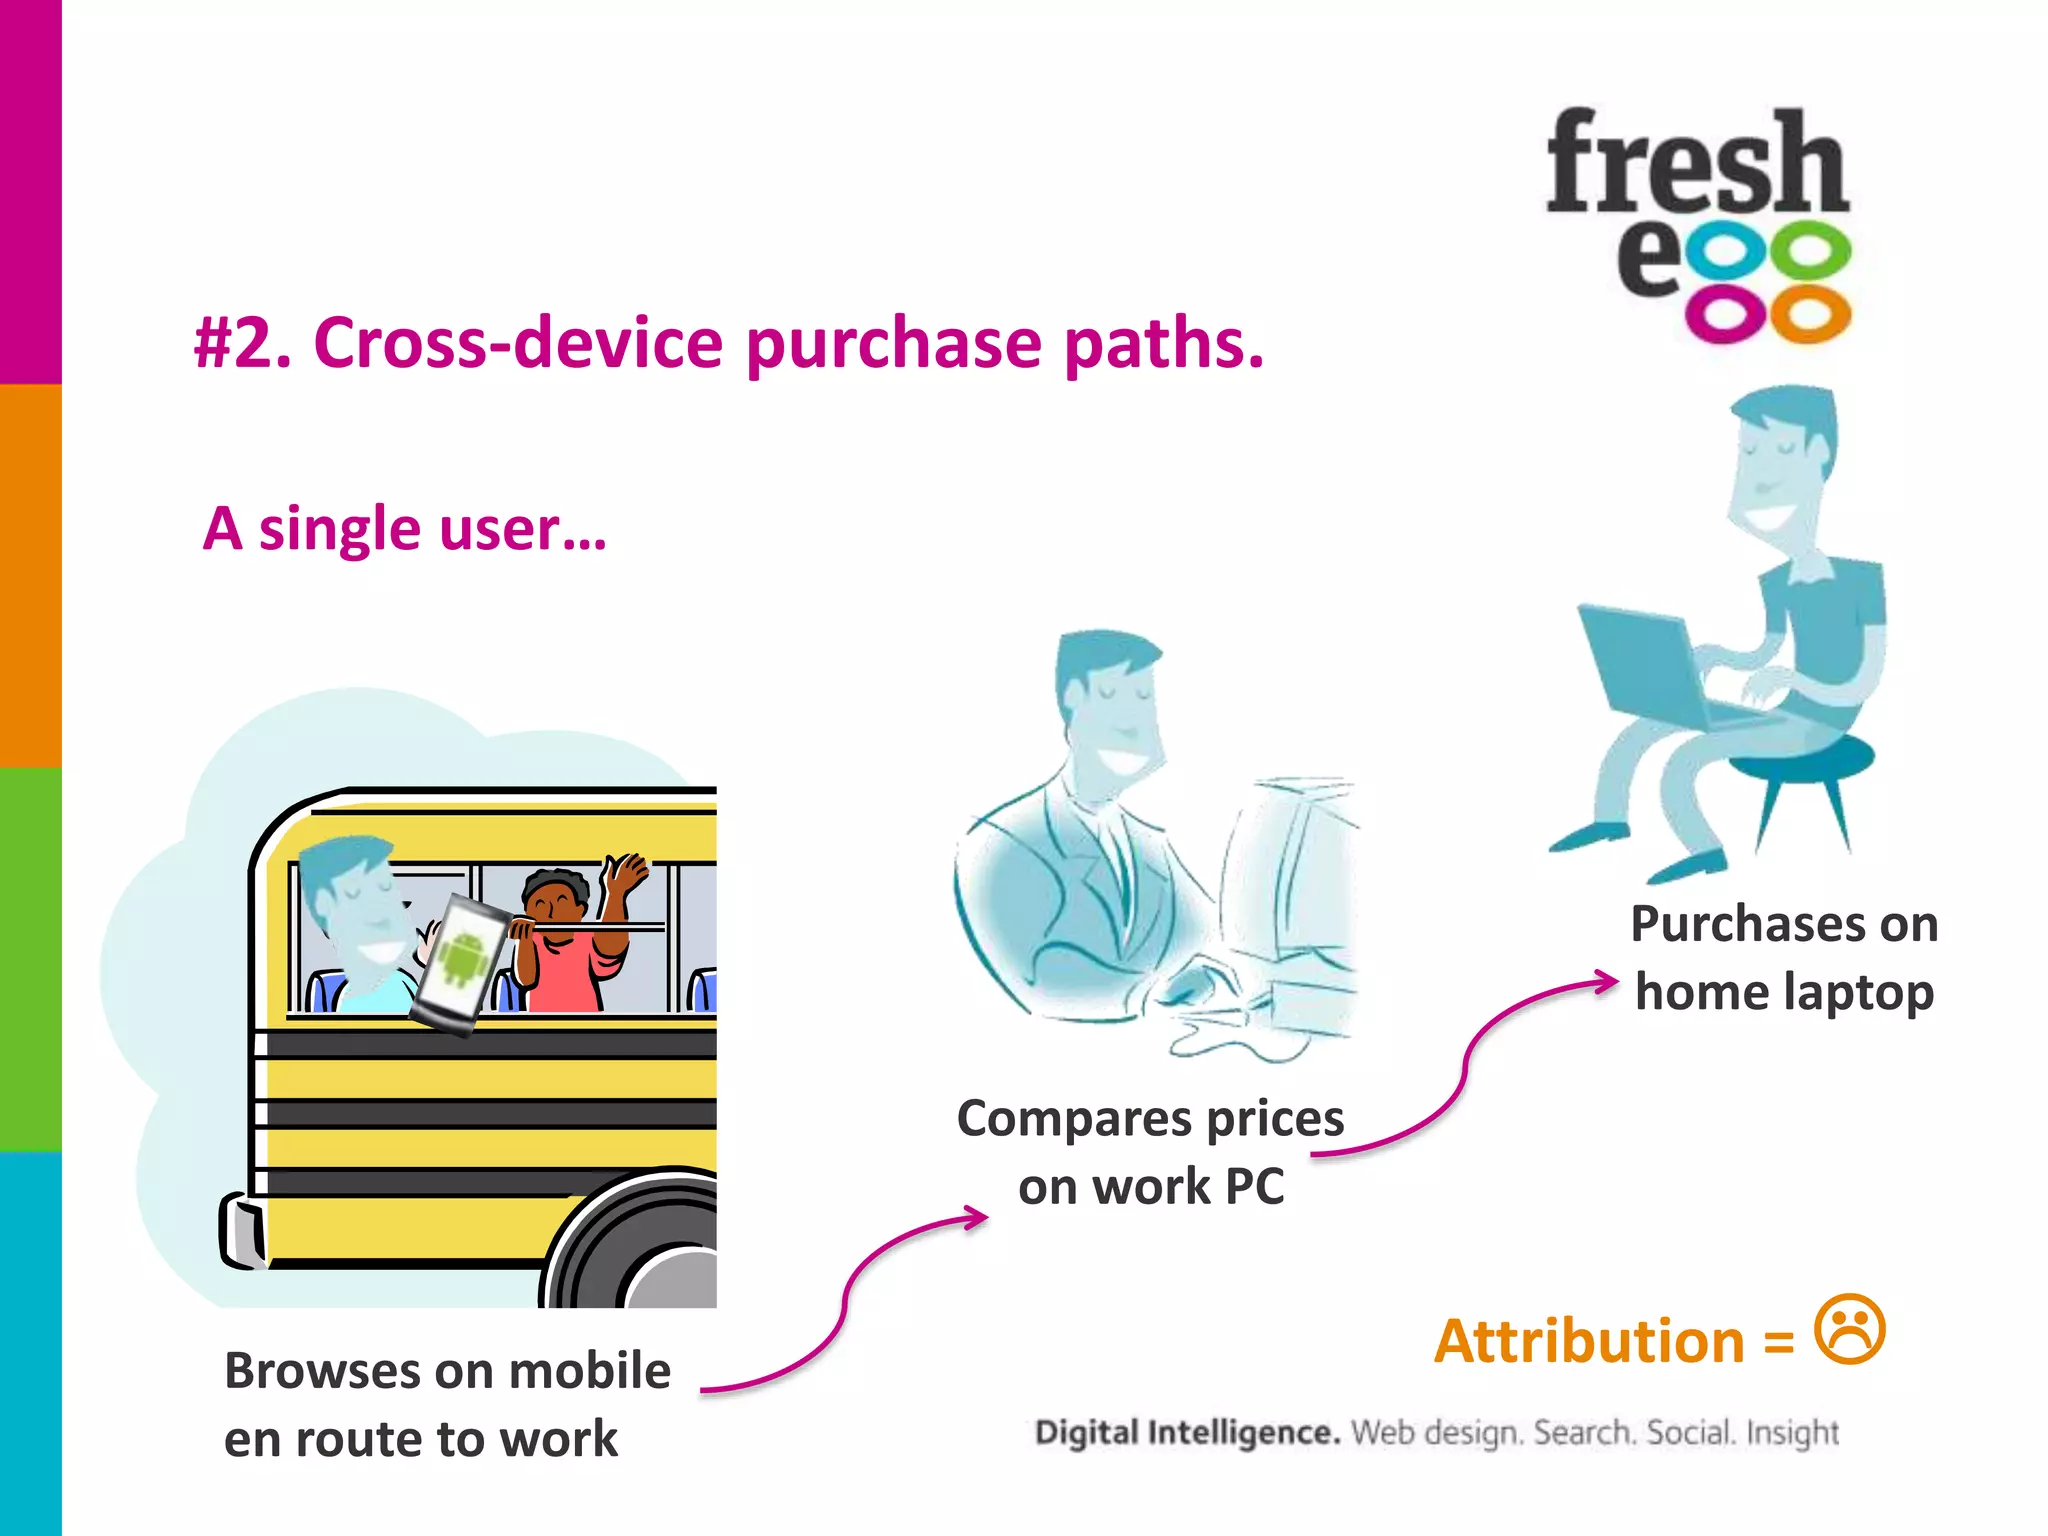
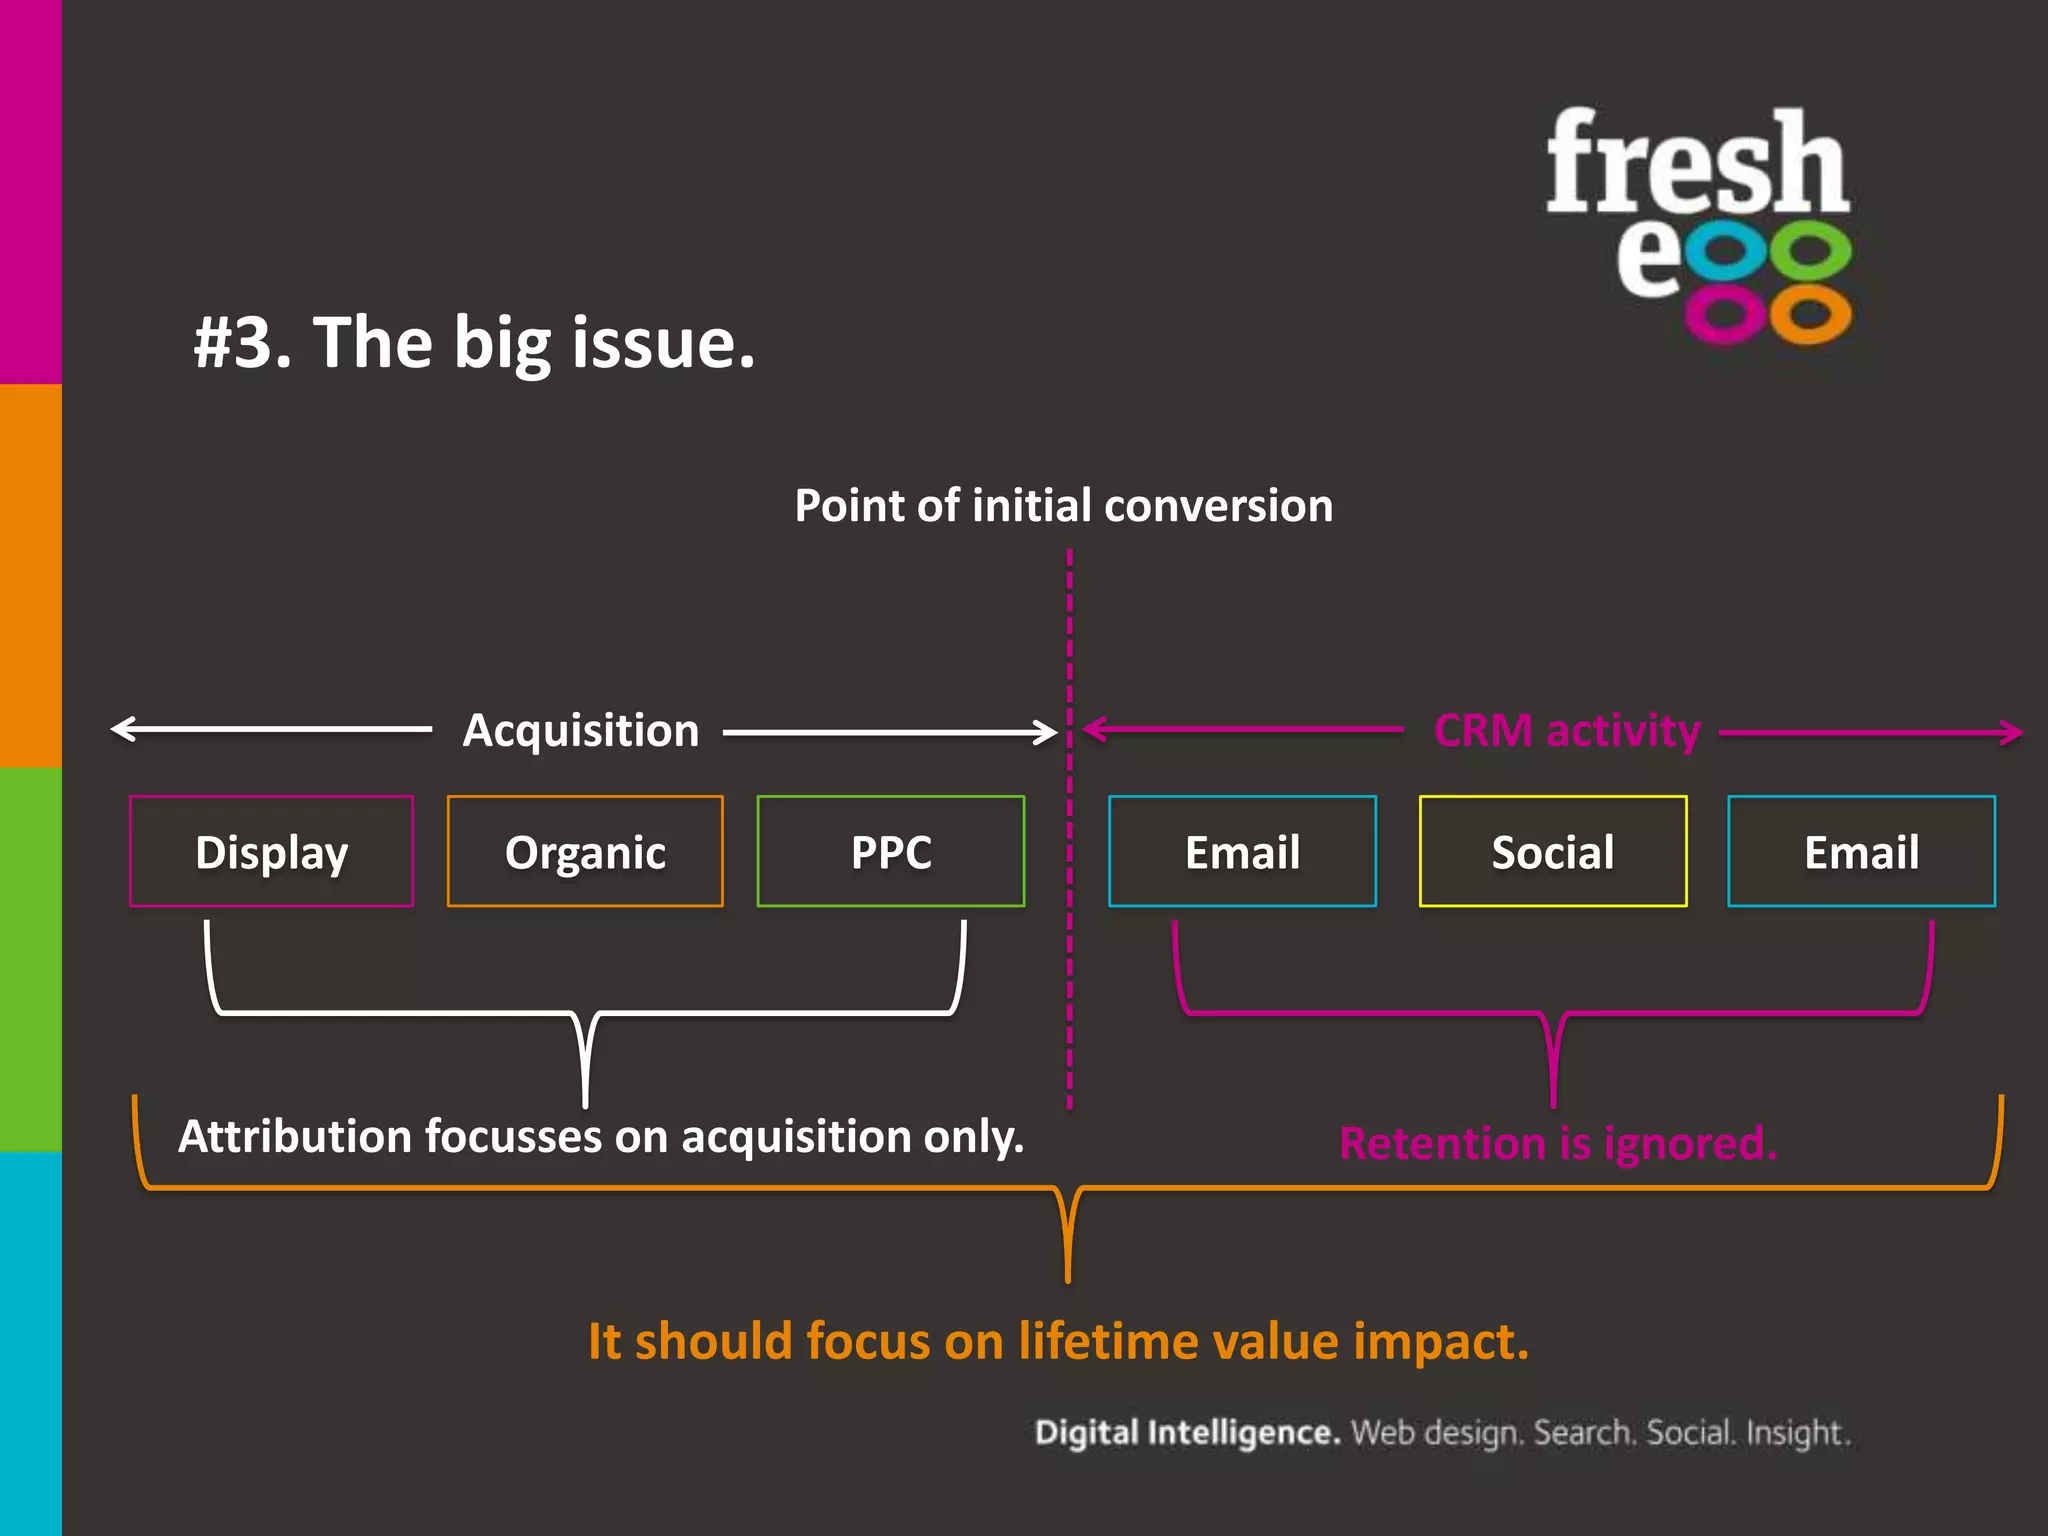
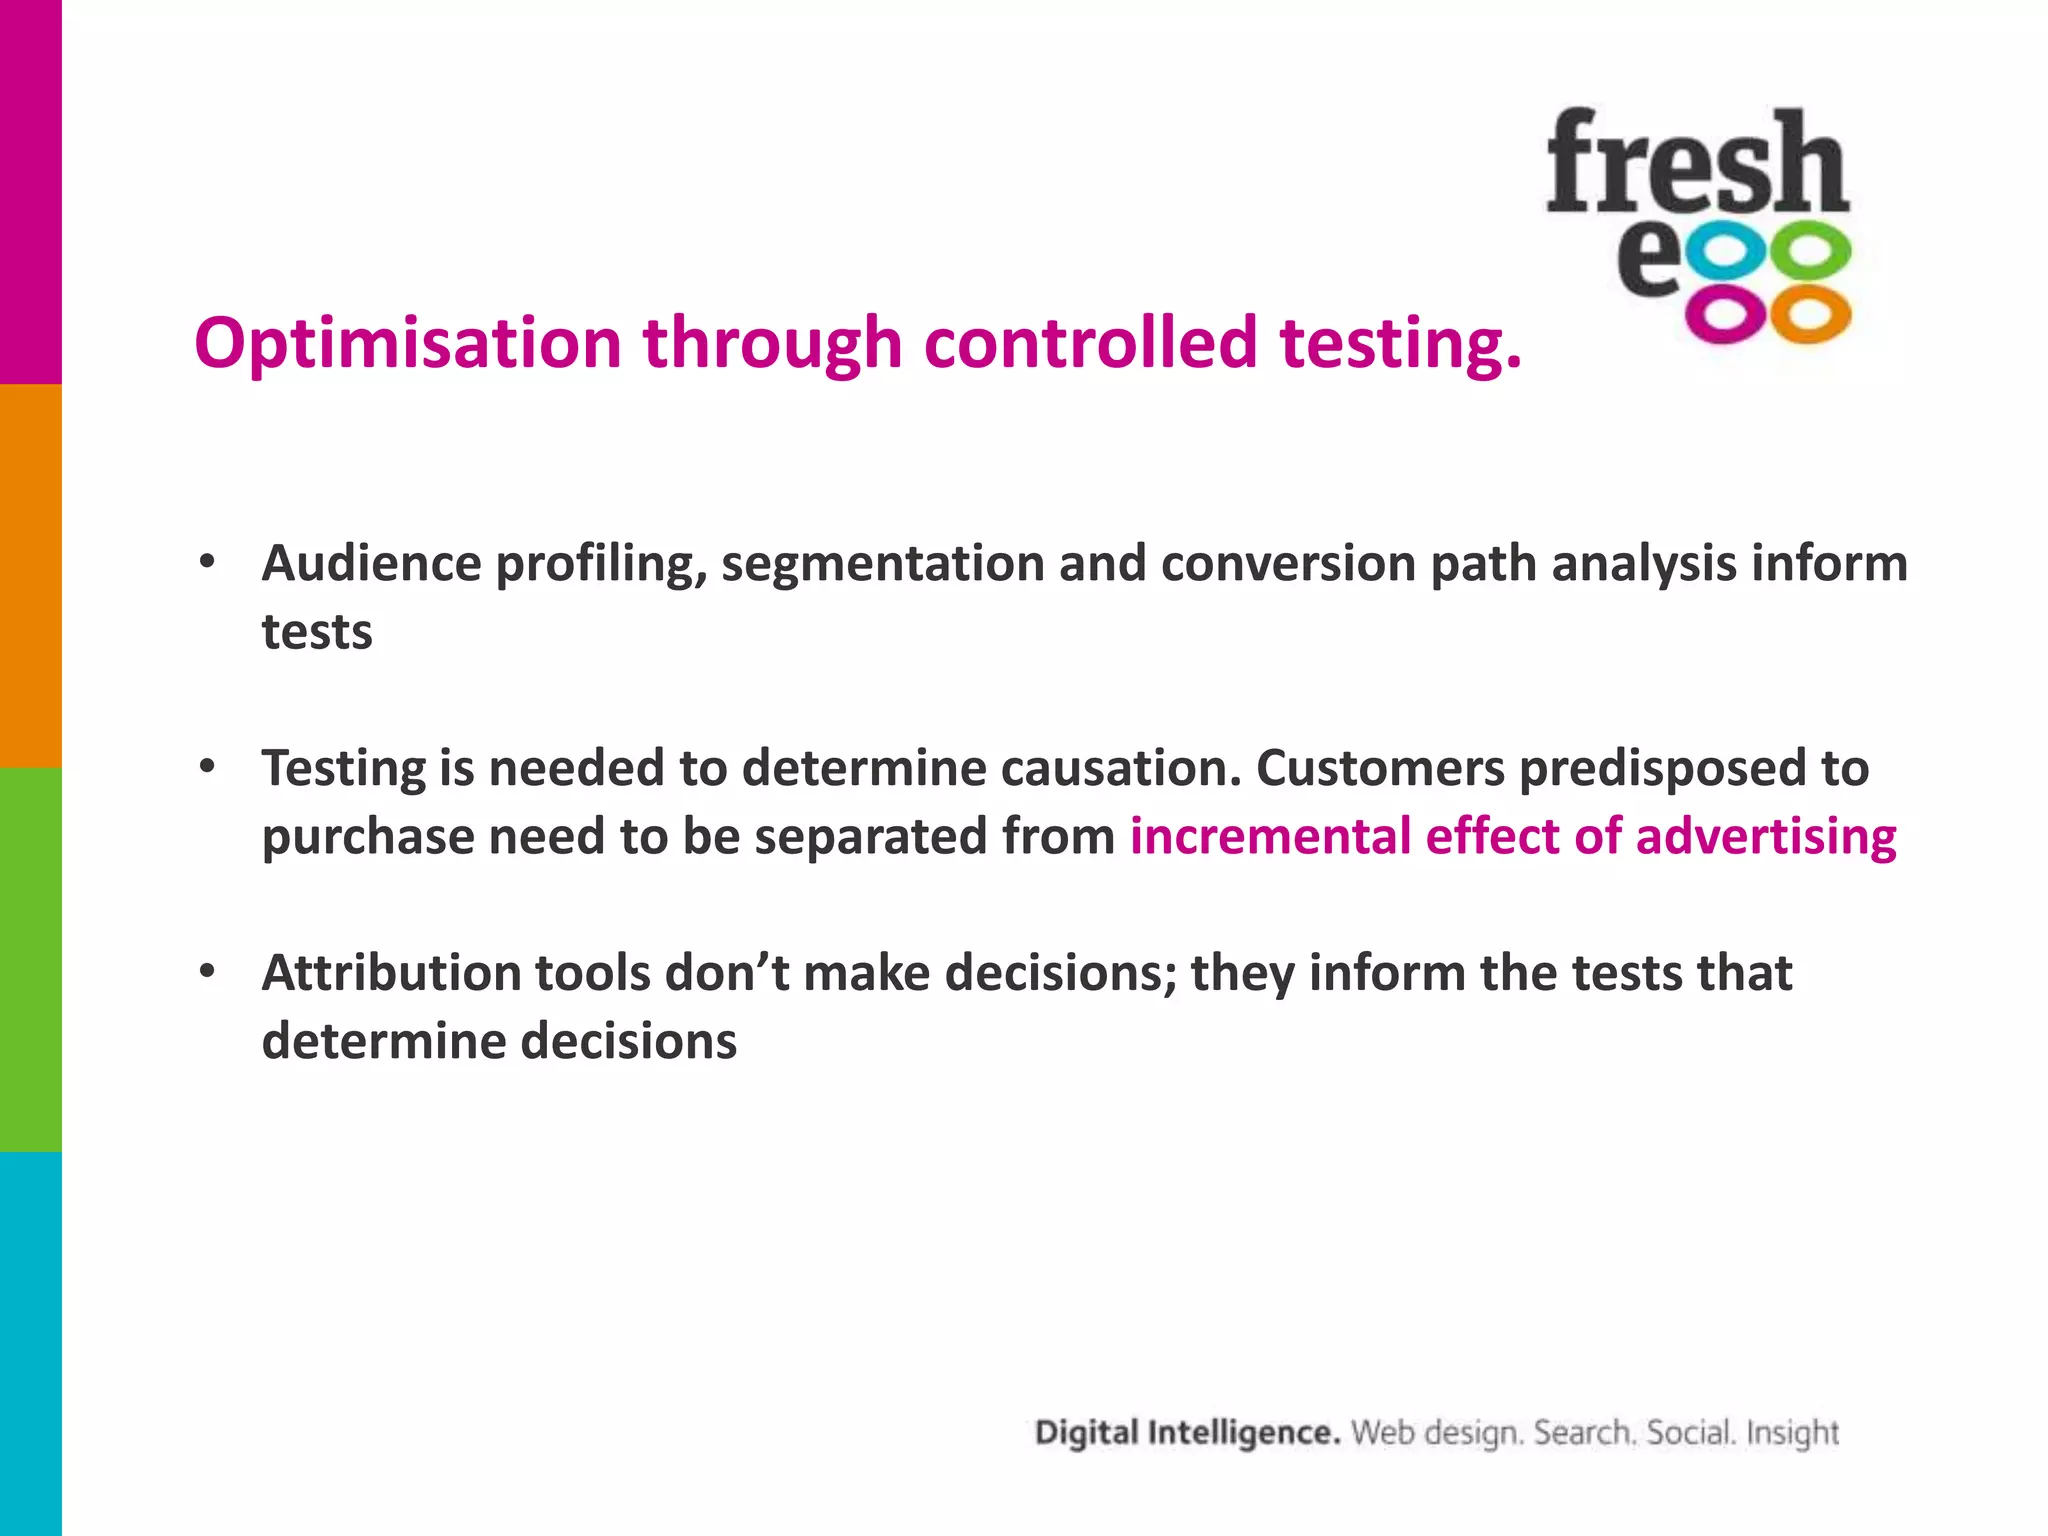
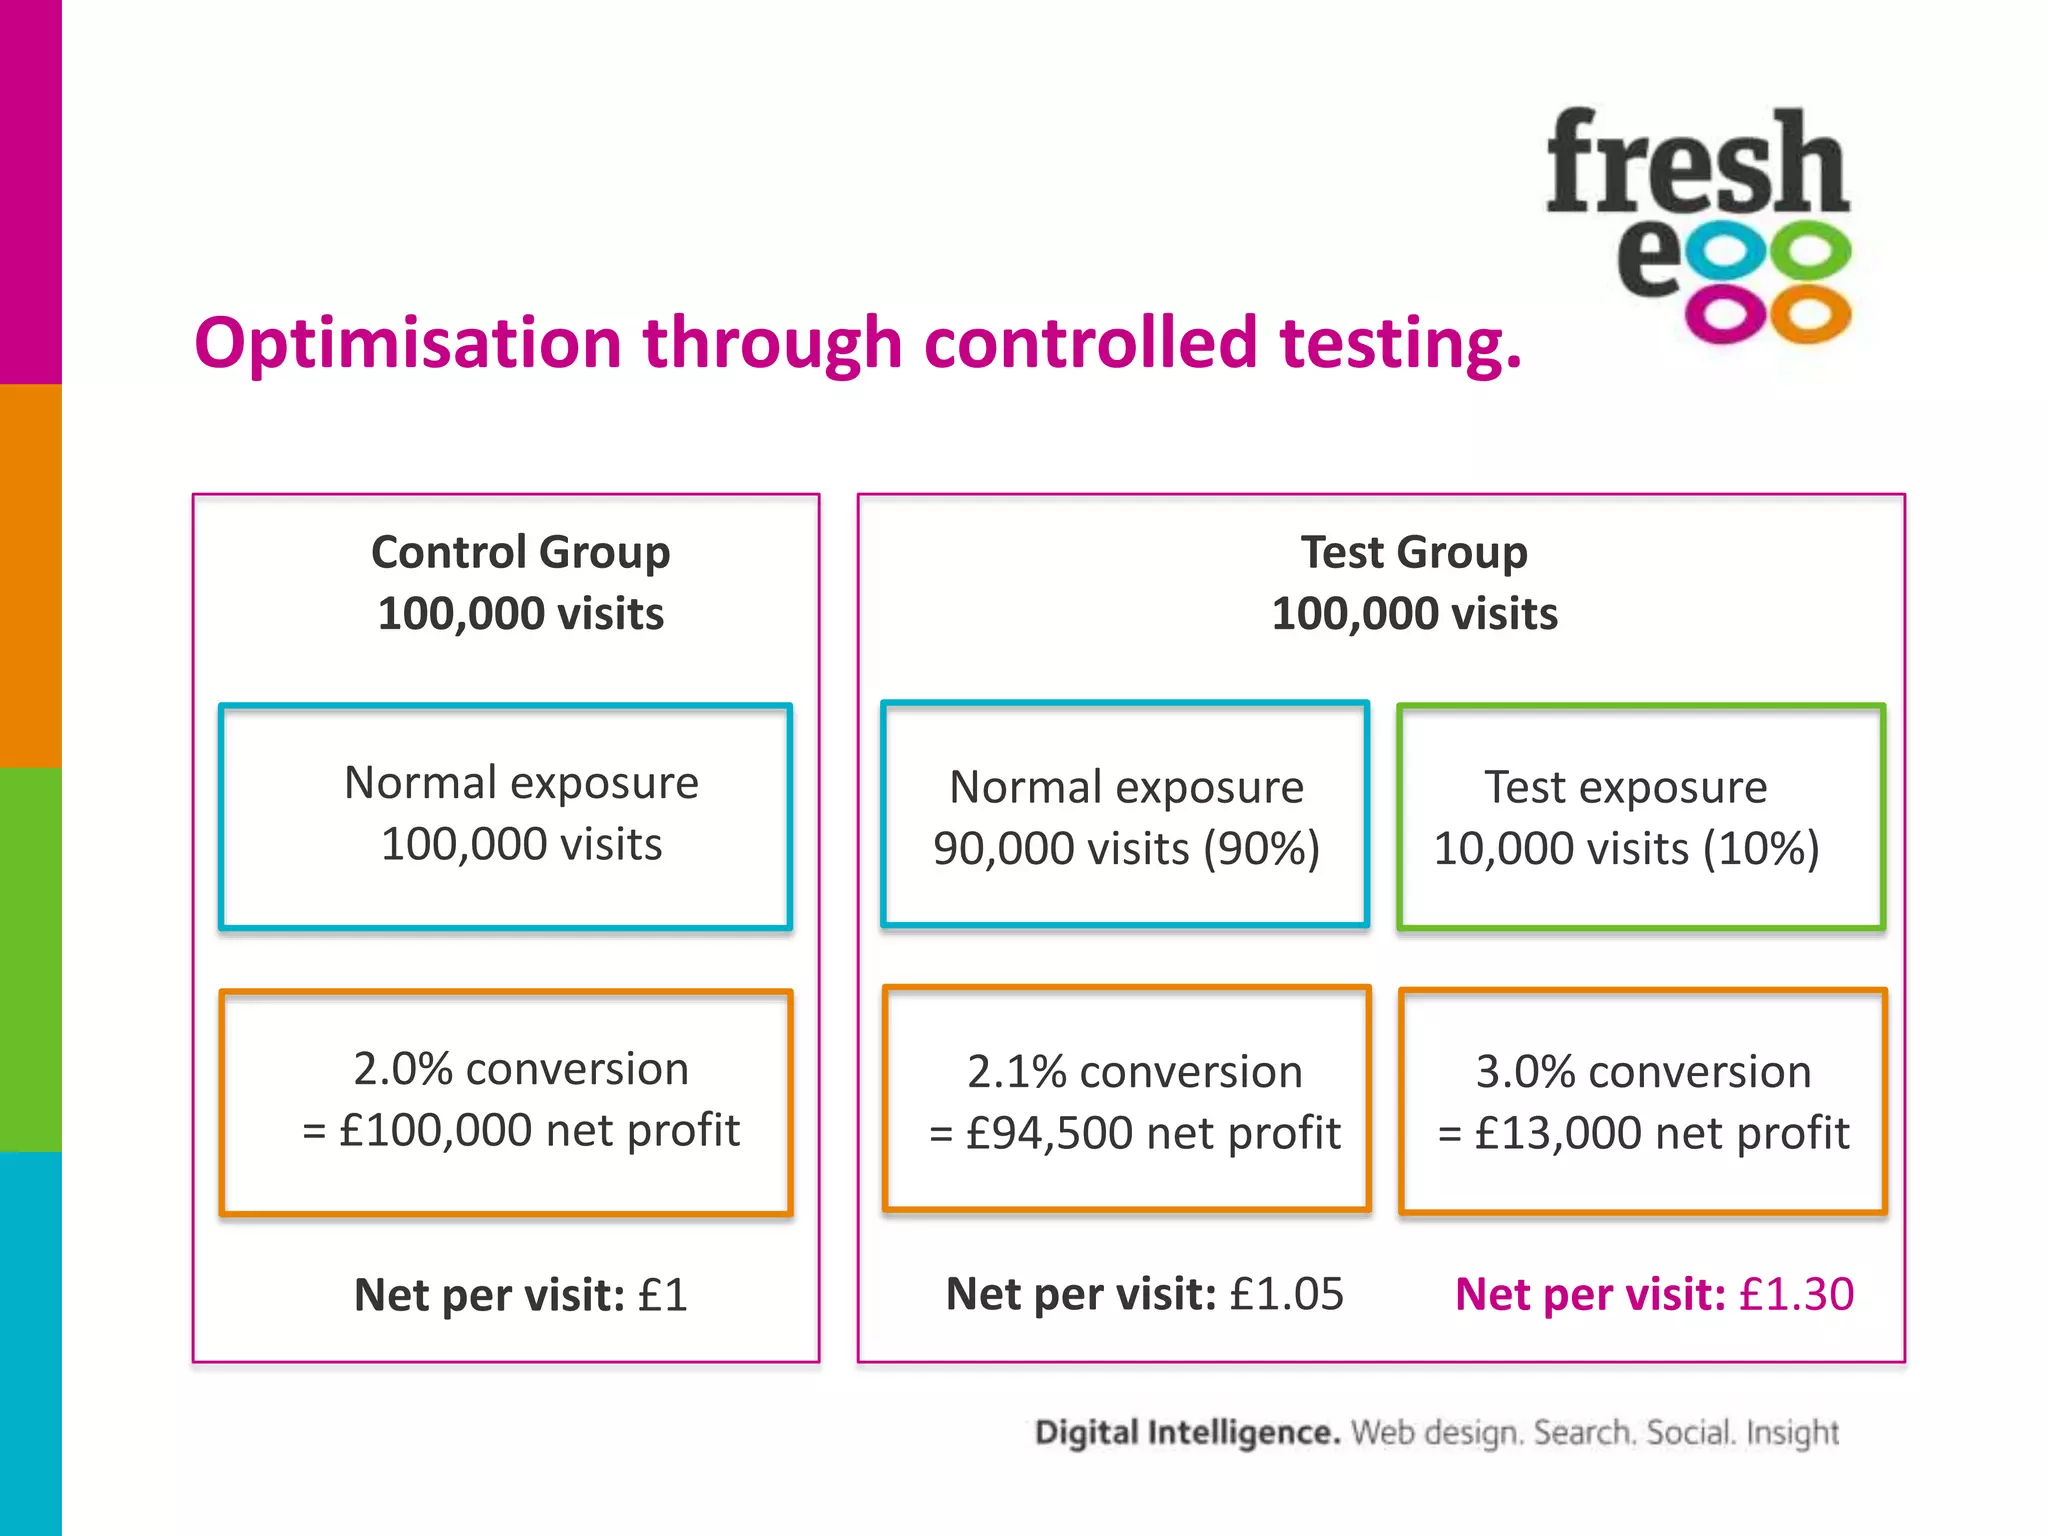
Presentation for MeasureFest about attribution tools available in GA, some general concerns about attribution and how it should be used to inform controlled tests, not as a retrospective tool only. Also focussing on lifetime value of customers (so included retention as well as acquisition)
11. Attribution Modelling Tool.
Linear
Credit split evenly across the entire conversion path.
Time Decay
Credit reduces back from the point of conversion.
Position Based
First & last click heavily weighted; remainder split in the middle.
13. Data-Driven Attribution (Premium only).
• Algorithmic models
• Includes non-converting paths
• Transparency for model behaviour
• Channel weights are based on
the impact that channel has on
conversion probability
• Data from AdWords, GDN, DFA
and cost import are available for
ROI analysis
14. Data-Driven Attribution (Premium only).
Prove value of upper funnel activity
The dash indicates this channel
did not appear in this path position
% reflects the overall weighting of a
channel at a particular position in the path
16. #1. Offline impact.
But purchase is
completed offline
Online campaign
drives awareness
Attribution =
17. #2. Cross-device purchase paths.
A single user…
Purchases on
home laptop
Compares prices
on work PC
Browses on mobile
en route to work
Attribution =
18. #3. The big issue.
Point of initial conversion
Acquisition
Display
Organic
CRM activity
PPC
Attribution focusses on acquisition only.
Email
Social
Retention is ignored.
It should focus on lifetime value impact.
Email
20. Optimisation through controlled testing.
• Audience profiling, segmentation and conversion path analysis inform
tests
• Testing is needed to determine causation. Customers predisposed to
purchase need to be separated from incremental effect of advertising
• Attribution tools don’t make decisions; they inform the tests that
determine decisions
21. Optimisation through controlled testing.
Control Group
100,000 visits
Test Group
100,000 visits
Normal exposure
100,000 visits
Normal exposure
90,000 visits (90%)
Test exposure
10,000 visits (10%)
2.0% conversion
= £100,000 net profit
2.1% conversion
= £94,500 net profit
3.0% conversion
= £13,000 net profit
Net per visit: £1
Net per visit: £1.05
Net per visit: £1.30
22. Optimisation through controlled testing.
• There are considerable challenges to this approach
• Splitting out test and control groups can be difficult and significant
samples are required
• The biggest issue is testing the impact of combinations of channels as it
is not easily possible to share targeting data across all channels.
• Remember testing should not be confined to acquisition channels but
should also apply to retention
24. Summary.
• Use MCF to better understand each channel’s role in conversion. Form
hypotheses for testing
• Don’t mix different activities together, e.g. email newsletters and sales emails.
Customise channel groupings in MCF as much as possible
• Don’t treat all conversions as equal. Look at paths for different conversion types
separately
• Split true and self-assists for each channel and look at total channel contribution
• Universal Analytics promises to greatly enhance possibilities for Customer
Lifetime Value (CLV) measurement and optimisation
• Run controlled tests to determine incremental value