Download to read offline


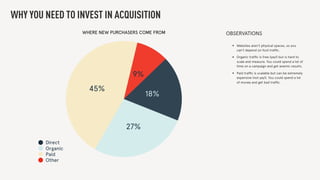
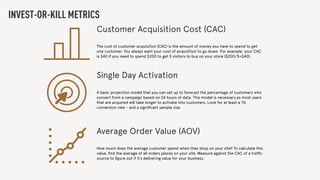
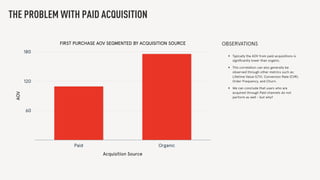


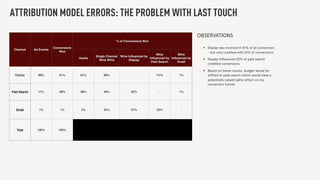
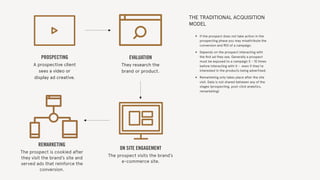
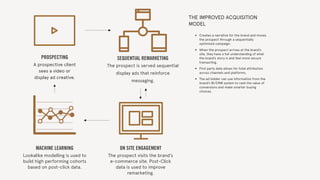


The document discusses the complexities of customer acquisition in e-commerce, highlighting the importance of understanding customer acquisition costs (CAC) and the effectiveness of different traffic sources. It critiques paid acquisition methods, noting lower average order values (AOV) and conversion rates compared to organic traffic. The document concludes with case studies demonstrating the benefits of using video content and sequential messaging to enhance brand storytelling and improve conversion rates.


