Download to read offline
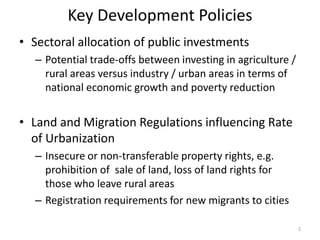
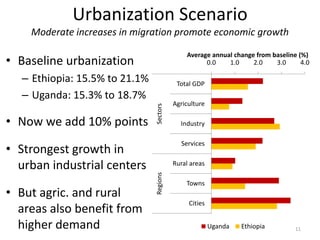
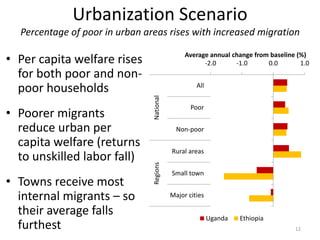
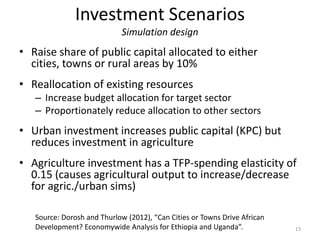
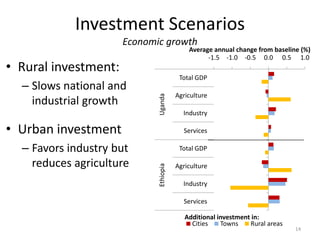
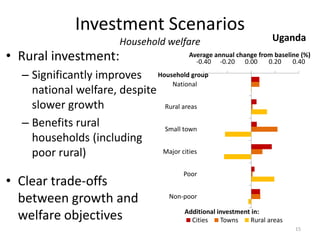

The document discusses the implications of development strategies in Africa, highlighting the trade-offs between investing in agriculture versus urban areas in terms of economic growth and poverty reduction. It presents a model simulation suggesting that while urban investments can enhance GDP growth, focusing on agricultural productivity yields greater poverty alleviation. The findings indicate that public investment choices in African economies must balance growth and equity, as urbanization can lead to an 'urbanization of poverty' if not supported with adequate investments.