Call Girls in Kashmiri Gate Delhi 💯Call Us 🔝8264348440🔝
Monroe County market report oct '12
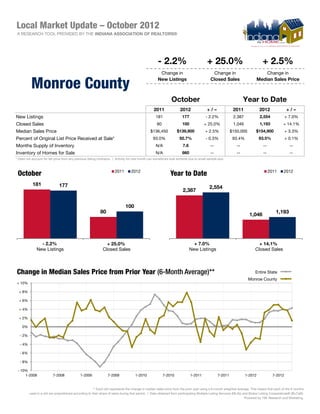
1. Local Market Update – October 2012
A RESEARCH TOOL PROVIDED BY THE INDIANA ASSOCIATION OF REALTORS®
- 2.2% + 25.0% + 2.5%
Change in Change in Change in
Monroe County New Listings Closed Sales Median Sales Price
October Year to Date
2011 2012 +/– 2011 2012 +/–
New Listings 181 177 - 2.2% 2,387 2,554 + 7.0%
Closed Sales 80 100 + 25.0% 1,046 1,193 + 14.1%
Median Sales Price $136,450 $139,900 + 2.5% $150,000 $154,900 + 3.3%
Percent of Original List Price Received at Sale* 93.0% 92.7% - 0.3% 93.4% 93.5% + 0.1%
Months Supply of Inventory N/A 7.6 -- -- -- --
Inventory of Homes for Sale N/A 860 -- -- -- --
* Does not account for list price from any previous listing contracts. | Activity for one month can sometimes look extreme due to small sample size.
2011 2012 2011 2012
October Year to Date
181 177 2,554
2,387
100
80 1,193
1,046
- 2.2% + 25.0% + 7.0% + 14.1%
New Listings Closed Sales New Listings Closed Sales
Change in Median Sales Price from Prior Year (6-Month Average)** Entire State b
Monroe County a
+ 10%
+ 8%
+ 6%
+ 4%
+ 2%
0%
- 2%
- 4%
- 6%
- 8%
- 10%
1-2008 7-2008 1-2009 7-2009 1-2010 7-2010 1-2011 7-2011 1-2012 7-2012
** Each dot represents the change in median sales price from the prior year using a 6-month weighted average. This means that each of the 6 months
used in a dot are proportioned according to their share of sales during that period. | Data obtained from participating Multiple Listing Services (MLSs) and Broker Listing Cooperatives® (BLCs®).
Powered by 10K Research and Marketing.
2. Local Market Update – October 2012
A RESEARCH TOOL PROVIDED BY THE INDIANA ASSOCIATION OF REALTORS®
+ 2.2% + 14.1% + 0.0%
Change in Change in Change in
Monroe County New Listings Closed Sales Median Sales Price
Last 3 Mos. Compared Last 3 Mos. Compared Last 3 Mos. Compared
to a Year Ago to a Year Ago to a Year Ago
Aug through Oct Nov through Oct
2011 2012 +/– 2011 2012 +/–
New Listings 581 594 + 2.2% 2,622 2,776 + 5.9%
Closed Sales 306 349 + 14.1% 1,194 1,355 + 13.5%
Median Sales Price $143,448 $143,500 + 0.0% $149,950 $151,750 + 1.2%
Percent of Original List Price Received at Sale* 92.8% 92.8% -0.1% 93.4% 93.0% -0.5%
* Does not account for list price from any previous listing contracts. | Activity for one month can sometimes look extreme due to small sample size.
2011 2012 2011 2012
Nov through Oct Aug through Oct
2,776
2,622 581 594
1,355 349
1,194 306
+ 5.9% + 13.5% + 2.2% + 14.1%
New Listings Closed Sales New Listings Closed Sales
Change in Median Sales Price from Prior Year (6-Month Average)** Entire State b
Monroe County a
+ 10%
+ 8%
+ 6%
+ 4%
+ 2%
0%
- 2%
- 4%
- 6%
- 8%
- 10%
1-2008 7-2008 1-2009 7-2009 1-2010 7-2010 1-2011 7-2011 1-2012 7-2012
** Each dot represents the change in median sales price from the prior year using a 6-month weighted average. This means that each of the 6 months
used in a dot are proportioned according to their share of sales during that period. | Data obtained from participating Multiple Listing Services (MLSs) and Broker Listing Cooperatives® (BLCs®).
Powered by 10K Research and Marketing.