SlideShare a Scribd company logo
1 of 1
Download to read offline
Vol. 11, No. 2 January 3, 2013
           The National Restaurant Association’s Restaurant Perfor-                                                                    NRA CURRENT SITUATION, EXPECTATIONS &
mance Index (RPI) improved slightly in November but failed to rise
above the 100 level which demarks expansion from contraction.
                                                                                                                                        COMPOSITE RESTAURANT PERFORMANCE
The benchmark Composite Index stood at 99.9 for the month, up from                                                        106.0
                                                                                                                                                      INDEXES
October’s 99.5 and but solidly below the 100.6 reported for one year                                                                                                                                  Current Situation Component
ago. Both components of the index improved in November with the                                                                                                                                       Expectations Component
                                                                                                                          104.0
Current Situation Index gaining 0.5 points to reach 99.8 and the expec-                                                                                                                               Restaurant Performance Index
tations index gaining 0.3 points to reach 100.0. Those figures compare
to 100.2 and 100.9, respectively, one year ago.                                                                           102.0
           November marks the fourth time in the past five months in
which the Current Situation Index has been below 100. We think the                                                        100.0
real question is whether the November gains are a reversal of the nega-
tive trend that has been in place since April or is another “head fake”
such as occurred in August when both index components made similar                                                          98.0
gains only to lose ground again in September and, even more dramati-
cally, in October. November’s Current Situation Index was supported                                                         96.0
by a sharp increase in same-store sales and customer traffic, both of
which rebounded from a disappointing October. The Same-Store Sales
                                                                                                                            94.0
index gained 2.1% to reach 102.5 in November while the Customer                                                                    J-03      J-04        J-05         J-06    J-07       J-08       J-09       J-10       J-11       J-12
Traffic component of 100.8 ws 1.9% higher for the month. Both com-                                                          Source: National Restaurant Association
ponents were still slightly lower than in November 2011.
           The Labor component, which measures numbers of employ-                                                        negative and, lo and behold, people may act have indeed reacted nega-
ees and hours worked and stood at 98.4 in November, was 0.1% lower                                                       tively. Funny how that works.
than in October. The big drag on the Current Situation was Capital                                                                  We still find it interesting that foodservice operators’ expecta-
Expenditures component which lost 1.8% to fall to 97.5. That figure is                                                   tions are so near their rating of current conditions. As you can see in
1.6% lower than one year ago and is at its lowest level since April 2010.                                                the chart, foodservice operators have, in general, been an optimistic lot
           The percentage of operators reporting gains in same-store                                                     with their expectations of performance running well ahead of their judg-
sales improved in November. Fifty-five percent (55%) said sales were                                                     ment of actual performance. And such was the case in both good times
higher than one year ago while only 30% reported lower sales. Those                                                      (judged by when the indexes were consistently above 100 from ‘04
numbers compare to 40% and 26%, respectively, in October. The Oc-                                                        through ‘06) and bad. But the past 18 months have seen the two com-
tober percentages were the worst reported for the entire year of 2012.                                                   ponent indexes track quite closely with one another and, if anything,
           Operators expectations for sales growth improved as well.                                                     grow closer since last summer. It doesn’t appear that foodservice oper-
The percentage of respondents expecting higher sales six months                                                          ators — or at least those surveyed for the index — are getting ahead of
hence grew from 31% in the November survey to 37% in December.                                                           the here and now.
The percentage expecting lower sales fell from 21% to 14%. While                                                                    One last musing — at least we hope it is the last one — on
improved, it should be noted that the December figures are still sharply                                                 Friday’s Hogs and Pigs report. We realize that slaughter is the only
worse than those from as recent as July when 50% expected higher                                                         output measure that actually gets counted and is, thus, the ultimate
sales in six months and 13% expected lower sales.                                                                        measure of how many hogs exist. It is also driven by the number of
           Finally, operators re still generally negative about the econom-                                              hogs born and surviving in some previous period. But differences be-
ic outlook for the net six months. The percentage expecting improve-                                                     tween the two flows (pigs being born and pigs being slaughtered in a
ment over that period (21%, up only 1% from November) is still much                                                      later time period) can be impacted by changes in the rates of flow.
lower than the percentage expecting worse conditions (36%, down 2%                                                                  We raise the question, of course, in light of USDA’s big revi-
form November). As recently as October more operators expected im-                                                       sion in the March-May pig crop (+636,000 head) last week. We realize
provement than expected worsening of conditions and the percentage                                                       that Sep-Nov slaughter was higher than normal but prolonged summer
were almost perfectly reversed as recently as June when 36% expected                                                     heat likely pushed some pigs from slaughter in August to slaughter in
improvement and 19% expected worse conditions.                                                                           September. In addition, producers’ well-documented efforts to reduce
           We think it is important to remember that these data were all                                                 feed expenditures by getting pigs to market earlier likely pulled pigs
collected during and shortly after a period when our political candidates                                                forward — including from December to November. The 636,000 head
were constantly trying to scare voters (who happen to also be consum-                                                    revision represents only 1.44 days worth of slaughter. Was the number
ers) just how awful things were in the U.S. — and how much worse                                                         of pigs farrowed in the spring quarter really larger or did they just flow to
things would get if the other side won the election. Combine that with                                                   slaughter differently? Part of that answer will lie in Dec-Feb slaughter
unemployment and disposable income levels that were in fact pretty                                                       relative to the Jun-Aug pig crop.


    The Daily Livestock Report is published by Steve Meyer and Len Steiner. To subscribe/unsubscribe visit www.dailylivestockreport.com.
    Disclaimer: The Daily Livestock Report is intended solely for information purposes and is not to be construed, under any circumstances, by implication or otherwise, as an offer to sell or a solicitation to buy or trade any
    commodities or securities whatsoever. Information is obtained from sources believed to be reliable, but is in no way guaranteed. No guarantee of any kind is implied or possible where projections of future conditions are
    attempted. Futures trading is not suitable for all investors, and involves the risk of loss. Past results are no indication of future performance. Futures are a leveraged investment, and because only a percentage of a con-
    tract’s value is require to trade, it is possible to lose more than the amount of money initially deposited for a futures position. Therefore, traders should only use funds that they can afford to lose without affecting their life-
    style. And only a portion of those funds should be devoted to any one trade because a trader cannot expect to profit on every trade.

    CME Group is the trademark of CME Group, Inc. The Globe logo, Globex® and CME® are trademarks of Chicago Mercantile Exchange, Inc. CBOT® is the trademark of the Board of Trade of the City of Chicago. NYMEX,
    New York Mercantile Exchange, and ClearPort are trademarks of New York Mercantile Exchange. Inc. COMEX is a trademark of Commodity Exchange, Inc. Copyright © 2013 CME Group. All rights reserved.

More Related Content

Similar to Daily livestock report jan 3 2013

Daily livestock report dec 18 2012
Daily livestock report dec 18 2012Daily livestock report dec 18 2012
Daily livestock report dec 18 2012joseleorcasita
 
Daily livestock report aug 1 2012
Daily livestock report aug 1 2012Daily livestock report aug 1 2012
Daily livestock report aug 1 2012joseleorcasita
 
Daily livestock report aug 1 2012
Daily livestock report aug 1 2012Daily livestock report aug 1 2012
Daily livestock report aug 1 2012joseleorcasita
 
Home Price Monitor: May 2011
Home Price Monitor: May 2011Home Price Monitor: May 2011
Home Price Monitor: May 2011REALTORS
 
Home Price Monitor: June 2011
Home Price Monitor: June 2011Home Price Monitor: June 2011
Home Price Monitor: June 2011REALTORS
 
Economic Risk Factor Update: December 2022 [SlideShare]
Economic Risk Factor Update: December 2022 [SlideShare]Economic Risk Factor Update: December 2022 [SlideShare]
Economic Risk Factor Update: December 2022 [SlideShare]Commonwealth
 
Daily livestock report dec 24 2012
Daily livestock report dec 24 2012Daily livestock report dec 24 2012
Daily livestock report dec 24 2012joseleorcasita
 
Daily livestock report feb 01 2013
Daily livestock report feb 01 2013Daily livestock report feb 01 2013
Daily livestock report feb 01 2013joseleorcasita
 
Economic Risk Factor Update: October 2022 [SlideShare]
Economic Risk Factor Update: October 2022 [SlideShare]Economic Risk Factor Update: October 2022 [SlideShare]
Economic Risk Factor Update: October 2022 [SlideShare]Commonwealth
 
Canadian leading indicators july2010 1
Canadian leading indicators july2010 1Canadian leading indicators july2010 1
Canadian leading indicators july2010 1Cynthia McGiverin
 
Home Price Monitor: July 2011
Home Price Monitor: July 2011Home Price Monitor: July 2011
Home Price Monitor: July 2011REALTORS
 
Daily livestock report mar 20 2013
Daily livestock report mar 20 2013Daily livestock report mar 20 2013
Daily livestock report mar 20 2013joseleorcasita
 
J.C. Williams Group National Retail Bulletin December 2008 Us
J.C. Williams Group National Retail Bulletin December 2008 UsJ.C. Williams Group National Retail Bulletin December 2008 Us
J.C. Williams Group National Retail Bulletin December 2008 Usjcwg
 

Similar to Daily livestock report jan 3 2013 (14)

K bank econ update feb 2011
K bank econ update feb 2011K bank econ update feb 2011
K bank econ update feb 2011
 
Daily livestock report dec 18 2012
Daily livestock report dec 18 2012Daily livestock report dec 18 2012
Daily livestock report dec 18 2012
 
Daily livestock report aug 1 2012
Daily livestock report aug 1 2012Daily livestock report aug 1 2012
Daily livestock report aug 1 2012
 
Daily livestock report aug 1 2012
Daily livestock report aug 1 2012Daily livestock report aug 1 2012
Daily livestock report aug 1 2012
 
Home Price Monitor: May 2011
Home Price Monitor: May 2011Home Price Monitor: May 2011
Home Price Monitor: May 2011
 
Home Price Monitor: June 2011
Home Price Monitor: June 2011Home Price Monitor: June 2011
Home Price Monitor: June 2011
 
Economic Risk Factor Update: December 2022 [SlideShare]
Economic Risk Factor Update: December 2022 [SlideShare]Economic Risk Factor Update: December 2022 [SlideShare]
Economic Risk Factor Update: December 2022 [SlideShare]
 
Daily livestock report dec 24 2012
Daily livestock report dec 24 2012Daily livestock report dec 24 2012
Daily livestock report dec 24 2012
 
Daily livestock report feb 01 2013
Daily livestock report feb 01 2013Daily livestock report feb 01 2013
Daily livestock report feb 01 2013
 
Economic Risk Factor Update: October 2022 [SlideShare]
Economic Risk Factor Update: October 2022 [SlideShare]Economic Risk Factor Update: October 2022 [SlideShare]
Economic Risk Factor Update: October 2022 [SlideShare]
 
Canadian leading indicators july2010 1
Canadian leading indicators july2010 1Canadian leading indicators july2010 1
Canadian leading indicators july2010 1
 
Home Price Monitor: July 2011
Home Price Monitor: July 2011Home Price Monitor: July 2011
Home Price Monitor: July 2011
 
Daily livestock report mar 20 2013
Daily livestock report mar 20 2013Daily livestock report mar 20 2013
Daily livestock report mar 20 2013
 
J.C. Williams Group National Retail Bulletin December 2008 Us
J.C. Williams Group National Retail Bulletin December 2008 UsJ.C. Williams Group National Retail Bulletin December 2008 Us
J.C. Williams Group National Retail Bulletin December 2008 Us
 

More from joseleorcasita

Inac boletin semanal 24082013
Inac boletin semanal 24082013Inac boletin semanal 24082013
Inac boletin semanal 24082013joseleorcasita
 
Bcr boletin informativo 23082013
Bcr boletin informativo 23082013Bcr boletin informativo 23082013
Bcr boletin informativo 23082013joseleorcasita
 
Bcr informativo semanal 19042013
Bcr informativo semanal 19042013Bcr informativo semanal 19042013
Bcr informativo semanal 19042013joseleorcasita
 
Inac boletin semanal 13042013
Inac boletin semanal 13042013Inac boletin semanal 13042013
Inac boletin semanal 13042013joseleorcasita
 
Daily livestock report apr 19 2013
Daily livestock report apr 19 2013Daily livestock report apr 19 2013
Daily livestock report apr 19 2013joseleorcasita
 
Daily livestock report apr 18 2013
Daily livestock report apr 18 2013Daily livestock report apr 18 2013
Daily livestock report apr 18 2013joseleorcasita
 
Daily livestock report apr 17 2013
Daily livestock report apr 17 2013Daily livestock report apr 17 2013
Daily livestock report apr 17 2013joseleorcasita
 
Daily livestock report apr 16 2013
Daily livestock report apr 16 2013Daily livestock report apr 16 2013
Daily livestock report apr 16 2013joseleorcasita
 
Daily livestock report apr 15 2013
Daily livestock report apr 15 2013Daily livestock report apr 15 2013
Daily livestock report apr 15 2013joseleorcasita
 
Usda report april 2013
Usda report april 2013Usda report april 2013
Usda report april 2013joseleorcasita
 
Daily livestock report apr 12 2013
Daily livestock report apr 12 2013Daily livestock report apr 12 2013
Daily livestock report apr 12 2013joseleorcasita
 
Daily livestock report apr 11 2013
Daily livestock report apr 11 2013Daily livestock report apr 11 2013
Daily livestock report apr 11 2013joseleorcasita
 
Daily livestock report apr 10 2013
Daily livestock report apr 10 2013Daily livestock report apr 10 2013
Daily livestock report apr 10 2013joseleorcasita
 

More from joseleorcasita (20)

Bcr boletin 06092013
Bcr boletin 06092013Bcr boletin 06092013
Bcr boletin 06092013
 
Inac boletin 31082013
Inac boletin 31082013Inac boletin 31082013
Inac boletin 31082013
 
Boletim do leite 221
Boletim do leite 221Boletim do leite 221
Boletim do leite 221
 
Boletim do leite 220
Boletim do leite 220Boletim do leite 220
Boletim do leite 220
 
Boletim do leite 219
Boletim do leite 219Boletim do leite 219
Boletim do leite 219
 
Boletim do leite 218
Boletim do leite 218Boletim do leite 218
Boletim do leite 218
 
Boletim do leite 217
Boletim do leite 217Boletim do leite 217
Boletim do leite 217
 
Inac boletin semanal 24082013
Inac boletin semanal 24082013Inac boletin semanal 24082013
Inac boletin semanal 24082013
 
Bcr boletin informativo 23082013
Bcr boletin informativo 23082013Bcr boletin informativo 23082013
Bcr boletin informativo 23082013
 
Bcr informativo semanal 19042013
Bcr informativo semanal 19042013Bcr informativo semanal 19042013
Bcr informativo semanal 19042013
 
Inac boletin semanal 13042013
Inac boletin semanal 13042013Inac boletin semanal 13042013
Inac boletin semanal 13042013
 
Daily livestock report apr 19 2013
Daily livestock report apr 19 2013Daily livestock report apr 19 2013
Daily livestock report apr 19 2013
 
Daily livestock report apr 18 2013
Daily livestock report apr 18 2013Daily livestock report apr 18 2013
Daily livestock report apr 18 2013
 
Daily livestock report apr 17 2013
Daily livestock report apr 17 2013Daily livestock report apr 17 2013
Daily livestock report apr 17 2013
 
Daily livestock report apr 16 2013
Daily livestock report apr 16 2013Daily livestock report apr 16 2013
Daily livestock report apr 16 2013
 
Daily livestock report apr 15 2013
Daily livestock report apr 15 2013Daily livestock report apr 15 2013
Daily livestock report apr 15 2013
 
Usda report april 2013
Usda report april 2013Usda report april 2013
Usda report april 2013
 
Daily livestock report apr 12 2013
Daily livestock report apr 12 2013Daily livestock report apr 12 2013
Daily livestock report apr 12 2013
 
Daily livestock report apr 11 2013
Daily livestock report apr 11 2013Daily livestock report apr 11 2013
Daily livestock report apr 11 2013
 
Daily livestock report apr 10 2013
Daily livestock report apr 10 2013Daily livestock report apr 10 2013
Daily livestock report apr 10 2013
 

Daily livestock report jan 3 2013

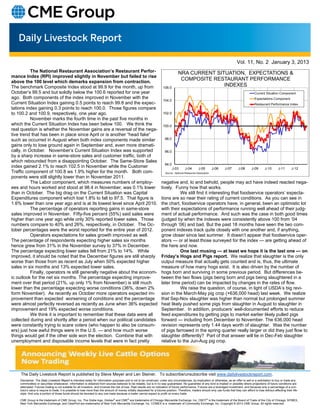
  • 1. Vol. 11, No. 2 January 3, 2013 The National Restaurant Association’s Restaurant Perfor- NRA CURRENT SITUATION, EXPECTATIONS & mance Index (RPI) improved slightly in November but failed to rise above the 100 level which demarks expansion from contraction. COMPOSITE RESTAURANT PERFORMANCE The benchmark Composite Index stood at 99.9 for the month, up from 106.0 INDEXES October’s 99.5 and but solidly below the 100.6 reported for one year Current Situation Component ago. Both components of the index improved in November with the Expectations Component 104.0 Current Situation Index gaining 0.5 points to reach 99.8 and the expec- Restaurant Performance Index tations index gaining 0.3 points to reach 100.0. Those figures compare to 100.2 and 100.9, respectively, one year ago. 102.0 November marks the fourth time in the past five months in which the Current Situation Index has been below 100. We think the 100.0 real question is whether the November gains are a reversal of the nega- tive trend that has been in place since April or is another “head fake” such as occurred in August when both index components made similar 98.0 gains only to lose ground again in September and, even more dramati- cally, in October. November’s Current Situation Index was supported 96.0 by a sharp increase in same-store sales and customer traffic, both of which rebounded from a disappointing October. The Same-Store Sales 94.0 index gained 2.1% to reach 102.5 in November while the Customer J-03 J-04 J-05 J-06 J-07 J-08 J-09 J-10 J-11 J-12 Traffic component of 100.8 ws 1.9% higher for the month. Both com- Source: National Restaurant Association ponents were still slightly lower than in November 2011. The Labor component, which measures numbers of employ- negative and, lo and behold, people may act have indeed reacted nega- ees and hours worked and stood at 98.4 in November, was 0.1% lower tively. Funny how that works. than in October. The big drag on the Current Situation was Capital We still find it interesting that foodservice operators’ expecta- Expenditures component which lost 1.8% to fall to 97.5. That figure is tions are so near their rating of current conditions. As you can see in 1.6% lower than one year ago and is at its lowest level since April 2010. the chart, foodservice operators have, in general, been an optimistic lot The percentage of operators reporting gains in same-store with their expectations of performance running well ahead of their judg- sales improved in November. Fifty-five percent (55%) said sales were ment of actual performance. And such was the case in both good times higher than one year ago while only 30% reported lower sales. Those (judged by when the indexes were consistently above 100 from ‘04 numbers compare to 40% and 26%, respectively, in October. The Oc- through ‘06) and bad. But the past 18 months have seen the two com- tober percentages were the worst reported for the entire year of 2012. ponent indexes track quite closely with one another and, if anything, Operators expectations for sales growth improved as well. grow closer since last summer. It doesn’t appear that foodservice oper- The percentage of respondents expecting higher sales six months ators — or at least those surveyed for the index — are getting ahead of hence grew from 31% in the November survey to 37% in December. the here and now. The percentage expecting lower sales fell from 21% to 14%. While One last musing — at least we hope it is the last one — on improved, it should be noted that the December figures are still sharply Friday’s Hogs and Pigs report. We realize that slaughter is the only worse than those from as recent as July when 50% expected higher output measure that actually gets counted and is, thus, the ultimate sales in six months and 13% expected lower sales. measure of how many hogs exist. It is also driven by the number of Finally, operators re still generally negative about the econom- hogs born and surviving in some previous period. But differences be- ic outlook for the net six months. The percentage expecting improve- tween the two flows (pigs being born and pigs being slaughtered in a ment over that period (21%, up only 1% from November) is still much later time period) can be impacted by changes in the rates of flow. lower than the percentage expecting worse conditions (36%, down 2% We raise the question, of course, in light of USDA’s big revi- form November). As recently as October more operators expected im- sion in the March-May pig crop (+636,000 head) last week. We realize provement than expected worsening of conditions and the percentage that Sep-Nov slaughter was higher than normal but prolonged summer were almost perfectly reversed as recently as June when 36% expected heat likely pushed some pigs from slaughter in August to slaughter in improvement and 19% expected worse conditions. September. In addition, producers’ well-documented efforts to reduce We think it is important to remember that these data were all feed expenditures by getting pigs to market earlier likely pulled pigs collected during and shortly after a period when our political candidates forward — including from December to November. The 636,000 head were constantly trying to scare voters (who happen to also be consum- revision represents only 1.44 days worth of slaughter. Was the number ers) just how awful things were in the U.S. — and how much worse of pigs farrowed in the spring quarter really larger or did they just flow to things would get if the other side won the election. Combine that with slaughter differently? Part of that answer will lie in Dec-Feb slaughter unemployment and disposable income levels that were in fact pretty relative to the Jun-Aug pig crop. The Daily Livestock Report is published by Steve Meyer and Len Steiner. To subscribe/unsubscribe visit www.dailylivestockreport.com. Disclaimer: The Daily Livestock Report is intended solely for information purposes and is not to be construed, under any circumstances, by implication or otherwise, as an offer to sell or a solicitation to buy or trade any commodities or securities whatsoever. Information is obtained from sources believed to be reliable, but is in no way guaranteed. No guarantee of any kind is implied or possible where projections of future conditions are attempted. Futures trading is not suitable for all investors, and involves the risk of loss. Past results are no indication of future performance. Futures are a leveraged investment, and because only a percentage of a con- tract’s value is require to trade, it is possible to lose more than the amount of money initially deposited for a futures position. Therefore, traders should only use funds that they can afford to lose without affecting their life- style. And only a portion of those funds should be devoted to any one trade because a trader cannot expect to profit on every trade. CME Group is the trademark of CME Group, Inc. The Globe logo, Globex® and CME® are trademarks of Chicago Mercantile Exchange, Inc. CBOT® is the trademark of the Board of Trade of the City of Chicago. NYMEX, New York Mercantile Exchange, and ClearPort are trademarks of New York Mercantile Exchange. Inc. COMEX is a trademark of Commodity Exchange, Inc. Copyright © 2013 CME Group. All rights reserved.