SlideShare a Scribd company logo
Vol. 10, No. 158 / July 16, 2012

Market Comments                                                                                                                                        US TOTAL COW SLAUGHTER, 000 HEAD
                                                                                                                                                                Data through Week Ending June 30, 2012
                                                                                                                           160.0


Cattle: Total cattle slaughter for the week was 641,000 head,                                                              150.0
almost 12% higher than the previous week (holiday week) but still
about 4.7% lower than a year ago. Lower fed cattle slaughter has                                                           140.0

offset an increase in cow numbers. As pastures across much of the
                                                                                                                           130.0
central US continue to dry up, more cows are starting to show up.
The official USDA data on cow slaughter is reported with a two                                                             120.0
week lag and it continues to show cow slaughter below year ago
levels (see chart). However, estimated cow slaughter for the week                                                          110.0

ending July 14 is about 3% higher than a year ago. USDA last
                                                                                                                           100.0
week reported that half of all US pastures are in poor or very
poor condition. While the situation in Texas and Oklahoma is a                                                              90.0
bit better than it was last year, it is still far from ideal. Missouri                                                                           2007-11 Avg.             2011             2012
ratings show 86% of pastures there in poor or very poor condition.                                                          80.0
                                                                                                                                   Jan    Feb     Mar      Apr      May       Jun    Jul      Aug     Sep      Oct     Nov      Dec
Generally pasture conditions deteriorate throughout the summer
and the outlook so far is for current drought conditions to persist.
This will continue to pressure cow-calf operators and push more
                                                                                                                                                       US TOTAL SOW SLAUGHTER, 000 HEAD
cows to market. Even more important for cow-calf operators, how-                                                                                                Data through Week Ending June 30, 2012
ever, is the outlook for calf prices next year. Data shows that feed-                                                      75.0

er cattle prices have a more pronounced impact on cow slaughter                                                                                2007-11 Avg.            2011            2012

than pasture conditions. Feeder cattle futures have dropped al-                                                            70.0

most $20/cwt in the last four weeks as corn, DDG and soybean
meal values have skyrocketed. Current corn cash price (Omaha                                                               65.0

Basis) is near $7.5 per bushel, soybean meal is up 36% from last
                                                                                                                           60.0
year at 474 per ton and DDGs are also up 35% (see table on page
2). Hay prices continue to also hit new highs with national alfalfa
                                                                                                                           55.0
price in June up 12% over last year. Wide range of prices for hay,
with high quality alfalfa fetching over 300 per ton in some areas.
                                                                                                                           50.0
Some areas, like Missouri, are seeing farmers feeding hay to re-
maining livestock while feedlots are struggling with least cost for-
                                                                                                                           45.0
mulations given the simultaneous rise in just about all feedstock.
                                                                                                                           40.0
Hogs: Sharp rise in feed costs and softer wholesale pork prices                                                                   Jan    Feb     Mar      Apr      May      Jun      Jul      Aug     Sep      Oct      Nov     Dec
may be pushing more sows to market. As with cows, we are look-
ing at data that is about two weeks old. However, the weekly sow                                                          negatively impacted carcass values. High temperatures across
prices tell the story. Light sow prices have declined about $4/cwt                                                        the country appear to have limited grilling demand, with prices
or 8% in the last 10 days while heavier and better quality sow val-                                                       for ribs and loins down sharply this week. Weak wholesale val-
ues are down about 3% during the same period. The IA/MN aver-                                                             ues had packers taking a wait and see approach. Pork exports
age hog carcass price for the week was quoted at $96.34/cwt, about                                                        have been good through May but it will be difficult to match the
3% lower than the week before. Hog prices were under pressure                                                             pace of the second half of 2011. Reports indicating that China
all week and on Friday values closed at $91.86, down about 8%                                                             pork production in Jan - Jun period of 2012 was up 6% from last
from where they started the week last Monday. While belly prices                                                          year.
remain firm, weakness in a number of retail grilling items has


     The Daily Livestock Report is published by Steve Meyer and Len Steiner. To subscribe/unsubscribe visit www.dailylivestockreport.com.
     Disclaimer: The Daily Livestock Report is intended solely for information purposes and is not to be construed, under any circumstances, by implication or otherwise, as an offer to sell or a solicitation to buy or trade any
     commodities or securities whatsoever. Information is obtained from sources believed to be reliable, but is in no way guaranteed. No guarantee of any kind is implied or possible where projections of future conditions are
     attempted. Futures trading is not suitable for all investors, and involves the risk of loss. Past results are no indication of future performance. Futures are a leveraged investment, and because only a percentage of a con-
     tract’s value is require to trade, it is possible to lose more than the amount of money initially deposited for a futures position. Therefore, traders should only use funds that they can afford to lose without affecting their life-
     style. And only a portion of those funds should be devoted to any one trade because a trader cannot expect to profit on every trade.


     CME Group is the trademark of CME Group, Inc. The Globe logo, Globex® and CME® are trademarks of Chicago Mercantile Exchange, Inc. CBOT® is the trademark of the Board of Trade of the City of Chicago. NYMEX,
     New York Mercantile Exchange, and ClearPort are trademarks of New York Mercantile Exchange. Inc. COMEX is a trademark of Commodity Exchange, Inc. Copyright © 2011 CME Group. All rights reserved.
Page 2


                                                                                                                              Vol. 10, No. 158 / July 16, 2012

PRODUCTION & PRICE SUMMARY                                                                                 Week Ending                 7/14/2012
                                                            Current                       Pct.                       Pct.                 Y/Y %    Last 52      Pct.
     Item                              Units                  Week Last Week            Change     Last Year       Change       YTD      Change     Weeks     Change
                                                            14-Jul-12     7-Jul-12                     16-Jul-11


     Total Red Meat & Poultry          mil lbs., cwe            1,608        1,623        -0.90%           1,635    -1.61%    46,135       10.3%    87,668     10.5%

     FI Slaughter                      Thou. Head                641           574        11.67%            673     -4.68%    17,293       -4.4%    32,745      -2.8%
 C   FI Cow Slaughter **               Thou. Head                116           115         1.22%            125     -7.41%     3,087       -3.5%     6,599       2.1%
 A   Avg. Live Weight                  Lbs.                     1303          1299         0.31%           1272      2.44%     1,296        1.7%     1,291       0.6%
 T   Avg. Dressed Weight               Lbs.                      791           787         0.51%            775      2.06%       785        1.9%       781       0.7%
 T   Beef Production                   Million Lbs.            505.9         451.0        12.17%          519.0     -2.52%    13,545       -2.5%    25,501      -2.0%
 L   Live Fed Steer Price              $ per cwt              114.69        117.11        -2.07%         110.93      3.39%
 E   Dressed Fed Steer Price           $ per cwt              182.16        187.03        -2.60%         178.56      2.02%
     OKC Feeder Steer, 600-700         $ per cwt                 N/A        159.50           N/A         144.88        N/A
 &   Choice Beef Cutout                $ per cwt              187.33        193.52        -3.20%         180.86      3.58%
     Hide/Offal                        $ per cwt, live wt      13.17         12.95         1.70%          13.69     -3.80%
 B   Rib, Choice                       $ per cwt              278.67        296.57        -6.04%         259.36      7.45%
 E   Round, Choice                     $ per cwt              156.80        154.85         1.26%         154.65      1.39%
 E   Chuck, Choice                     $ per cwt              141.93        144.29        -1.64%         145.80     -2.65%
 F   Trimmings, 50%                    $ per cwt               49.19         49.99        -1.60%          82.81    -40.60%
     Trimmings, 90%                    $ per cwt              219.00        219.68        -0.31%         184.71     18.56%
     FI Slaughter                      Thou. Head              1,959         1,755        11.62%          2,024     -3.20%    58,059        1.4%   110,740      1.7%
     FI Sow Slaughter **               Thou. Head               56.0          57.1        -1.96%           59.6     -6.00%     1,450       -1.9%     2,999      1.2%
 H   Avg. Dressed Weight               Lbs.                    204.0         205.0        -0.49%          202.0      0.99%       208        0.4%       206      0.1%
 O   Pork Production                   Million Lbs.            400.1         360.2        11.08%          410.2     -2.46%    12,061        1.8%    22,815      1.9%
 G   Iowa-S. Minn. Direct              Wtd. Avg.               96.34         99.33        -3.01%          92.43      4.23%
 S   Natl. Base Carcass Price          Wtd. Avg.               95.87         97.02        -1.19%          91.53      4.74%
     Natl. Net Carcass Price           Wtd. Avg.               98.43         99.69        -1.26%          94.38      4.29%
     Pork Cutout                       185 Lbs.                89.61         91.54        -2.11%          98.22     -8.77%
     Hams                              $ per cwt               71.94         72.13        -0.26%          79.73     -9.77%
     Loins                             $ per cwt               99.36        102.88        -3.42%         114.12    -12.93%
     Bellies                           $ per cwt              134.52        132.89         1.23%         129.58      3.81%
 C   Young Chicken Slaughter *         Million Head            142.7         160.8       -11.28%          145.1     -1.62%     4,089       -5.1%     7,866      -5.6%
 H   Avg. Weight (Live)                Lbs.                     5.65          5.75        -1.74%           5.66     -0.18%      5.73        0.0%      5.73       0.6%
 I   Chicken Production (RTC)          Million Lbs.            608.7         698.3       -12.83%          611.7     -0.48%    17,632       -4.2%    33,821      -4.3%
 C   Eggs Set                          Million                 194.1         196.3        -1.11%          195.0     -0.44%     5,324       -4.0%    10,089      -5.3%
 K   Chicks Placed                     Million Head            163.2         165.7        -1.54%          166.0     -1.68%     4,437       -3.4%     8,401      -4.5%
 E   12-City Broiler Price             Composite               83.36         82.47         1.08%          79.85      4.40%
 N   Georgia Dock Broiler Price        2.5-3 Lbs.               93.9         93.81         0.10%          85.88      9.34%
     Northeast Breast, B/S             $/cwt                  137.42        136.08         0.98%         118.61     15.86%
     Northeast Legs                    $/cwt                   64.46         69.43        -7.16%          62.85      2.56%
 T   Young Turkey Slaughter *          Million Head            3.919         4.694       -16.51%          3.988     -1.73%   117.666       -0.3%   230.500      -1.4%
 U   Avg. Live Weight                  Lbs.                    29.85         30.21        -1.19%           29.4      1.53%     30.12       -0.3%     30.08       1.8%
 R   Turkey Production (RTC)           Million Lbs.             93.5         113.4       -17.53%           93.8     -0.26%     2,897        1.9%     5,531       0.7%
 K   Eastern Region Hen Price          8-16 Lbs.              106.10        106.50        -0.38%         104.00      2.02%
 G   Corn, Omaha                       $ per Bushel             7.44          7.42         0.27%           7.29      2.06%
 R   DDGs, Minnesota                   $ per Ton              242.50        230.00         5.43%         180.00     34.72%
 A   Wheat, Kansas City                $ per Bushel             8.23          7.94         3.65%           7.45     10.47%
 I   Soybeans, S. Iowa                 $ per Bushel            16.19         16.19         0.00%          14.08     14.99%
 N   Soybn Meal, 48% Decatur           $ per Ton              473.70        476.80        -0.65%         348.50     35.93%
* Chicken & turkey slaughter & production are 1 week earlier than the date at the top of this sheet.
** Cow and sow slaughter reflect levels from two weeks ago due to reporting lag.

More Related Content

What's hot

Daily livestock report oct 16 2012
Daily livestock report oct 16 2012Daily livestock report oct 16 2012
Daily livestock report oct 16 2012joseleorcasita
 
Daily livestock report sep 20 2012
Daily livestock report sep 20 2012Daily livestock report sep 20 2012
Daily livestock report sep 20 2012joseleorcasita
 
Daily livestock report july 20 2012
Daily livestock report july 20 2012Daily livestock report july 20 2012
Daily livestock report july 20 2012joseleorcasita
 
Daily livestock report oct 8 2012
Daily livestock report oct 8 2012Daily livestock report oct 8 2012
Daily livestock report oct 8 2012joseleorcasita
 
Daily livestock report sep 19 2012
Daily livestock report sep 19 2012Daily livestock report sep 19 2012
Daily livestock report sep 19 2012joseleorcasita
 
Daily livestock report dec 4 2012
Daily livestock report dec 4 2012Daily livestock report dec 4 2012
Daily livestock report dec 4 2012joseleorcasita
 
Daily livestock report sep 24 2012
Daily livestock report sep 24 2012Daily livestock report sep 24 2012
Daily livestock report sep 24 2012joseleorcasita
 
Daily livestock report mar 20 2013
Daily livestock report mar 20 2013Daily livestock report mar 20 2013
Daily livestock report mar 20 2013joseleorcasita
 
Daily livestock report oct 25 2012
Daily livestock report oct 25 2012Daily livestock report oct 25 2012
Daily livestock report oct 25 2012joseleorcasita
 
Daily livestock report apr 18 2013
Daily livestock report apr 18 2013Daily livestock report apr 18 2013
Daily livestock report apr 18 2013joseleorcasita
 
Daily livestock report mar 27 2013
Daily livestock report mar 27 2013Daily livestock report mar 27 2013
Daily livestock report mar 27 2013joseleorcasita
 
Daily livestock report mar 25 2013
Daily livestock report mar 25 2013Daily livestock report mar 25 2013
Daily livestock report mar 25 2013joseleorcasita
 
Research Paper
Research PaperResearch Paper
Research PaperSarah Lux
 
Daily livestock report feb 13 2013
Daily livestock report feb 13 2013Daily livestock report feb 13 2013
Daily livestock report feb 13 2013joseleorcasita
 
Daily livestock report apr 01 2013
Daily livestock report apr 01 2013Daily livestock report apr 01 2013
Daily livestock report apr 01 2013joseleorcasita
 
Daily livestock report nov 23 2012
Daily livestock report nov 23 2012Daily livestock report nov 23 2012
Daily livestock report nov 23 2012joseleorcasita
 
Daily livestock report dec 18 2012
Daily livestock report dec 18 2012Daily livestock report dec 18 2012
Daily livestock report dec 18 2012joseleorcasita
 
Daily livestock report jan 28 2013
Daily livestock report jan 28 2013Daily livestock report jan 28 2013
Daily livestock report jan 28 2013joseleorcasita
 

What's hot (20)

Daily livestock report oct 16 2012
Daily livestock report oct 16 2012Daily livestock report oct 16 2012
Daily livestock report oct 16 2012
 
Daily livestock report sep 20 2012
Daily livestock report sep 20 2012Daily livestock report sep 20 2012
Daily livestock report sep 20 2012
 
Daily livestock report july 20 2012
Daily livestock report july 20 2012Daily livestock report july 20 2012
Daily livestock report july 20 2012
 
Daily livestock report oct 8 2012
Daily livestock report oct 8 2012Daily livestock report oct 8 2012
Daily livestock report oct 8 2012
 
Daily livestock report sep 19 2012
Daily livestock report sep 19 2012Daily livestock report sep 19 2012
Daily livestock report sep 19 2012
 
Daily livestock report dec 4 2012
Daily livestock report dec 4 2012Daily livestock report dec 4 2012
Daily livestock report dec 4 2012
 
Daily livestock report sep 24 2012
Daily livestock report sep 24 2012Daily livestock report sep 24 2012
Daily livestock report sep 24 2012
 
Daily livestock report mar 20 2013
Daily livestock report mar 20 2013Daily livestock report mar 20 2013
Daily livestock report mar 20 2013
 
Daily livestock report oct 25 2012
Daily livestock report oct 25 2012Daily livestock report oct 25 2012
Daily livestock report oct 25 2012
 
Daily livestock report apr 18 2013
Daily livestock report apr 18 2013Daily livestock report apr 18 2013
Daily livestock report apr 18 2013
 
Daily livestock report mar 27 2013
Daily livestock report mar 27 2013Daily livestock report mar 27 2013
Daily livestock report mar 27 2013
 
Daily livestock report mar 25 2013
Daily livestock report mar 25 2013Daily livestock report mar 25 2013
Daily livestock report mar 25 2013
 
Research Paper
Research PaperResearch Paper
Research Paper
 
Daily livestock report feb 13 2013
Daily livestock report feb 13 2013Daily livestock report feb 13 2013
Daily livestock report feb 13 2013
 
Ldp m august 2012
Ldp m august 2012Ldp m august 2012
Ldp m august 2012
 
Daily livestock report apr 01 2013
Daily livestock report apr 01 2013Daily livestock report apr 01 2013
Daily livestock report apr 01 2013
 
Daily livestock report nov 23 2012
Daily livestock report nov 23 2012Daily livestock report nov 23 2012
Daily livestock report nov 23 2012
 
Daily livestock report dec 18 2012
Daily livestock report dec 18 2012Daily livestock report dec 18 2012
Daily livestock report dec 18 2012
 
Ldp m september 2012
Ldp m september 2012Ldp m september 2012
Ldp m september 2012
 
Daily livestock report jan 28 2013
Daily livestock report jan 28 2013Daily livestock report jan 28 2013
Daily livestock report jan 28 2013
 

Similar to Daily livestock report no.158

Daily livestock report mar 28 2013
Daily livestock report mar 28 2013Daily livestock report mar 28 2013
Daily livestock report mar 28 2013joseleorcasita
 
Daily livestock report july 18 2012
Daily livestock report july 18 2012Daily livestock report july 18 2012
Daily livestock report july 18 2012joseleorcasita
 
Daily livestock report aug 10 2012
Daily livestock report aug 10 2012Daily livestock report aug 10 2012
Daily livestock report aug 10 2012joseleorcasita
 
Daily livestock report feb 25 2013
Daily livestock report feb 25 2013Daily livestock report feb 25 2013
Daily livestock report feb 25 2013joseleorcasita
 
Daily livestock report feb 22 2013
Daily livestock report feb 22 2013Daily livestock report feb 22 2013
Daily livestock report feb 22 2013joseleorcasita
 
Daily livestock report sep 10 2012
Daily livestock report sep 10 2012Daily livestock report sep 10 2012
Daily livestock report sep 10 2012joseleorcasita
 
Daily livestock report sep 10 2012
Daily livestock report sep 10 2012Daily livestock report sep 10 2012
Daily livestock report sep 10 2012joseleorcasita
 
Daily livestock report jan 10 2013
Daily livestock report jan 10 2013Daily livestock report jan 10 2013
Daily livestock report jan 10 2013joseleorcasita
 
Daily livestock report feb 14 2013
Daily livestock report feb 14 2013Daily livestock report feb 14 2013
Daily livestock report feb 14 2013joseleorcasita
 
Daily livestock report aug 22 2012
Daily livestock report aug 22 2012Daily livestock report aug 22 2012
Daily livestock report aug 22 2012joseleorcasita
 
Daily livestock report apr 17 2013
Daily livestock report apr 17 2013Daily livestock report apr 17 2013
Daily livestock report apr 17 2013joseleorcasita
 
Daily livestock report apr 03 2013
Daily livestock report apr 03 2013Daily livestock report apr 03 2013
Daily livestock report apr 03 2013joseleorcasita
 
Daily livestock report oct 1 2012
Daily livestock report oct 1 2012Daily livestock report oct 1 2012
Daily livestock report oct 1 2012joseleorcasita
 
Daily livestock report sep 4 2012
Daily livestock report sep 4 2012Daily livestock report sep 4 2012
Daily livestock report sep 4 2012joseleorcasita
 
Daily livestock report aug 7 2012
Daily livestock report aug 7 2012Daily livestock report aug 7 2012
Daily livestock report aug 7 2012joseleorcasita
 
Daily livestock report mar 18 2013
Daily livestock report mar 18 2013Daily livestock report mar 18 2013
Daily livestock report mar 18 2013joseleorcasita
 
Daily livestock report dec 13 2012
Daily livestock report dec 13 2012Daily livestock report dec 13 2012
Daily livestock report dec 13 2012joseleorcasita
 
Daily livestock report feb 19 2013
Daily livestock report feb 19 2013Daily livestock report feb 19 2013
Daily livestock report feb 19 2013joseleorcasita
 
Daily livestock report sep 25 2012
Daily livestock report sep 25 2012Daily livestock report sep 25 2012
Daily livestock report sep 25 2012joseleorcasita
 

Similar to Daily livestock report no.158 (20)

Daily livestock report mar 28 2013
Daily livestock report mar 28 2013Daily livestock report mar 28 2013
Daily livestock report mar 28 2013
 
Daily livestock report july 18 2012
Daily livestock report july 18 2012Daily livestock report july 18 2012
Daily livestock report july 18 2012
 
Daily livestock report aug 10 2012
Daily livestock report aug 10 2012Daily livestock report aug 10 2012
Daily livestock report aug 10 2012
 
Daily livestock report feb 25 2013
Daily livestock report feb 25 2013Daily livestock report feb 25 2013
Daily livestock report feb 25 2013
 
Daily livestock report feb 22 2013
Daily livestock report feb 22 2013Daily livestock report feb 22 2013
Daily livestock report feb 22 2013
 
Daily livestock report sep 10 2012
Daily livestock report sep 10 2012Daily livestock report sep 10 2012
Daily livestock report sep 10 2012
 
Daily livestock report sep 10 2012
Daily livestock report sep 10 2012Daily livestock report sep 10 2012
Daily livestock report sep 10 2012
 
Daily livestock report jan 10 2013
Daily livestock report jan 10 2013Daily livestock report jan 10 2013
Daily livestock report jan 10 2013
 
Daily livestock report feb 14 2013
Daily livestock report feb 14 2013Daily livestock report feb 14 2013
Daily livestock report feb 14 2013
 
Daily livestock report aug 22 2012
Daily livestock report aug 22 2012Daily livestock report aug 22 2012
Daily livestock report aug 22 2012
 
Daily livestock report apr 17 2013
Daily livestock report apr 17 2013Daily livestock report apr 17 2013
Daily livestock report apr 17 2013
 
Daily livestock report apr 03 2013
Daily livestock report apr 03 2013Daily livestock report apr 03 2013
Daily livestock report apr 03 2013
 
Daily livestock report oct 1 2012
Daily livestock report oct 1 2012Daily livestock report oct 1 2012
Daily livestock report oct 1 2012
 
Ldp m october 2012
Ldp m october 2012Ldp m october 2012
Ldp m october 2012
 
Daily livestock report sep 4 2012
Daily livestock report sep 4 2012Daily livestock report sep 4 2012
Daily livestock report sep 4 2012
 
Daily livestock report aug 7 2012
Daily livestock report aug 7 2012Daily livestock report aug 7 2012
Daily livestock report aug 7 2012
 
Daily livestock report mar 18 2013
Daily livestock report mar 18 2013Daily livestock report mar 18 2013
Daily livestock report mar 18 2013
 
Daily livestock report dec 13 2012
Daily livestock report dec 13 2012Daily livestock report dec 13 2012
Daily livestock report dec 13 2012
 
Daily livestock report feb 19 2013
Daily livestock report feb 19 2013Daily livestock report feb 19 2013
Daily livestock report feb 19 2013
 
Daily livestock report sep 25 2012
Daily livestock report sep 25 2012Daily livestock report sep 25 2012
Daily livestock report sep 25 2012
 

More from joseleorcasita

Inac boletin semanal 24082013
Inac boletin semanal 24082013Inac boletin semanal 24082013
Inac boletin semanal 24082013joseleorcasita
 
Bcr boletin informativo 23082013
Bcr boletin informativo 23082013Bcr boletin informativo 23082013
Bcr boletin informativo 23082013joseleorcasita
 
Bcr informativo semanal 19042013
Bcr informativo semanal 19042013Bcr informativo semanal 19042013
Bcr informativo semanal 19042013joseleorcasita
 
Inac boletin semanal 13042013
Inac boletin semanal 13042013Inac boletin semanal 13042013
Inac boletin semanal 13042013joseleorcasita
 
Daily livestock report apr 19 2013
Daily livestock report apr 19 2013Daily livestock report apr 19 2013
Daily livestock report apr 19 2013joseleorcasita
 
Daily livestock report apr 16 2013
Daily livestock report apr 16 2013Daily livestock report apr 16 2013
Daily livestock report apr 16 2013joseleorcasita
 
Daily livestock report apr 15 2013
Daily livestock report apr 15 2013Daily livestock report apr 15 2013
Daily livestock report apr 15 2013joseleorcasita
 
Usda report april 2013
Usda report april 2013Usda report april 2013
Usda report april 2013joseleorcasita
 
Daily livestock report apr 12 2013
Daily livestock report apr 12 2013Daily livestock report apr 12 2013
Daily livestock report apr 12 2013joseleorcasita
 
Daily livestock report apr 11 2013
Daily livestock report apr 11 2013Daily livestock report apr 11 2013
Daily livestock report apr 11 2013joseleorcasita
 
Daily livestock report apr 10 2013
Daily livestock report apr 10 2013Daily livestock report apr 10 2013
Daily livestock report apr 10 2013joseleorcasita
 
Daily livestock report apr 09 2013
Daily livestock report apr 09 2013Daily livestock report apr 09 2013
Daily livestock report apr 09 2013joseleorcasita
 
Daily livestock report apr 08 2013
Daily livestock report apr 08 2013Daily livestock report apr 08 2013
Daily livestock report apr 08 2013joseleorcasita
 

More from joseleorcasita (20)

Bcr boletin 06092013
Bcr boletin 06092013Bcr boletin 06092013
Bcr boletin 06092013
 
Inac boletin 31082013
Inac boletin 31082013Inac boletin 31082013
Inac boletin 31082013
 
Boletim do leite 221
Boletim do leite 221Boletim do leite 221
Boletim do leite 221
 
Boletim do leite 220
Boletim do leite 220Boletim do leite 220
Boletim do leite 220
 
Boletim do leite 219
Boletim do leite 219Boletim do leite 219
Boletim do leite 219
 
Boletim do leite 218
Boletim do leite 218Boletim do leite 218
Boletim do leite 218
 
Boletim do leite 217
Boletim do leite 217Boletim do leite 217
Boletim do leite 217
 
Inac boletin semanal 24082013
Inac boletin semanal 24082013Inac boletin semanal 24082013
Inac boletin semanal 24082013
 
Bcr boletin informativo 23082013
Bcr boletin informativo 23082013Bcr boletin informativo 23082013
Bcr boletin informativo 23082013
 
Bcr informativo semanal 19042013
Bcr informativo semanal 19042013Bcr informativo semanal 19042013
Bcr informativo semanal 19042013
 
Inac boletin semanal 13042013
Inac boletin semanal 13042013Inac boletin semanal 13042013
Inac boletin semanal 13042013
 
Daily livestock report apr 19 2013
Daily livestock report apr 19 2013Daily livestock report apr 19 2013
Daily livestock report apr 19 2013
 
Daily livestock report apr 16 2013
Daily livestock report apr 16 2013Daily livestock report apr 16 2013
Daily livestock report apr 16 2013
 
Daily livestock report apr 15 2013
Daily livestock report apr 15 2013Daily livestock report apr 15 2013
Daily livestock report apr 15 2013
 
Usda report april 2013
Usda report april 2013Usda report april 2013
Usda report april 2013
 
Daily livestock report apr 12 2013
Daily livestock report apr 12 2013Daily livestock report apr 12 2013
Daily livestock report apr 12 2013
 
Daily livestock report apr 11 2013
Daily livestock report apr 11 2013Daily livestock report apr 11 2013
Daily livestock report apr 11 2013
 
Daily livestock report apr 10 2013
Daily livestock report apr 10 2013Daily livestock report apr 10 2013
Daily livestock report apr 10 2013
 
Daily livestock report apr 09 2013
Daily livestock report apr 09 2013Daily livestock report apr 09 2013
Daily livestock report apr 09 2013
 
Daily livestock report apr 08 2013
Daily livestock report apr 08 2013Daily livestock report apr 08 2013
Daily livestock report apr 08 2013
 

Daily livestock report no.158

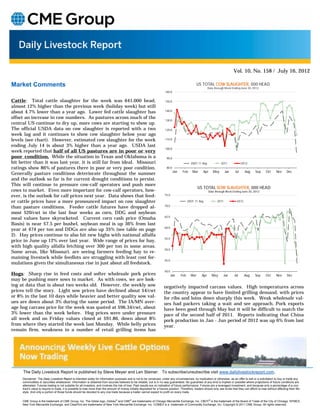
  • 1. Vol. 10, No. 158 / July 16, 2012 Market Comments US TOTAL COW SLAUGHTER, 000 HEAD Data through Week Ending June 30, 2012 160.0 Cattle: Total cattle slaughter for the week was 641,000 head, 150.0 almost 12% higher than the previous week (holiday week) but still about 4.7% lower than a year ago. Lower fed cattle slaughter has 140.0 offset an increase in cow numbers. As pastures across much of the 130.0 central US continue to dry up, more cows are starting to show up. The official USDA data on cow slaughter is reported with a two 120.0 week lag and it continues to show cow slaughter below year ago levels (see chart). However, estimated cow slaughter for the week 110.0 ending July 14 is about 3% higher than a year ago. USDA last 100.0 week reported that half of all US pastures are in poor or very poor condition. While the situation in Texas and Oklahoma is a 90.0 bit better than it was last year, it is still far from ideal. Missouri 2007-11 Avg. 2011 2012 ratings show 86% of pastures there in poor or very poor condition. 80.0 Jan Feb Mar Apr May Jun Jul Aug Sep Oct Nov Dec Generally pasture conditions deteriorate throughout the summer and the outlook so far is for current drought conditions to persist. This will continue to pressure cow-calf operators and push more US TOTAL SOW SLAUGHTER, 000 HEAD cows to market. Even more important for cow-calf operators, how- Data through Week Ending June 30, 2012 ever, is the outlook for calf prices next year. Data shows that feed- 75.0 er cattle prices have a more pronounced impact on cow slaughter 2007-11 Avg. 2011 2012 than pasture conditions. Feeder cattle futures have dropped al- 70.0 most $20/cwt in the last four weeks as corn, DDG and soybean meal values have skyrocketed. Current corn cash price (Omaha 65.0 Basis) is near $7.5 per bushel, soybean meal is up 36% from last 60.0 year at 474 per ton and DDGs are also up 35% (see table on page 2). Hay prices continue to also hit new highs with national alfalfa 55.0 price in June up 12% over last year. Wide range of prices for hay, with high quality alfalfa fetching over 300 per ton in some areas. 50.0 Some areas, like Missouri, are seeing farmers feeding hay to re- maining livestock while feedlots are struggling with least cost for- 45.0 mulations given the simultaneous rise in just about all feedstock. 40.0 Hogs: Sharp rise in feed costs and softer wholesale pork prices Jan Feb Mar Apr May Jun Jul Aug Sep Oct Nov Dec may be pushing more sows to market. As with cows, we are look- ing at data that is about two weeks old. However, the weekly sow negatively impacted carcass values. High temperatures across prices tell the story. Light sow prices have declined about $4/cwt the country appear to have limited grilling demand, with prices or 8% in the last 10 days while heavier and better quality sow val- for ribs and loins down sharply this week. Weak wholesale val- ues are down about 3% during the same period. The IA/MN aver- ues had packers taking a wait and see approach. Pork exports age hog carcass price for the week was quoted at $96.34/cwt, about have been good through May but it will be difficult to match the 3% lower than the week before. Hog prices were under pressure pace of the second half of 2011. Reports indicating that China all week and on Friday values closed at $91.86, down about 8% pork production in Jan - Jun period of 2012 was up 6% from last from where they started the week last Monday. While belly prices year. remain firm, weakness in a number of retail grilling items has The Daily Livestock Report is published by Steve Meyer and Len Steiner. To subscribe/unsubscribe visit www.dailylivestockreport.com. Disclaimer: The Daily Livestock Report is intended solely for information purposes and is not to be construed, under any circumstances, by implication or otherwise, as an offer to sell or a solicitation to buy or trade any commodities or securities whatsoever. Information is obtained from sources believed to be reliable, but is in no way guaranteed. No guarantee of any kind is implied or possible where projections of future conditions are attempted. Futures trading is not suitable for all investors, and involves the risk of loss. Past results are no indication of future performance. Futures are a leveraged investment, and because only a percentage of a con- tract’s value is require to trade, it is possible to lose more than the amount of money initially deposited for a futures position. Therefore, traders should only use funds that they can afford to lose without affecting their life- style. And only a portion of those funds should be devoted to any one trade because a trader cannot expect to profit on every trade. CME Group is the trademark of CME Group, Inc. The Globe logo, Globex® and CME® are trademarks of Chicago Mercantile Exchange, Inc. CBOT® is the trademark of the Board of Trade of the City of Chicago. NYMEX, New York Mercantile Exchange, and ClearPort are trademarks of New York Mercantile Exchange. Inc. COMEX is a trademark of Commodity Exchange, Inc. Copyright © 2011 CME Group. All rights reserved.
  • 2. Page 2 Vol. 10, No. 158 / July 16, 2012 PRODUCTION & PRICE SUMMARY Week Ending 7/14/2012 Current Pct. Pct. Y/Y % Last 52 Pct. Item Units Week Last Week Change Last Year Change YTD Change Weeks Change 14-Jul-12 7-Jul-12 16-Jul-11 Total Red Meat & Poultry mil lbs., cwe 1,608 1,623 -0.90% 1,635 -1.61% 46,135 10.3% 87,668 10.5% FI Slaughter Thou. Head 641 574 11.67% 673 -4.68% 17,293 -4.4% 32,745 -2.8% C FI Cow Slaughter ** Thou. Head 116 115 1.22% 125 -7.41% 3,087 -3.5% 6,599 2.1% A Avg. Live Weight Lbs. 1303 1299 0.31% 1272 2.44% 1,296 1.7% 1,291 0.6% T Avg. Dressed Weight Lbs. 791 787 0.51% 775 2.06% 785 1.9% 781 0.7% T Beef Production Million Lbs. 505.9 451.0 12.17% 519.0 -2.52% 13,545 -2.5% 25,501 -2.0% L Live Fed Steer Price $ per cwt 114.69 117.11 -2.07% 110.93 3.39% E Dressed Fed Steer Price $ per cwt 182.16 187.03 -2.60% 178.56 2.02% OKC Feeder Steer, 600-700 $ per cwt N/A 159.50 N/A 144.88 N/A & Choice Beef Cutout $ per cwt 187.33 193.52 -3.20% 180.86 3.58% Hide/Offal $ per cwt, live wt 13.17 12.95 1.70% 13.69 -3.80% B Rib, Choice $ per cwt 278.67 296.57 -6.04% 259.36 7.45% E Round, Choice $ per cwt 156.80 154.85 1.26% 154.65 1.39% E Chuck, Choice $ per cwt 141.93 144.29 -1.64% 145.80 -2.65% F Trimmings, 50% $ per cwt 49.19 49.99 -1.60% 82.81 -40.60% Trimmings, 90% $ per cwt 219.00 219.68 -0.31% 184.71 18.56% FI Slaughter Thou. Head 1,959 1,755 11.62% 2,024 -3.20% 58,059 1.4% 110,740 1.7% FI Sow Slaughter ** Thou. Head 56.0 57.1 -1.96% 59.6 -6.00% 1,450 -1.9% 2,999 1.2% H Avg. Dressed Weight Lbs. 204.0 205.0 -0.49% 202.0 0.99% 208 0.4% 206 0.1% O Pork Production Million Lbs. 400.1 360.2 11.08% 410.2 -2.46% 12,061 1.8% 22,815 1.9% G Iowa-S. Minn. Direct Wtd. Avg. 96.34 99.33 -3.01% 92.43 4.23% S Natl. Base Carcass Price Wtd. Avg. 95.87 97.02 -1.19% 91.53 4.74% Natl. Net Carcass Price Wtd. Avg. 98.43 99.69 -1.26% 94.38 4.29% Pork Cutout 185 Lbs. 89.61 91.54 -2.11% 98.22 -8.77% Hams $ per cwt 71.94 72.13 -0.26% 79.73 -9.77% Loins $ per cwt 99.36 102.88 -3.42% 114.12 -12.93% Bellies $ per cwt 134.52 132.89 1.23% 129.58 3.81% C Young Chicken Slaughter * Million Head 142.7 160.8 -11.28% 145.1 -1.62% 4,089 -5.1% 7,866 -5.6% H Avg. Weight (Live) Lbs. 5.65 5.75 -1.74% 5.66 -0.18% 5.73 0.0% 5.73 0.6% I Chicken Production (RTC) Million Lbs. 608.7 698.3 -12.83% 611.7 -0.48% 17,632 -4.2% 33,821 -4.3% C Eggs Set Million 194.1 196.3 -1.11% 195.0 -0.44% 5,324 -4.0% 10,089 -5.3% K Chicks Placed Million Head 163.2 165.7 -1.54% 166.0 -1.68% 4,437 -3.4% 8,401 -4.5% E 12-City Broiler Price Composite 83.36 82.47 1.08% 79.85 4.40% N Georgia Dock Broiler Price 2.5-3 Lbs. 93.9 93.81 0.10% 85.88 9.34% Northeast Breast, B/S $/cwt 137.42 136.08 0.98% 118.61 15.86% Northeast Legs $/cwt 64.46 69.43 -7.16% 62.85 2.56% T Young Turkey Slaughter * Million Head 3.919 4.694 -16.51% 3.988 -1.73% 117.666 -0.3% 230.500 -1.4% U Avg. Live Weight Lbs. 29.85 30.21 -1.19% 29.4 1.53% 30.12 -0.3% 30.08 1.8% R Turkey Production (RTC) Million Lbs. 93.5 113.4 -17.53% 93.8 -0.26% 2,897 1.9% 5,531 0.7% K Eastern Region Hen Price 8-16 Lbs. 106.10 106.50 -0.38% 104.00 2.02% G Corn, Omaha $ per Bushel 7.44 7.42 0.27% 7.29 2.06% R DDGs, Minnesota $ per Ton 242.50 230.00 5.43% 180.00 34.72% A Wheat, Kansas City $ per Bushel 8.23 7.94 3.65% 7.45 10.47% I Soybeans, S. Iowa $ per Bushel 16.19 16.19 0.00% 14.08 14.99% N Soybn Meal, 48% Decatur $ per Ton 473.70 476.80 -0.65% 348.50 35.93% * Chicken & turkey slaughter & production are 1 week earlier than the date at the top of this sheet. ** Cow and sow slaughter reflect levels from two weeks ago due to reporting lag.