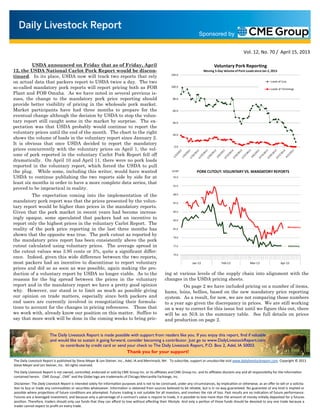
SlideShare a Scribd company logo
Sponsored by


                                                                                                                                                            Vol. 12, No. 70 / April 15, 2013

          USDA announced on Friday that as of Friday, April                                                                             Voluntary Pork Reporting
12, the USDA National Carlot Pork Report would be discon-                                                                        Moving 5-Day Volume of Pork Loads since Jan 2, 2013
tinued. In its place, USDA now will track two reports that rely                                           120.0

on actual data that packers report to USDA twice a day. The two                                                                                                                Loads of Cuts

so-called mandatory pork reports will report pricing both as FOB                                          100.0
                                                                                                                                                                               Loads of Trimmings
Plant and FOB Omaha. As we have noted in several previous is-
sues, the change to the mandatory pork price reporting should                                              80.0

provide better visibility of pricing in the wholesale pork market.
Market participants have had three months to prepare for the                                               60.0
eventual change although the decision by USDA to stop the volun-
tary report still caught some in the market by surprise. The ex-                                           40.0
pectation was that USDA probably would continue to report the
voluntary prices until the end of the month. The chart to the right                                        20.0
shows the volume of loads in the voluntary report since January 2.
It is obvious that once USDA decided to report the mandatory
                                                                                                            0.0
prices concurrently with the voluntary prices on April 1, the vol-
ume of pork reported in the voluntary Carlot Pork Report fell off
dramatically. On April 10 and April 11, there were no pork loads
reported in the voluntary report, which forced the USDA to pull
the plug. While some, including this writer, would have wanted                                            $/CWT            PORK CUTOUT: VOLUNTARY VS. MANDATORY REPORTS
USDA to continue publishing the two reports side by side for at                                            93.0

least six months in order to have a more complete data series, that
                                                                                                           91.0
proved to be impractical in reality.
         The expectation coming into the implementation of the                                             89.0

mandatory pork report was that the prices presented by the volun-                                          87.0
tary report would be higher than prices in the mandatory reports.
Given that the pork market in recent years had become increas-                                             85.0

ingly opaque, some speculated that packers had an incentive to                                             83.0
report only the highest prices in the voluntary Carlot Report. The
reality of the pork price reporting in the last three months has
                                                                                                                                                                                               Mandatory
                                                                                                           81.0

shown that the opposite was true. The pork cutout as reported by
                                                                                                           79.0
the mandatory price report has been consistently above the pork
cutout calculated using voluntary prices. The average spread in                                            77.0                                                                                Voluntary

the cutout values was 3.95 cents or 5%, quite a significant differ-
                                                                                                           75.0
ence. Indeed, given this wide difference between the two reports,
most packers had an incentive to discontinue to report voluntary                                                        Jan-13               Feb-13              Mar-13                Apr-13
prices and did so as soon as was possible, again making the pro-
duction of a voluntary report by USDA no longer viable. As to the                                    ing at various levels of the supply chain into alignment with the
reasons for the big spread between the prices in the voluntary                                       changes in the USDA pricing sheets.
report and in the mandatory report we have a pretty good opinion                                              On page 2 we have included pricing on a number of items,
why. However, our stand is to limit as much as possible giving                                       hams, loins, bellies, based on the new mandatory price reporting
our opinion on trade matters, especially since both packers and                                      system. As a result, for now, we are not comparing those numbers
end users are currently involved in renegotiating their formula-                                     to a year ago given the discrepancy in prices. We are still working
tions to account for the changes in pricing references. Those that                                   on a way to correct for this issue but until we figure this out, there
we work with, already know our position on this matter. Suffice to                                   will be an N/A in the summary table. See full details on prices
say that more work will be done in the coming weeks to bring pric-                                   and production on page 2.


                        The Daily Livestock Report is made possible with support from readers like you. If you enjoy this report, find if valuable
                        and would like to sustain it going forward, consider becoming a contributor. Just go to www.DailyLivestockReport.com
                             to contribute by credit card or send your check to The Daily Livestock Report, P.O. Box 2, Adel, IA 50003.
                                                                            Thank you for your support!
The Daily Livestock Report is published by Steve Meyer & Len Steiner, Inc., Adel, IA and Merrimack, NH. To subscribe, support or unsubscribe visit www.dailylivestockreport.com. Copyright © 2013
Steve Meyer and Len Steiner, Inc. All rights reserved.
The Daily Livestock Report is not owned, controlled, endorsed or sold by CME Group Inc. or its affiliates and CME Group Inc. and its affiliates disclaim any and all responsibility for the informa on
contained herein. CME Group®, CME® and the Globe logo are trademarks of Chicago Mercan le Exchange, Inc.
Disclaimer: The Daily Livestock Report is intended solely for informa on purposes and is not to be construed, under any circumstances, by implica on or otherwise, as an offer to sell or a solicita-
  on to buy or trade any commodi es or securi es whatsoever. Informa on is obtained from sources believed to be reliable, but is in no way guaranteed. No guarantee of any kind is implied or
possible where projec ons of future condi ons are a empted. Futures trading is not suitable for all investors, and involves the risk of loss. Past results are no indica on of future performance.
Futures are a leveraged investment, and because only a percentage of a contract’s value is require to trade, it is possible to lose more than the amount of money ini ally deposited for a futures
posi on. Therefore, traders should only use funds that they can afford to lose without affec ng their lifestyle. And only a por on of those funds should be devoted to any one trade because a
trader cannot expect to profit on every trade.
Page 2


                                                                                                                Sponsored by

                                                                                                                                      Vol. 12, No. 70 / April 15, 2013


PRODUCTION & PRICE SUMMARY                                                                                               Week Ending                   4/13/2013
                                                                     Current                                                                               Y/Y %
     Item                                  Units                       Week       Last Week     Pct. Change       Last Year   Pct. Change        YTD      Change
                                                                  13-Apr-13        6-Apr-13                      14-Apr-12


     Total Red Meat & Poultry              mil lbs., cwe               1,694          1,644            3.07%         1,607         5.42%      24,444        0.6%

     FI Slaughter                          Thou. Head                    606            593             2.19%          581         4.29%       8,843        -2.7%
 C   FI Cow Slaughter **                   Thou. Head                    120            126            -4.79%          116         3.28%       1,598        -0.2%
 A   Avg. Live Weight                      Lbs.                        1304           1315             -0.84%        1283          1.64%       1,321         1.4%
 T   Avg. Dressed Weight                   Lbs.                          791            794            -0.38%          779         1.54%         797         1.4%
 T   Beef Production                       Million Lbs.                478.5          469.5             1.92%        451.4         6.00%       6,995        -1.9%
 L   Live Fed Steer Price                  $ per cwt                  127.23         128.29            -0.83%       122.16         4.15%
 E   Dressed Fed Steer Price               $ per cwt                  200.36         204.41            -1.98%       195.03         2.73%
     OKC Feeder Steer, 600-700             $ per cwt                  155.45         152.29             2.07%       164.71        -5.62%
 &   Choice Beef Cutout                    $ per cwt                  190.60         191.29            -0.36%       177.79         7.21%
     Hide/Offal                            $ per cwt, live wt          14.44          14.23             1.48%        13.23         9.15%
 B   Rib, Choice                           $ per cwt                  275.99         281.91            -2.10%       261.15         5.68%
 E   Round, Choice                         $ per cwt                  161.44         162.86            -0.87%       153.54         5.15%
 E   Chuck, Choice                         $ per cwt                  159.99         161.38            -0.86%       143.73       11.31%
 F   Trimmings, 50%                        $ per cwt                   96.46          92.34             4.46%        52.80       82.69%
     Trimmings, 90%                        $ per cwt                  217.80         218.70            -0.41%       220.99        -1.44%
     FI Slaughter                          Thou. Head                  2,082          2,093            -0.53%        2,052         1.46%     31,833         -0.7%
     FI Sow Slaughter **                   Thou. Head                   57.2           58.0            -1.36%         55.9         2.35%        732          1.0%
 H   Avg. Dressed Weight                   Lbs.                        207.0          208.0            -0.48%        209.0        -0.96%        207         -0.7%
 O   Pork Production                       Million Lbs.                431.9          434.3            -0.55%        428.6         0.77%      6,603         -1.3%
 G   Iowa-S. Minn. Direct                  Wtd. Avg.                   80.83          78.88             2.47%        79.93         1.13%
 S   Natl. Base Carcass Price              Wtd. Avg.                   80.28          78.22             2.63%        80.89        -0.75%
     Natl. Net Carcass Price               Wtd. Avg.                   82.68          80.64             2.53%        83.31        -0.76%
     Pork Cutout                           200 Lbs.                    81.53          80.41             1.39%           NA       #VALUE!
     Hams                                  $ per cwt                   62.72          59.41             5.57%           NA       #VALUE!
     Loins                                 $ per cwt                   86.18          86.25            -0.08%           NA       #VALUE!
     Bellies                               $ per cwt                  139.44         136.16             2.41%           NA       #VALUE!
     72CL Pork Trim                        $ per cwt                      NQ          51.84                NA        47.32       #VALUE!
 C   Young Chicken Slaughter *             Million Head                153.2          149.7             2.36%        147.8         3.71%       2,120        1.3%
 H   Avg. Weight (Live)                    Lbs.                         5.83           5.64             3.37%         5.65         3.19%        5.82        1.6%
 I   Chicken Production (RTC)              Million Lbs.                679.0          641.7             5.81%        630.3         7.72%       9,377        4.3%
 C   Eggs Set                              Million                     199.4          200.3            -0.46%        199.3         0.02%       2,777        1.3%
 K   Chicks Placed                         Million Head                165.2          163.7             0.95%        165.2         0.02%       2,289        0.6%
 E   12-City Broiler Price                 Composite                  106.94         106.51             0.40%        85.41       25.21%
 N   Georgia Dock Broiler Price            2.5-3 Lbs.                 102.57         102.28             0.28%        92.01       11.48%
     Northeast Breast, B/S                 $/cwt                      153.24         152.27             0.64%       136.35       12.39%
     Northeast Legs                        $/cwt                        72.2          69.85             3.36%        71.51         0.96%
 T   Young Turkey Slaughter *              Million Head                4.220          3.993             5.68%        3.953         6.75%     58.813         -1.1%
 U   Avg. Live Weight                      Lbs.                        31.14          30.83             1.01%         30.7         1.43%      31.26          0.2%
 R   Turkey Production (RTC)               Million Lbs.                105.1           98.5             6.77%         97.1         8.30%      1,469         -0.9%
 K   Eastern Region Hen Price              8-16 Lbs.                  100.47          97.00             3.58%       107.25        -6.32%
 G   Corn, Omaha                           $ per Bushel                 6.81           6.59             3.34%         6.47         5.26%
 R   DDGs, Minnesota                       $ per Ton                  235.00         245.00            -4.08%       205.00       14.63%
 A   Wheat, Kansas City                    $ per Bushel                 7.26           6.99             3.86%         6.16       17.86%
 I   Soybeans, S. Iowa                     $ per Bushel                14.61          14.24             2.60%        14.46         1.04%
 N   Soybn Meal, 48% Decatur               $ per Ton                  411.50         407.10             1.08%       388.10         6.03%
* Chicken & turkey slaughter & production are 1 week earlier than the date at the top of this sheet.
** Cow and sow slaughter reflect levels from two weeks ago due to reporting lag.


                  The Daily Livestock Report is made possible with support from readers like you. If you enjoy this report, find if valuable
                  and would like to sustain it going forward, consider becoming a contributor. Just go to www.DailyLivestockReport.com
                       to contribute by credit card or send your check to The Daily Livestock Report, P.O. Box 2, Adel, IA 50003.
                                                                Thank you for your support!

More Related Content

Viewers also liked

About meimmersion abw
About meimmersion abwAbout meimmersion abw
About meimmersion abwlabecvar
 
Fcv hum mach_belongie
Fcv hum mach_belongieFcv hum mach_belongie
Fcv hum mach_belongiezukun
 
Open stackatlantagrouppolicy
Open stackatlantagrouppolicyOpen stackatlantagrouppolicy
Open stackatlantagrouppolicy
Mohammad Banikazemi
 
A Dualistic Sub-Image Histogram Equalization Based Enhancement and Segmentati...
A Dualistic Sub-Image Histogram Equalization Based Enhancement and Segmentati...A Dualistic Sub-Image Histogram Equalization Based Enhancement and Segmentati...
A Dualistic Sub-Image Histogram Equalization Based Enhancement and Segmentati...
inventy
 
Git basics
Git basicsGit basics
Git basics
Surabhi Gupta
 

Viewers also liked (7)

About meimmersion abw
About meimmersion abwAbout meimmersion abw
About meimmersion abw
 
Fcv hum mach_belongie
Fcv hum mach_belongieFcv hum mach_belongie
Fcv hum mach_belongie
 
Open stackatlantagrouppolicy
Open stackatlantagrouppolicyOpen stackatlantagrouppolicy
Open stackatlantagrouppolicy
 
Reddottherapy
ReddottherapyReddottherapy
Reddottherapy
 
Rakesh_Gupta
Rakesh_GuptaRakesh_Gupta
Rakesh_Gupta
 
A Dualistic Sub-Image Histogram Equalization Based Enhancement and Segmentati...
A Dualistic Sub-Image Histogram Equalization Based Enhancement and Segmentati...A Dualistic Sub-Image Histogram Equalization Based Enhancement and Segmentati...
A Dualistic Sub-Image Histogram Equalization Based Enhancement and Segmentati...
 
Git basics
Git basicsGit basics
Git basics
 

Similar to Daily livestock report apr 15 2013

Daily livestock report feb 19 2013
Daily livestock report feb 19 2013Daily livestock report feb 19 2013
Daily livestock report feb 19 2013joseleorcasita
 
Daily livestock report feb 26 2013
Daily livestock report feb 26 2013Daily livestock report feb 26 2013
Daily livestock report feb 26 2013joseleorcasita
 
Daily livestock report apr 03 2013
Daily livestock report apr 03 2013Daily livestock report apr 03 2013
Daily livestock report apr 03 2013joseleorcasita
 
Daily livestock report apr 17 2013
Daily livestock report apr 17 2013Daily livestock report apr 17 2013
Daily livestock report apr 17 2013joseleorcasita
 
Daily livestock report mar 11 2013
Daily livestock report mar 11 2013Daily livestock report mar 11 2013
Daily livestock report mar 11 2013joseleorcasita
 
CAPE Economics, June 2006, Unit 1, Paper 2 suggested answer by Edward Bahaw
CAPE Economics, June 2006, Unit 1, Paper 2 suggested answer by Edward BahawCAPE Economics, June 2006, Unit 1, Paper 2 suggested answer by Edward Bahaw
CAPE Economics, June 2006, Unit 1, Paper 2 suggested answer by Edward Bahaw
CAPE ECONOMICS
 
Daily livestock report mar 04 2013
Daily livestock report mar 04 2013Daily livestock report mar 04 2013
Daily livestock report mar 04 2013joseleorcasita
 
Daily livestock report mar 14 2013
Daily livestock report mar 14 2013Daily livestock report mar 14 2013
Daily livestock report mar 14 2013joseleorcasita
 
Daily livestock report apr 19 2013
Daily livestock report apr 19 2013Daily livestock report apr 19 2013
Daily livestock report apr 19 2013joseleorcasita
 
Daily livestock report oct 16 2012
Daily livestock report oct 16 2012Daily livestock report oct 16 2012
Daily livestock report oct 16 2012joseleorcasita
 
Daily livestock report july 18 2012
Daily livestock report july 18 2012Daily livestock report july 18 2012
Daily livestock report july 18 2012joseleorcasita
 
Daily livestock report oct 2 2012
Daily livestock report oct 2 2012Daily livestock report oct 2 2012
Daily livestock report oct 2 2012joseleorcasita
 
Daily livestock report aug 10 2012
Daily livestock report aug 10 2012Daily livestock report aug 10 2012
Daily livestock report aug 10 2012joseleorcasita
 
Daily livestock report apr 01 2013
Daily livestock report apr 01 2013Daily livestock report apr 01 2013
Daily livestock report apr 01 2013joseleorcasita
 
Daily livestock report apr 10 2013
Daily livestock report apr 10 2013Daily livestock report apr 10 2013
Daily livestock report apr 10 2013joseleorcasita
 
Daily livestock report jan 17 2013
Daily livestock report jan 17 2013Daily livestock report jan 17 2013
Daily livestock report jan 17 2013joseleorcasita
 
Daily livestock report feb 25 2013
Daily livestock report feb 25 2013Daily livestock report feb 25 2013
Daily livestock report feb 25 2013joseleorcasita
 
Daily livestock report dec 13 2012
Daily livestock report dec 13 2012Daily livestock report dec 13 2012
Daily livestock report dec 13 2012joseleorcasita
 
Daily livestock report jan 18 2013
Daily livestock report jan 18 2013Daily livestock report jan 18 2013
Daily livestock report jan 18 2013joseleorcasita
 
Daily livestock report feb 22 2013
Daily livestock report feb 22 2013Daily livestock report feb 22 2013
Daily livestock report feb 22 2013joseleorcasita
 

Similar to Daily livestock report apr 15 2013 (20)

Daily livestock report feb 19 2013
Daily livestock report feb 19 2013Daily livestock report feb 19 2013
Daily livestock report feb 19 2013
 
Daily livestock report feb 26 2013
Daily livestock report feb 26 2013Daily livestock report feb 26 2013
Daily livestock report feb 26 2013
 
Daily livestock report apr 03 2013
Daily livestock report apr 03 2013Daily livestock report apr 03 2013
Daily livestock report apr 03 2013
 
Daily livestock report apr 17 2013
Daily livestock report apr 17 2013Daily livestock report apr 17 2013
Daily livestock report apr 17 2013
 
Daily livestock report mar 11 2013
Daily livestock report mar 11 2013Daily livestock report mar 11 2013
Daily livestock report mar 11 2013
 
CAPE Economics, June 2006, Unit 1, Paper 2 suggested answer by Edward Bahaw
CAPE Economics, June 2006, Unit 1, Paper 2 suggested answer by Edward BahawCAPE Economics, June 2006, Unit 1, Paper 2 suggested answer by Edward Bahaw
CAPE Economics, June 2006, Unit 1, Paper 2 suggested answer by Edward Bahaw
 
Daily livestock report mar 04 2013
Daily livestock report mar 04 2013Daily livestock report mar 04 2013
Daily livestock report mar 04 2013
 
Daily livestock report mar 14 2013
Daily livestock report mar 14 2013Daily livestock report mar 14 2013
Daily livestock report mar 14 2013
 
Daily livestock report apr 19 2013
Daily livestock report apr 19 2013Daily livestock report apr 19 2013
Daily livestock report apr 19 2013
 
Daily livestock report oct 16 2012
Daily livestock report oct 16 2012Daily livestock report oct 16 2012
Daily livestock report oct 16 2012
 
Daily livestock report july 18 2012
Daily livestock report july 18 2012Daily livestock report july 18 2012
Daily livestock report july 18 2012
 
Daily livestock report oct 2 2012
Daily livestock report oct 2 2012Daily livestock report oct 2 2012
Daily livestock report oct 2 2012
 
Daily livestock report aug 10 2012
Daily livestock report aug 10 2012Daily livestock report aug 10 2012
Daily livestock report aug 10 2012
 
Daily livestock report apr 01 2013
Daily livestock report apr 01 2013Daily livestock report apr 01 2013
Daily livestock report apr 01 2013
 
Daily livestock report apr 10 2013
Daily livestock report apr 10 2013Daily livestock report apr 10 2013
Daily livestock report apr 10 2013
 
Daily livestock report jan 17 2013
Daily livestock report jan 17 2013Daily livestock report jan 17 2013
Daily livestock report jan 17 2013
 
Daily livestock report feb 25 2013
Daily livestock report feb 25 2013Daily livestock report feb 25 2013
Daily livestock report feb 25 2013
 
Daily livestock report dec 13 2012
Daily livestock report dec 13 2012Daily livestock report dec 13 2012
Daily livestock report dec 13 2012
 
Daily livestock report jan 18 2013
Daily livestock report jan 18 2013Daily livestock report jan 18 2013
Daily livestock report jan 18 2013
 
Daily livestock report feb 22 2013
Daily livestock report feb 22 2013Daily livestock report feb 22 2013
Daily livestock report feb 22 2013
 

More from joseleorcasita

Inac boletin semanal 24082013
Inac boletin semanal 24082013Inac boletin semanal 24082013
Inac boletin semanal 24082013joseleorcasita
 
Bcr boletin informativo 23082013
Bcr boletin informativo 23082013Bcr boletin informativo 23082013
Bcr boletin informativo 23082013joseleorcasita
 
Bcr informativo semanal 19042013
Bcr informativo semanal 19042013Bcr informativo semanal 19042013
Bcr informativo semanal 19042013joseleorcasita
 
Inac boletin semanal 13042013
Inac boletin semanal 13042013Inac boletin semanal 13042013
Inac boletin semanal 13042013joseleorcasita
 
Daily livestock report apr 16 2013
Daily livestock report apr 16 2013Daily livestock report apr 16 2013
Daily livestock report apr 16 2013joseleorcasita
 
Usda report april 2013
Usda report april 2013Usda report april 2013
Usda report april 2013joseleorcasita
 
Daily livestock report apr 12 2013
Daily livestock report apr 12 2013Daily livestock report apr 12 2013
Daily livestock report apr 12 2013joseleorcasita
 
Daily livestock report apr 11 2013
Daily livestock report apr 11 2013Daily livestock report apr 11 2013
Daily livestock report apr 11 2013joseleorcasita
 
Daily livestock report apr 09 2013
Daily livestock report apr 09 2013Daily livestock report apr 09 2013
Daily livestock report apr 09 2013joseleorcasita
 
Daily livestock report apr 08 2013
Daily livestock report apr 08 2013Daily livestock report apr 08 2013
Daily livestock report apr 08 2013joseleorcasita
 
Daily livestock report apr 05 2013
Daily livestock report apr 05 2013Daily livestock report apr 05 2013
Daily livestock report apr 05 2013joseleorcasita
 
Daily livestock report apr 04 2013
Daily livestock report apr 04 2013Daily livestock report apr 04 2013
Daily livestock report apr 04 2013joseleorcasita
 
Daily livestock report apr 02 2013
Daily livestock report apr 02 2013Daily livestock report apr 02 2013
Daily livestock report apr 02 2013joseleorcasita
 

More from joseleorcasita (20)

Bcr boletin 06092013
Bcr boletin 06092013Bcr boletin 06092013
Bcr boletin 06092013
 
Inac boletin 31082013
Inac boletin 31082013Inac boletin 31082013
Inac boletin 31082013
 
Boletim do leite 221
Boletim do leite 221Boletim do leite 221
Boletim do leite 221
 
Boletim do leite 220
Boletim do leite 220Boletim do leite 220
Boletim do leite 220
 
Boletim do leite 219
Boletim do leite 219Boletim do leite 219
Boletim do leite 219
 
Boletim do leite 218
Boletim do leite 218Boletim do leite 218
Boletim do leite 218
 
Boletim do leite 217
Boletim do leite 217Boletim do leite 217
Boletim do leite 217
 
Inac boletin semanal 24082013
Inac boletin semanal 24082013Inac boletin semanal 24082013
Inac boletin semanal 24082013
 
Bcr boletin informativo 23082013
Bcr boletin informativo 23082013Bcr boletin informativo 23082013
Bcr boletin informativo 23082013
 
Bcr informativo semanal 19042013
Bcr informativo semanal 19042013Bcr informativo semanal 19042013
Bcr informativo semanal 19042013
 
Inac boletin semanal 13042013
Inac boletin semanal 13042013Inac boletin semanal 13042013
Inac boletin semanal 13042013
 
Daily livestock report apr 16 2013
Daily livestock report apr 16 2013Daily livestock report apr 16 2013
Daily livestock report apr 16 2013
 
Usda report april 2013
Usda report april 2013Usda report april 2013
Usda report april 2013
 
Daily livestock report apr 12 2013
Daily livestock report apr 12 2013Daily livestock report apr 12 2013
Daily livestock report apr 12 2013
 
Daily livestock report apr 11 2013
Daily livestock report apr 11 2013Daily livestock report apr 11 2013
Daily livestock report apr 11 2013
 
Daily livestock report apr 09 2013
Daily livestock report apr 09 2013Daily livestock report apr 09 2013
Daily livestock report apr 09 2013
 
Daily livestock report apr 08 2013
Daily livestock report apr 08 2013Daily livestock report apr 08 2013
Daily livestock report apr 08 2013
 
Daily livestock report apr 05 2013
Daily livestock report apr 05 2013Daily livestock report apr 05 2013
Daily livestock report apr 05 2013
 
Daily livestock report apr 04 2013
Daily livestock report apr 04 2013Daily livestock report apr 04 2013
Daily livestock report apr 04 2013
 
Daily livestock report apr 02 2013
Daily livestock report apr 02 2013Daily livestock report apr 02 2013
Daily livestock report apr 02 2013
 

Daily livestock report apr 15 2013

  • 1. Sponsored by Vol. 12, No. 70 / April 15, 2013 USDA announced on Friday that as of Friday, April Voluntary Pork Reporting 12, the USDA National Carlot Pork Report would be discon- Moving 5-Day Volume of Pork Loads since Jan 2, 2013 tinued. In its place, USDA now will track two reports that rely 120.0 on actual data that packers report to USDA twice a day. The two Loads of Cuts so-called mandatory pork reports will report pricing both as FOB 100.0 Loads of Trimmings Plant and FOB Omaha. As we have noted in several previous is- sues, the change to the mandatory pork price reporting should 80.0 provide better visibility of pricing in the wholesale pork market. Market participants have had three months to prepare for the 60.0 eventual change although the decision by USDA to stop the volun- tary report still caught some in the market by surprise. The ex- 40.0 pectation was that USDA probably would continue to report the voluntary prices until the end of the month. The chart to the right 20.0 shows the volume of loads in the voluntary report since January 2. It is obvious that once USDA decided to report the mandatory 0.0 prices concurrently with the voluntary prices on April 1, the vol- ume of pork reported in the voluntary Carlot Pork Report fell off dramatically. On April 10 and April 11, there were no pork loads reported in the voluntary report, which forced the USDA to pull the plug. While some, including this writer, would have wanted $/CWT PORK CUTOUT: VOLUNTARY VS. MANDATORY REPORTS USDA to continue publishing the two reports side by side for at 93.0 least six months in order to have a more complete data series, that 91.0 proved to be impractical in reality. The expectation coming into the implementation of the 89.0 mandatory pork report was that the prices presented by the volun- 87.0 tary report would be higher than prices in the mandatory reports. Given that the pork market in recent years had become increas- 85.0 ingly opaque, some speculated that packers had an incentive to 83.0 report only the highest prices in the voluntary Carlot Report. The reality of the pork price reporting in the last three months has Mandatory 81.0 shown that the opposite was true. The pork cutout as reported by 79.0 the mandatory price report has been consistently above the pork cutout calculated using voluntary prices. The average spread in 77.0 Voluntary the cutout values was 3.95 cents or 5%, quite a significant differ- 75.0 ence. Indeed, given this wide difference between the two reports, most packers had an incentive to discontinue to report voluntary Jan-13 Feb-13 Mar-13 Apr-13 prices and did so as soon as was possible, again making the pro- duction of a voluntary report by USDA no longer viable. As to the ing at various levels of the supply chain into alignment with the reasons for the big spread between the prices in the voluntary changes in the USDA pricing sheets. report and in the mandatory report we have a pretty good opinion On page 2 we have included pricing on a number of items, why. However, our stand is to limit as much as possible giving hams, loins, bellies, based on the new mandatory price reporting our opinion on trade matters, especially since both packers and system. As a result, for now, we are not comparing those numbers end users are currently involved in renegotiating their formula- to a year ago given the discrepancy in prices. We are still working tions to account for the changes in pricing references. Those that on a way to correct for this issue but until we figure this out, there we work with, already know our position on this matter. Suffice to will be an N/A in the summary table. See full details on prices say that more work will be done in the coming weeks to bring pric- and production on page 2. The Daily Livestock Report is made possible with support from readers like you. If you enjoy this report, find if valuable and would like to sustain it going forward, consider becoming a contributor. Just go to www.DailyLivestockReport.com to contribute by credit card or send your check to The Daily Livestock Report, P.O. Box 2, Adel, IA 50003. Thank you for your support! The Daily Livestock Report is published by Steve Meyer & Len Steiner, Inc., Adel, IA and Merrimack, NH. To subscribe, support or unsubscribe visit www.dailylivestockreport.com. Copyright © 2013 Steve Meyer and Len Steiner, Inc. All rights reserved. The Daily Livestock Report is not owned, controlled, endorsed or sold by CME Group Inc. or its affiliates and CME Group Inc. and its affiliates disclaim any and all responsibility for the informa on contained herein. CME Group®, CME® and the Globe logo are trademarks of Chicago Mercan le Exchange, Inc. Disclaimer: The Daily Livestock Report is intended solely for informa on purposes and is not to be construed, under any circumstances, by implica on or otherwise, as an offer to sell or a solicita- on to buy or trade any commodi es or securi es whatsoever. Informa on is obtained from sources believed to be reliable, but is in no way guaranteed. No guarantee of any kind is implied or possible where projec ons of future condi ons are a empted. Futures trading is not suitable for all investors, and involves the risk of loss. Past results are no indica on of future performance. Futures are a leveraged investment, and because only a percentage of a contract’s value is require to trade, it is possible to lose more than the amount of money ini ally deposited for a futures posi on. Therefore, traders should only use funds that they can afford to lose without affec ng their lifestyle. And only a por on of those funds should be devoted to any one trade because a trader cannot expect to profit on every trade.
  • 2. Page 2 Sponsored by Vol. 12, No. 70 / April 15, 2013 PRODUCTION & PRICE SUMMARY Week Ending 4/13/2013 Current Y/Y % Item Units Week Last Week Pct. Change Last Year Pct. Change YTD Change 13-Apr-13 6-Apr-13 14-Apr-12 Total Red Meat & Poultry mil lbs., cwe 1,694 1,644 3.07% 1,607 5.42% 24,444 0.6% FI Slaughter Thou. Head 606 593 2.19% 581 4.29% 8,843 -2.7% C FI Cow Slaughter ** Thou. Head 120 126 -4.79% 116 3.28% 1,598 -0.2% A Avg. Live Weight Lbs. 1304 1315 -0.84% 1283 1.64% 1,321 1.4% T Avg. Dressed Weight Lbs. 791 794 -0.38% 779 1.54% 797 1.4% T Beef Production Million Lbs. 478.5 469.5 1.92% 451.4 6.00% 6,995 -1.9% L Live Fed Steer Price $ per cwt 127.23 128.29 -0.83% 122.16 4.15% E Dressed Fed Steer Price $ per cwt 200.36 204.41 -1.98% 195.03 2.73% OKC Feeder Steer, 600-700 $ per cwt 155.45 152.29 2.07% 164.71 -5.62% & Choice Beef Cutout $ per cwt 190.60 191.29 -0.36% 177.79 7.21% Hide/Offal $ per cwt, live wt 14.44 14.23 1.48% 13.23 9.15% B Rib, Choice $ per cwt 275.99 281.91 -2.10% 261.15 5.68% E Round, Choice $ per cwt 161.44 162.86 -0.87% 153.54 5.15% E Chuck, Choice $ per cwt 159.99 161.38 -0.86% 143.73 11.31% F Trimmings, 50% $ per cwt 96.46 92.34 4.46% 52.80 82.69% Trimmings, 90% $ per cwt 217.80 218.70 -0.41% 220.99 -1.44% FI Slaughter Thou. Head 2,082 2,093 -0.53% 2,052 1.46% 31,833 -0.7% FI Sow Slaughter ** Thou. Head 57.2 58.0 -1.36% 55.9 2.35% 732 1.0% H Avg. Dressed Weight Lbs. 207.0 208.0 -0.48% 209.0 -0.96% 207 -0.7% O Pork Production Million Lbs. 431.9 434.3 -0.55% 428.6 0.77% 6,603 -1.3% G Iowa-S. Minn. Direct Wtd. Avg. 80.83 78.88 2.47% 79.93 1.13% S Natl. Base Carcass Price Wtd. Avg. 80.28 78.22 2.63% 80.89 -0.75% Natl. Net Carcass Price Wtd. Avg. 82.68 80.64 2.53% 83.31 -0.76% Pork Cutout 200 Lbs. 81.53 80.41 1.39% NA #VALUE! Hams $ per cwt 62.72 59.41 5.57% NA #VALUE! Loins $ per cwt 86.18 86.25 -0.08% NA #VALUE! Bellies $ per cwt 139.44 136.16 2.41% NA #VALUE! 72CL Pork Trim $ per cwt NQ 51.84 NA 47.32 #VALUE! C Young Chicken Slaughter * Million Head 153.2 149.7 2.36% 147.8 3.71% 2,120 1.3% H Avg. Weight (Live) Lbs. 5.83 5.64 3.37% 5.65 3.19% 5.82 1.6% I Chicken Production (RTC) Million Lbs. 679.0 641.7 5.81% 630.3 7.72% 9,377 4.3% C Eggs Set Million 199.4 200.3 -0.46% 199.3 0.02% 2,777 1.3% K Chicks Placed Million Head 165.2 163.7 0.95% 165.2 0.02% 2,289 0.6% E 12-City Broiler Price Composite 106.94 106.51 0.40% 85.41 25.21% N Georgia Dock Broiler Price 2.5-3 Lbs. 102.57 102.28 0.28% 92.01 11.48% Northeast Breast, B/S $/cwt 153.24 152.27 0.64% 136.35 12.39% Northeast Legs $/cwt 72.2 69.85 3.36% 71.51 0.96% T Young Turkey Slaughter * Million Head 4.220 3.993 5.68% 3.953 6.75% 58.813 -1.1% U Avg. Live Weight Lbs. 31.14 30.83 1.01% 30.7 1.43% 31.26 0.2% R Turkey Production (RTC) Million Lbs. 105.1 98.5 6.77% 97.1 8.30% 1,469 -0.9% K Eastern Region Hen Price 8-16 Lbs. 100.47 97.00 3.58% 107.25 -6.32% G Corn, Omaha $ per Bushel 6.81 6.59 3.34% 6.47 5.26% R DDGs, Minnesota $ per Ton 235.00 245.00 -4.08% 205.00 14.63% A Wheat, Kansas City $ per Bushel 7.26 6.99 3.86% 6.16 17.86% I Soybeans, S. Iowa $ per Bushel 14.61 14.24 2.60% 14.46 1.04% N Soybn Meal, 48% Decatur $ per Ton 411.50 407.10 1.08% 388.10 6.03% * Chicken & turkey slaughter & production are 1 week earlier than the date at the top of this sheet. ** Cow and sow slaughter reflect levels from two weeks ago due to reporting lag. The Daily Livestock Report is made possible with support from readers like you. If you enjoy this report, find if valuable and would like to sustain it going forward, consider becoming a contributor. Just go to www.DailyLivestockReport.com to contribute by credit card or send your check to The Daily Livestock Report, P.O. Box 2, Adel, IA 50003. Thank you for your support!