
More Related Content
What's hot
What's hot (20)
Viewers also liked
Viewers also liked (13)
Similar to Daily livestock report feb 19 2013
Similar to Daily livestock report feb 19 2013 (20)
More from joseleorcasita
More from joseleorcasita (20)
Daily livestock report feb 19 2013
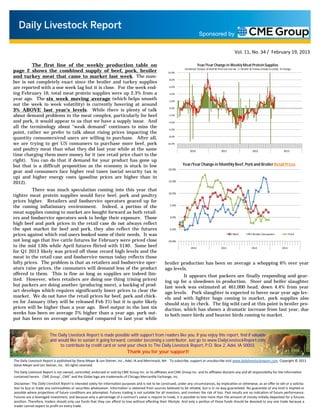
- 1. Sponsored by Vol. 11, No. 34 / February 19, 2013 The first line of the weekly production table on Year/Year Change in Weekly Meat Protein Supplies page 2 shows the combined supply of beef, pork, broiler 10.0% Combined Output of Beef & Pork (carcass wt. ) + Broiler & Turkey (ready-to-cook), % change and turkey meat that came to market last week. The num- 8.0% ber is not completely exact since the broiler and turkey supplies are reported with a one week lag but it is close. For the week end- 6.0% ing February 16, total meat protein supplies were up 2.3% from a 4.0% year ago. The six week moving average (which helps smooth 2.0% out the week to week volatility) is currently hovering at around 3% ABOVE last year’s levels. While there is plenty of talk 0.0% about demand problems in the meat complex, particularly for beef -2.0% and pork, it would appear to us that we have a supply issue. And -4.0% all the terminology about “weak demand” continues to miss the -6.0% point, rather we prefer to talk about rising prices impacting the quantity consumers/end users are willing to purchase. After all, -8.0% we are trying to get US consumers to purchase more beef, pork -10.0% and poultry meat than what they did last year while at the same 2010 2011 2012 2013 time charging them more money for it (see retail price chart to the right). You can do that if demand for your product has gone up but that is a difficult proposition as the economy is stuck in low Year/Year Change in Monthly Beef, Pork and Broiler Retail Prices 20.0% gear and consumers face higher real taxes (social security tax is up) and higher energy costs (gasoline prices are higher than in 2012). 15.0% There was much speculation coming into this year that 10.0% tighter meat protein supplies would force beef, pork and poultry prices higher. Retailers and foodservice operators geared up for the coming inflationary environment. Indeed, a portion of the 5.0% meat supplies coming to market are bought forward as both retail- ers and foodservice operators seek to hedge their exposure. Those 0.0% high beef and pork prices in the retail case do not always reflect the spot market for beef and pork, they also reflect the futures -5.0% prices against which end users booked some of their needs. It was Beef Broiler Composite Pork not long ago that live cattle futures for February were priced close -10.0% to the mid 130s while April futures flirted with $140. Some beef 2010 2011 2012 2013 for Q1 2013 likely was priced off those record high levels and the meat in the retail case and foodservice menus today reflects those lofty prices. The problem is that as retailers and foodservice oper- broiler production has been on average a whopping 6% over year ators raise prices, the consumers will demand less of the product ago levels. offered to them. This is fine as long as supplies are indeed lim- It appears that packers are finally responding and gear- ited. However, when retailers are doing one thing (rising prices) ing up for a slowdown in production. Steer and heifer slaughter but packers are doing another (producing more), a backlog of prod- last week was estimated at 461,000 head, down 4.4% from year uct develops which requires significantly lower prices to clear the ago levels. Pork slaughter is expected to hover near year ago lev- market. We do not have the retail prices for beef, pork and chick- els and with lighter hogs coming to market, pork supplies also en for January (they will be released Feb 21) but it is quite likely should stay in check. The big wild card at this point is broiler pro- prices will be higher than a year ago. Beef output in the last six duction, which has shown a dramatic increase from last year, due weeks has been on average 2% higher than a year ago, pork out- to both more birds and heavier birds coming to market. put has been on average unchanged compared to last year while The Daily Livestock Report is made possible with support from readers like you. If you enjoy this report, find if valuable and would like to sustain it going forward, consider becoming a contributor. Just go to www.DailyLivestockReport.com to contribute by credit card or send your check to The Daily Livestock Report, P.O. Box 2, Adel, IA 50003. Thank you for your support! The Daily Livestock Report is published by Steve Meyer & Len Steiner, Inc., Adel, IA and Merrimack, NH. To subscribe, support or unsubscribe visit www.dailylivestockreport.com. Copyright © 2013 Steve Meyer and Len Steiner, Inc. All rights reserved. The Daily Livestock Report is not owned, controlled, endorsed or sold by CME Group Inc. or its affiliates and CME Group Inc. and its affiliates disclaim any and all responsibility for the informa on contained herein. CME Group®, CME® and the Globe logo are trademarks of Chicago Mercan le Exchange, Inc. Disclaimer: The Daily Livestock Report is intended solely for informa on purposes and is not to be construed, under any circumstances, by implica on or otherwise, as an offer to sell or a solicita- on to buy or trade any commodi es or securi es whatsoever. Informa on is obtained from sources believed to be reliable, but is in no way guaranteed. No guarantee of any kind is implied or possible where projec ons of future condi ons are a empted. Futures trading is not suitable for all investors, and involves the risk of loss. Past results are no indica on of future performance. Futures are a leveraged investment, and because only a percentage of a contract’s value is require to trade, it is possible to lose more than the amount of money ini ally deposited for a futures posi on. Therefore, traders should only use funds that they can afford to lose without affec ng their lifestyle. And only a por on of those funds should be devoted to any one trade because a trader cannot expect to profit on every trade.
- 2. Page 2 Sponsored by Vol. 11, No. 34 / February 19, 2013 PRODUCTION & PRICE SUMMARY Week Ending 2/16/2013 Current Y/Y % Item Units Week Last Week Pct. Change Last Year Pct. Change YTD Change 16-Feb-13 9-Feb-13 18-Feb-12 Total Red Meat & Poultry mil lbs., cwe 1,725 1,705 1.19% 1,687 2.27% 10,911 0.2% FI Slaughter Thou. Head 596 593 0.51% 610 -2.35% 4,105 -2.9% C FI Cow Slaughter ** Thou. Head 123 126 -1.87% 128 -4.01% 627 -3.9% A Avg. Live Weight Lbs. 1325 1330 -0.38% 1307 1.38% 1,329 1.8% T Avg. Dressed Weight Lbs. 802 799 0.38% 788 1.78% 801 2.1% T Beef Production Million Lbs. 476.7 472.8 0.82% 480.1 -0.71% 3,245 -2.0% L Live Fed Steer Price $ per cwt 122.79 124.87 -1.67% 128.03 -4.09% E Dressed Fed Steer Price $ per cwt 195.86 199.84 -1.99% 202.40 -3.23% OKC Feeder Steer, 600-700 $ per cwt N/A 157.18 N/A 167.57 N/A & Choice Beef Cutout $ per cwt 183.07 183.31 -0.13% 189.04 -3.16% Hide/Offal $ per cwt, live wt 13.62 13.62 0.00% 12.99 4.85% B Rib, Choice $ per cwt 272.44 269.24 1.19% 266.85 2.09% E Round, Choice $ per cwt 157.57 159.14 -0.99% 166.65 -5.45% E Chuck, Choice $ per cwt 159.12 158.68 0.28% 156.92 1.40% F Trimmings, 50% $ per cwt 65.53 64.45 1.68% 99.84 -34.36% Trimmings, 90% $ per cwt 213.20 212.56 0.30% 212.28 0.43% FI Slaughter Thou. Head 2,145 2,139 0.28% 2,151 -0.29% 14,672 -2.5% FI Sow Slaughter ** Thou. Head 55.3 57.3 -3.55% 56.9 -2.91% 275 -1.0% H Avg. Dressed Weight Lbs. 207.0 208.0 -0.48% 209.0 -0.96% 208 -0.6% O Pork Production Million Lbs. 444.6 443.9 0.16% 448.4 -0.85% 3,044 -3.0% G Iowa-S. Minn. Direct Wtd. Avg. 83.22 87.56 -4.96% 84.98 -2.07% S Natl. Base Carcass Price Wtd. Avg. 85.44 86.71 -1.46% 84.77 0.79% Natl. Net Carcass Price Wtd. Avg. 88.02 89.35 -1.49% 87.16 0.99% Pork Cutout 200 Lbs. 80.88 83.25 -2.85% 86.52 -6.52% Hams $ per cwt 64.18 67.43 -4.82% 65.83 -2.51% Loins $ per cwt 88.75 90.14 -1.54% 97.58 -9.05% Bellies $ per cwt 128.70 133.26 -3.42% 123.38 4.31% 72CL Pork Trim $ per cwt 57.26 63.81 -10.26% 72.27 -20.77% C Young Chicken Slaughter * Million Head 155.0 155.8 -0.48% 149.8 3.47% 901 1.3% H Avg. Weight (Live) Lbs. 5.88 5.81 1.20% 5.81 1.20% 5.84 2.0% I Chicken Production (RTC) Million Lbs. 692.8 687.8 0.72% 652.9 6.11% 3,998 4.7% C Eggs Set Million 196.7 198.0 -0.67% 195.5 0.61% 1,180 1.5% K Chicks Placed Million Head 162.4 162.2 0.13% 161.9 0.28% 977 0.9% E 12-City Broiler Price Composite 100.96 100.27 0.69% 90.09 12.07% N Georgia Dock Broiler Price 2.5-3 Lbs. 100.3 99.91 0.39% 90.58 10.73% Northeast Breast, B/S $/cwt 139.29 138.29 0.72% 123.31 12.96% Northeast Legs $/cwt 67.64 67.02 0.93% 72.65 -6.90% T Young Turkey Slaughter * Million Head 4.500 4.021 11.91% 4.191 7.37% 24.833 0.7% U Avg. Live Weight Lbs. 30.83 31.19 -1.15% 31.44 -1.94% 31.47 -0.3% R Turkey Production (RTC) Million Lbs. 111.0 100.3 10.65% 105.4 5.35% 624 0.3% K Eastern Region Hen Price 8-16 Lbs. 95.00 95.00 0.00% 100.90 -5.85% G Corn, Omaha $ per Bushel 7.19 7.37 -2.44% 6.45 11.47% R DDGs, Minnesota $ per Ton 258.50 258.50 0.00% 190.50 35.70% A Wheat, Kansas City $ per Bushel 7.41 7.63 -2.88% 6.66 11.26% I Soybeans, S. Iowa $ per Bushel 14.51 15.20 -4.54% 12.68 14.43% N Soybn Meal, 48% Decatur $ per Ton 422.70 454.10 -6.91% 330.30 27.97% * Chicken & turkey slaughter & production are 1 week earlier than the date at the top of this sheet. ** Cow and sow slaughter reflect levels from two weeks ago due to reporting lag. The Daily Livestock Report is made possible with support from readers like you. If you enjoy reading this report and would like to sustain it going forward, consider becoming a contributor by going to our website: www.DailyLivestockReport.com Thank you for your support!