- US meat production was up slightly but remains down year-to-date. Hog and chicken production increased while beef production decreased.
- Livestock prices were mixed - feeder cattle up but fed cattle down slightly. Pork prices decreased across the board.
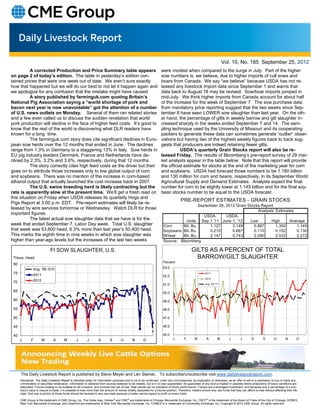
- Crop prices fell for corn, wheat, and soybeans on the week ahead of the upcoming USDA stocks report. Analyst estimates for the report were provided.
Pork Industry Economic Update, Managing Inputs and Marketing: Where Do We Go From Here? Dr. Steve Meyer, Paragon Economics, Inc., from the 2009 Iowa Pork Congress, January 28 - 29, Des Moines, Iowa, USA.
Pork Industry Economic Update, Managing Inputs and Marketing: Where Do We Go From Here? Dr. Steve Meyer, Paragon Economics, Inc., from the 2009 Iowa Pork Congress, January 28 - 29, Des Moines, Iowa, USA.
In the ever-changing agriculture markets, risk management requires timely, accurate and independent assessment of global crop production.
This is what Lanworth delivers.
Dr. Steve Meyer - Show Me the Money: Economic OutlookJohn Blue
Show Me the Money: Economic Outlook - Dr. Steve Meyer, President of Paragon Economics, from the 2013 Iowa Pork Congress, January 23-24, Des Moines, IA, USA.
More presentations at http://www.swinecast.com/2013-iowa-pork-congress
Market Outlook - Dr. Steve Meyer, livestock and agricultural economist, Paragon Economics, Inc. , from the 2012 Minnesota Pork Congress, January 18-19, Minneapolis, MN, USA.
Dr. Steve Meyer - Market Outlook From The MN Pork CongressJohn Blue
Market Outlook From The MN Pork Congress - Dr. Steve Meyer, Economist, Kerns & Associates, from the 2018 Minnesota Pork Congress, January 16 - 17, 2018, Minneapolis, MN, USA.
More presentations at http://www.swinecast.com/2018-minnesota-pork-congress