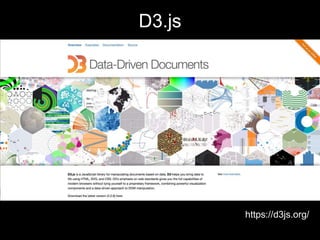
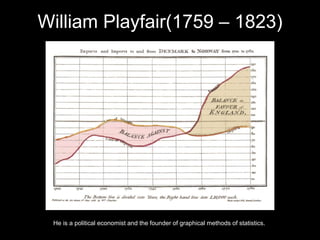
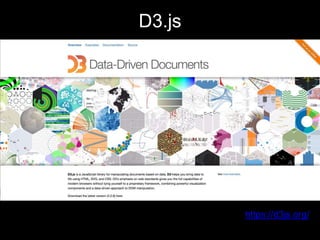
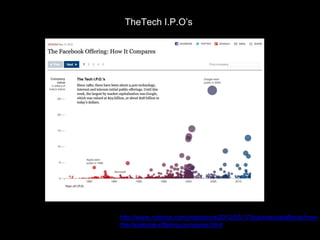
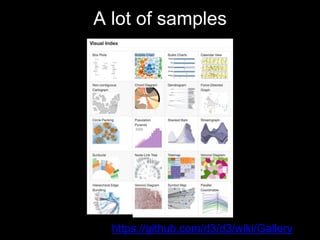
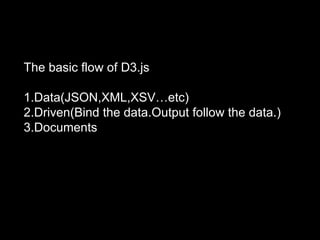
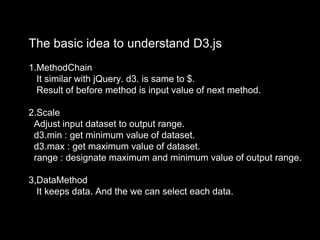
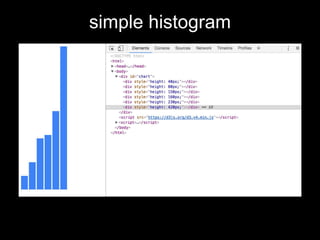
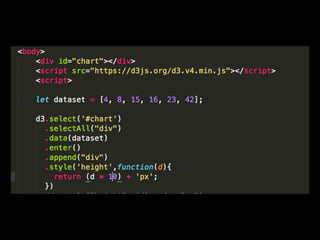
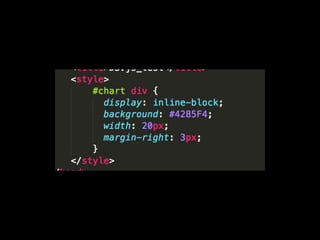
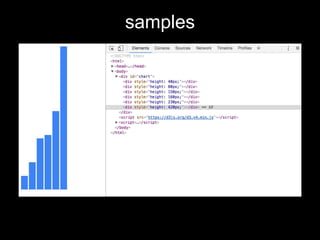
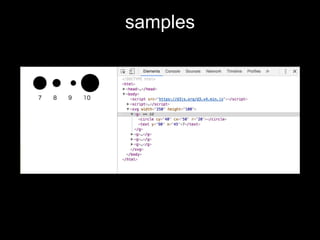
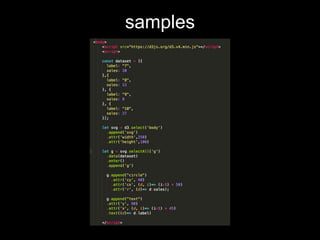
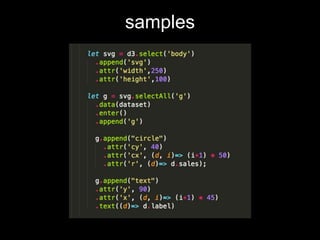
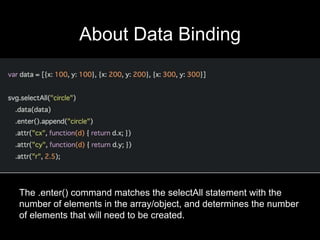
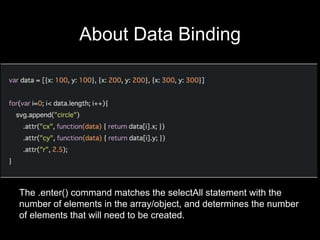
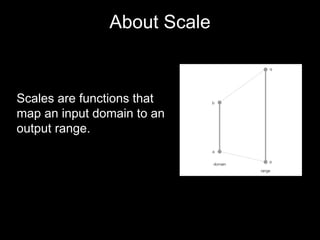
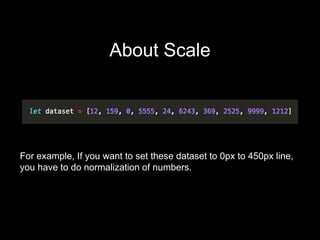
SlideShare a Scribd company logo
D3.js for beginners
What is data visualization ?
Kota Fujishiro
Front end web developer
Internship at LIG.inc
D3.js
https://d3js.org/
What’s data visualization ?
You can understand something
vaguely at first sight.
William Playfair(1759 – 1823)
He is a political economist and the founder of graphical methods of statistics.
www.nytimes.com/interactive/2012/05/17/business/dealbook/how-
the-facebook-offering-compares.html
How to make data visualization?
D3.js
https://d3js.org/
The Most Detailed Maps
You’ll See From the Midterm Elections
http://www.nytimes.com/interactive/2014/11/04/upshot/senate-maps.html
TheTech I.P.O’s
http://www.nytimes.com/interactive/2012/05/17/business/dealbook/how-
the-facebook-offering-compares.html
A lot of samples
https://github.com/d3/d3/wiki/Gallery
The basic flow of D3.js
1.Data(JSON,XML,XSV…etc)
2.Driven(Bind the data.Output follow the data.)
3.Documents
The basic idea to understand D3.js
1.MethodChain
It similar with jQuery. d3. is same to $.
Result of before method is input value of next method.
2.Scale
Adjust input dataset to output range.
d3.min : get minimum value of dataset.
d3.max : get maximum value of dataset.
range : designate maximum and minimum value of output range.
3,DataMethod
It keeps data. And the we can select each data.
simple histogram
samples
samples
samples
samples
samples
About Data Binding
The .enter() command matches the selectAll statement with the
number of elements in the array/object, and determines the number
of elements that will need to be created.
About Data Binding
The .enter() command matches the selectAll statement with the
number of elements in the array/object, and determines the number
of elements that will need to be created.
About Scale
Scales are functions that
map an input domain to an
output range.
About Scale
For example, If you want to set these dataset to 0px to 450px line,
you have to do normalization of numbers.
D3.js
https://d3js.org/
Future Tasks
https://d3js.org/
1. Get the data using web scraping and write
Node.js. Express dynamic data visualization.
2. Learn how to write React.js with D3.js
Thanks!

More Related Content

Viewers also liked

Introduction to D3.js
Introduction to D3.jsIntroduction to D3.js
Introduction to D3.js
Oleksii Prohonnyi
 
D3 js
D3 jsD3 js
D3 js
Ynon Perek
 
D3.js workshop
D3.js workshopD3.js workshop
D3.js workshop
Anton Katunin
 
Dreamforce 2014 - Introduction to d3.js
Dreamforce 2014 - Introduction to d3.jsDreamforce 2014 - Introduction to d3.js
Dreamforce 2014 - Introduction to d3.js
ramanathanp82
 
Vaidas Morkevičius - Open Data for Enhancing the Quality of Research
Vaidas Morkevičius - Open Data for Enhancing the Quality of ResearchVaidas Morkevičius - Open Data for Enhancing the Quality of Research
Vaidas Morkevičius - Open Data for Enhancing the Quality of Research
Aidis Stukas
 
Clase tatiana adriana
Clase tatiana adrianaClase tatiana adriana
Clase tatiana adriana
tatiana-vasquez
 
G. Tautkeviciene and I. Ceseviciute. Open Science in Horizon 2020: Open Aire ...
G. Tautkeviciene and I. Ceseviciute. Open Science in Horizon 2020: Open Aire ...G. Tautkeviciene and I. Ceseviciute. Open Science in Horizon 2020: Open Aire ...
G. Tautkeviciene and I. Ceseviciute. Open Science in Horizon 2020: Open Aire ...
Aidis Stukas
 
Mantas Zimnickas - How Open is Lithuanian Government data? atviriduomenys.lt
Mantas Zimnickas - How Open is Lithuanian Government data? atviriduomenys.lt Mantas Zimnickas - How Open is Lithuanian Government data? atviriduomenys.lt
Mantas Zimnickas - How Open is Lithuanian Government data? atviriduomenys.lt
Aidis Stukas
 
Interactive Data Visualization (with D3.js)
Interactive Data Visualization (with D3.js)Interactive Data Visualization (with D3.js)
Interactive Data Visualization (with D3.js)
Lynn Cherny
 
Saulius Gražulis The Crystalography Open Database
Saulius Gražulis  The Crystalography Open DatabaseSaulius Gražulis  The Crystalography Open Database
Saulius Gražulis The Crystalography Open Database
Aidis Stukas
 
„Kūrybinės partnerystės" (2015)
„Kūrybinės partnerystės" (2015)„Kūrybinės partnerystės" (2015)
„Kūrybinės partnerystės" (2015)
Kūrybinės Partnerystės
 
Big Data Introduction to D3
Big Data Introduction to D3Big Data Introduction to D3
Big Data Introduction to D3
Vishal Kumar
 
dr. Agnė Paliokaitė (VisionaryAnalytics) Profesinė doktorantūra – įrankis mok...
dr. Agnė Paliokaitė (VisionaryAnalytics) Profesinė doktorantūra – įrankis mok...dr. Agnė Paliokaitė (VisionaryAnalytics) Profesinė doktorantūra – įrankis mok...
dr. Agnė Paliokaitė (VisionaryAnalytics) Profesinė doktorantūra – įrankis mok...
Aidis Stukas
 
GraphQL: Enabling a new generation of API developer tools
GraphQL: Enabling a new generation of API developer toolsGraphQL: Enabling a new generation of API developer tools
GraphQL: Enabling a new generation of API developer tools
Sashko Stubailo
 
Brigita Serafinavičiūtė. Open science – The Essential Ingredient of Our Future
Brigita Serafinavičiūtė. Open science – The Essential Ingredient of Our FutureBrigita Serafinavičiūtė. Open science – The Essential Ingredient of Our Future
Brigita Serafinavičiūtė. Open science – The Essential Ingredient of Our Future
Aidis Stukas
 
GraphQL
GraphQLGraphQL
GraphQL
Joel Corrêa
 
GraphQL Story: Intro To GraphQL
GraphQL Story: Intro To GraphQLGraphQL Story: Intro To GraphQL
GraphQL Story: Intro To GraphQL
Riza Fahmi
 
Machine Intelligence at Google Scale: TensorFlow
Machine Intelligence at Google Scale: TensorFlowMachine Intelligence at Google Scale: TensorFlow
Machine Intelligence at Google Scale: TensorFlow
DataWorks Summit/Hadoop Summit
 
THE SMARTEST INVESTMENT: A FRAMEWORK FOR BUSINESS ENGAGEMENT IN EDUCATION
THE SMARTEST INVESTMENT: A FRAMEWORK FOR BUSINESS ENGAGEMENT IN EDUCATIONTHE SMARTEST INVESTMENT: A FRAMEWORK FOR BUSINESS ENGAGEMENT IN EDUCATION
THE SMARTEST INVESTMENT: A FRAMEWORK FOR BUSINESS ENGAGEMENT IN EDUCATION
UNICEF Education
 
Tracionalidades
TracionalidadesTracionalidades

Viewers also liked (20)

Introduction to D3.js
Introduction to D3.jsIntroduction to D3.js
Introduction to D3.js
 
D3 js
D3 jsD3 js
D3 js
 
D3.js workshop
D3.js workshopD3.js workshop
D3.js workshop
 
Dreamforce 2014 - Introduction to d3.js
Dreamforce 2014 - Introduction to d3.jsDreamforce 2014 - Introduction to d3.js
Dreamforce 2014 - Introduction to d3.js
 
Vaidas Morkevičius - Open Data for Enhancing the Quality of Research
Vaidas Morkevičius - Open Data for Enhancing the Quality of ResearchVaidas Morkevičius - Open Data for Enhancing the Quality of Research
Vaidas Morkevičius - Open Data for Enhancing the Quality of Research
 
Clase tatiana adriana
Clase tatiana adrianaClase tatiana adriana
Clase tatiana adriana
 
G. Tautkeviciene and I. Ceseviciute. Open Science in Horizon 2020: Open Aire ...
G. Tautkeviciene and I. Ceseviciute. Open Science in Horizon 2020: Open Aire ...G. Tautkeviciene and I. Ceseviciute. Open Science in Horizon 2020: Open Aire ...
G. Tautkeviciene and I. Ceseviciute. Open Science in Horizon 2020: Open Aire ...
 
Mantas Zimnickas - How Open is Lithuanian Government data? atviriduomenys.lt
Mantas Zimnickas - How Open is Lithuanian Government data? atviriduomenys.lt Mantas Zimnickas - How Open is Lithuanian Government data? atviriduomenys.lt
Mantas Zimnickas - How Open is Lithuanian Government data? atviriduomenys.lt
 
Interactive Data Visualization (with D3.js)
Interactive Data Visualization (with D3.js)Interactive Data Visualization (with D3.js)
Interactive Data Visualization (with D3.js)
 
Saulius Gražulis The Crystalography Open Database
Saulius Gražulis  The Crystalography Open DatabaseSaulius Gražulis  The Crystalography Open Database
Saulius Gražulis The Crystalography Open Database
 
„Kūrybinės partnerystės" (2015)
„Kūrybinės partnerystės" (2015)„Kūrybinės partnerystės" (2015)
„Kūrybinės partnerystės" (2015)
 
Big Data Introduction to D3
Big Data Introduction to D3Big Data Introduction to D3
Big Data Introduction to D3
 
dr. Agnė Paliokaitė (VisionaryAnalytics) Profesinė doktorantūra – įrankis mok...
dr. Agnė Paliokaitė (VisionaryAnalytics) Profesinė doktorantūra – įrankis mok...dr. Agnė Paliokaitė (VisionaryAnalytics) Profesinė doktorantūra – įrankis mok...
dr. Agnė Paliokaitė (VisionaryAnalytics) Profesinė doktorantūra – įrankis mok...
 
GraphQL: Enabling a new generation of API developer tools
GraphQL: Enabling a new generation of API developer toolsGraphQL: Enabling a new generation of API developer tools
GraphQL: Enabling a new generation of API developer tools
 
Brigita Serafinavičiūtė. Open science – The Essential Ingredient of Our Future
Brigita Serafinavičiūtė. Open science – The Essential Ingredient of Our FutureBrigita Serafinavičiūtė. Open science – The Essential Ingredient of Our Future
Brigita Serafinavičiūtė. Open science – The Essential Ingredient of Our Future
 
GraphQL
GraphQLGraphQL
GraphQL
 
GraphQL Story: Intro To GraphQL
GraphQL Story: Intro To GraphQLGraphQL Story: Intro To GraphQL
GraphQL Story: Intro To GraphQL
 
Machine Intelligence at Google Scale: TensorFlow
Machine Intelligence at Google Scale: TensorFlowMachine Intelligence at Google Scale: TensorFlow
Machine Intelligence at Google Scale: TensorFlow
 
THE SMARTEST INVESTMENT: A FRAMEWORK FOR BUSINESS ENGAGEMENT IN EDUCATION
THE SMARTEST INVESTMENT: A FRAMEWORK FOR BUSINESS ENGAGEMENT IN EDUCATIONTHE SMARTEST INVESTMENT: A FRAMEWORK FOR BUSINESS ENGAGEMENT IN EDUCATION
THE SMARTEST INVESTMENT: A FRAMEWORK FOR BUSINESS ENGAGEMENT IN EDUCATION
 
Tracionalidades
TracionalidadesTracionalidades
Tracionalidades
 

Similar to D3.js for beginners

Georgina Armstrong - Data Visualisations. Making Boring Data Exciting and Emp...
Georgina Armstrong - Data Visualisations. Making Boring Data Exciting and Emp...Georgina Armstrong - Data Visualisations. Making Boring Data Exciting and Emp...
Georgina Armstrong - Data Visualisations. Making Boring Data Exciting and Emp...
Saratoga
 
Strata Conference NYC 2013 Full Version
Strata Conference NYC 2013 Full VersionStrata Conference NYC 2013 Full Version
Strata Conference NYC 2013 Full Version
Taewook Eom
 
From Dataism to Customer Data Platform
From Dataism to Customer Data PlatformFrom Dataism to Customer Data Platform
From Dataism to Customer Data Platform
Trieu Nguyen
 
Visualising Data with Code
Visualising Data with CodeVisualising Data with Code
Visualising Data with Code
Ri Liu
 
How Data Visualization Enhances the News
How Data Visualization Enhances the NewsHow Data Visualization Enhances the News
How Data Visualization Enhances the News
Inside Analysis
 
Strata Conference NYC 2013
Strata Conference NYC 2013Strata Conference NYC 2013
Strata Conference NYC 2013
Taewook Eom
 
"What is Data Science?" High School Version
"What is Data Science?" High School Version"What is Data Science?" High School Version
"What is Data Science?" High School Version
Renee Teate
 
Getting started with infographics
Getting started with infographicsGetting started with infographics
Getting started with infographics
Lorena Swetnam
 
Tableau Tutorial Complete by Rohit Dubey
Tableau Tutorial Complete by Rohit DubeyTableau Tutorial Complete by Rohit Dubey
Tableau Tutorial Complete by Rohit Dubey
kiranrajat
 
Visualizing data spring2012
Visualizing data spring2012Visualizing data spring2012
Visualizing data spring2012
Lisa Kurt
 
Explore Data: Data Science + Visualization
Explore Data: Data Science + VisualizationExplore Data: Data Science + Visualization
Explore Data: Data Science + Visualization
Roelof Pieters
 
Scaling ideas and principles
Scaling ideas and principlesScaling ideas and principles
Scaling ideas and principles
Christian Heilmann
 
#EnterpriseBrain EN - #spsnh
#EnterpriseBrain EN - #spsnh#EnterpriseBrain EN - #spsnh
#EnterpriseBrain EN - #spsnh
Nicolas Georgeault
 
From dataism to customer data platform from Triều Nguyễn
From dataism to customer data platform from Triều NguyễnFrom dataism to customer data platform from Triều Nguyễn
From dataism to customer data platform from Triều Nguyễn
Duy, Vo Hoang
 
Brief introduction to data visualization
Brief introduction to data visualizationBrief introduction to data visualization
Brief introduction to data visualization
Zach Gemignani
 
Introduction to Data Visualization - Code Heroku
Introduction to Data Visualization - Code HerokuIntroduction to Data Visualization - Code Heroku
Introduction to Data Visualization - Code Heroku
codeheroku
 
Data Visualization
Data VisualizationData Visualization
Data Visualization
Tarek Amr
 
"What is Data Science?"
"What is Data Science?""What is Data Science?"
"What is Data Science?"
Renee Teate
 
Worst Practices of SharePoint 2010
Worst Practices of SharePoint 2010Worst Practices of SharePoint 2010
Worst Practices of SharePoint 2010
Dan Usher
 
Data Visualization
Data Visualization Data Visualization
Data Visualization
Madelyn Cox
 

Similar to D3.js for beginners (20)

Georgina Armstrong - Data Visualisations. Making Boring Data Exciting and Emp...
Georgina Armstrong - Data Visualisations. Making Boring Data Exciting and Emp...Georgina Armstrong - Data Visualisations. Making Boring Data Exciting and Emp...
Georgina Armstrong - Data Visualisations. Making Boring Data Exciting and Emp...
 
Strata Conference NYC 2013 Full Version
Strata Conference NYC 2013 Full VersionStrata Conference NYC 2013 Full Version
Strata Conference NYC 2013 Full Version
 
From Dataism to Customer Data Platform
From Dataism to Customer Data PlatformFrom Dataism to Customer Data Platform
From Dataism to Customer Data Platform
 
Visualising Data with Code
Visualising Data with CodeVisualising Data with Code
Visualising Data with Code
 
How Data Visualization Enhances the News
How Data Visualization Enhances the NewsHow Data Visualization Enhances the News
How Data Visualization Enhances the News
 
Strata Conference NYC 2013
Strata Conference NYC 2013Strata Conference NYC 2013
Strata Conference NYC 2013
 
"What is Data Science?" High School Version
"What is Data Science?" High School Version"What is Data Science?" High School Version
"What is Data Science?" High School Version
 
Getting started with infographics
Getting started with infographicsGetting started with infographics
Getting started with infographics
 
Tableau Tutorial Complete by Rohit Dubey
Tableau Tutorial Complete by Rohit DubeyTableau Tutorial Complete by Rohit Dubey
Tableau Tutorial Complete by Rohit Dubey
 
Visualizing data spring2012
Visualizing data spring2012Visualizing data spring2012
Visualizing data spring2012
 
Explore Data: Data Science + Visualization
Explore Data: Data Science + VisualizationExplore Data: Data Science + Visualization
Explore Data: Data Science + Visualization
 
Scaling ideas and principles
Scaling ideas and principlesScaling ideas and principles
Scaling ideas and principles
 
#EnterpriseBrain EN - #spsnh
#EnterpriseBrain EN - #spsnh#EnterpriseBrain EN - #spsnh
#EnterpriseBrain EN - #spsnh
 
From dataism to customer data platform from Triều Nguyễn
From dataism to customer data platform from Triều NguyễnFrom dataism to customer data platform from Triều Nguyễn
From dataism to customer data platform from Triều Nguyễn
 
Brief introduction to data visualization
Brief introduction to data visualizationBrief introduction to data visualization
Brief introduction to data visualization
 
Introduction to Data Visualization - Code Heroku
Introduction to Data Visualization - Code HerokuIntroduction to Data Visualization - Code Heroku
Introduction to Data Visualization - Code Heroku
 
Data Visualization
Data VisualizationData Visualization
Data Visualization
 
"What is Data Science?"
"What is Data Science?""What is Data Science?"
"What is Data Science?"
 
Worst Practices of SharePoint 2010
Worst Practices of SharePoint 2010Worst Practices of SharePoint 2010
Worst Practices of SharePoint 2010
 
Data Visualization
Data Visualization Data Visualization
Data Visualization
 

Recently uploaded

FREE A4 Cyber Security Awareness Posters-Social Engineering part 3
FREE A4 Cyber Security Awareness  Posters-Social Engineering part 3FREE A4 Cyber Security Awareness  Posters-Social Engineering part 3
FREE A4 Cyber Security Awareness Posters-Social Engineering part 3
Data Hops
 
Apps Break Data
Apps Break DataApps Break Data
Apps Break Data
Ivo Velitchkov
 
Fueling AI with Great Data with Airbyte Webinar
Fueling AI with Great Data with Airbyte WebinarFueling AI with Great Data with Airbyte Webinar
Fueling AI with Great Data with Airbyte Webinar
Zilliz
 
Astute Business Solutions | Oracle Cloud Partner |
Astute Business Solutions | Oracle Cloud Partner |Astute Business Solutions | Oracle Cloud Partner |
Astute Business Solutions | Oracle Cloud Partner |
AstuteBusiness
 
WeTestAthens: Postman's AI & Automation Techniques
WeTestAthens: Postman's AI & Automation TechniquesWeTestAthens: Postman's AI & Automation Techniques
WeTestAthens: Postman's AI & Automation Techniques
Postman
 
Energy Efficient Video Encoding for Cloud and Edge Computing Instances
Energy Efficient Video Encoding for Cloud and Edge Computing InstancesEnergy Efficient Video Encoding for Cloud and Edge Computing Instances
Energy Efficient Video Encoding for Cloud and Edge Computing Instances
Alpen-Adria-Universität
 
GraphRAG for Life Science to increase LLM accuracy
GraphRAG for Life Science to increase LLM accuracyGraphRAG for Life Science to increase LLM accuracy
GraphRAG for Life Science to increase LLM accuracy
Tomaz Bratanic
 
Monitoring and Managing Anomaly Detection on OpenShift.pdf
Monitoring and Managing Anomaly Detection on OpenShift.pdfMonitoring and Managing Anomaly Detection on OpenShift.pdf
Monitoring and Managing Anomaly Detection on OpenShift.pdf
Tosin Akinosho
 
Y-Combinator seed pitch deck template PP
Y-Combinator seed pitch deck template PPY-Combinator seed pitch deck template PP
Y-Combinator seed pitch deck template PP
c5vrf27qcz
 
Skybuffer SAM4U tool for SAP license adoption
Skybuffer SAM4U tool for SAP license adoptionSkybuffer SAM4U tool for SAP license adoption
Skybuffer SAM4U tool for SAP license adoption
Tatiana Kojar
 
5th LF Energy Power Grid Model Meet-up Slides
5th LF Energy Power Grid Model Meet-up Slides5th LF Energy Power Grid Model Meet-up Slides
5th LF Energy Power Grid Model Meet-up Slides
DanBrown980551
 
June Patch Tuesday
June Patch TuesdayJune Patch Tuesday
June Patch Tuesday
Ivanti
 
Building Production Ready Search Pipelines with Spark and Milvus
Building Production Ready Search Pipelines with Spark and MilvusBuilding Production Ready Search Pipelines with Spark and Milvus
Building Production Ready Search Pipelines with Spark and Milvus
Zilliz
 
9 CEO's who hit $100m ARR Share Their Top Growth Tactics Nathan Latka, Founde...
9 CEO's who hit $100m ARR Share Their Top Growth Tactics Nathan Latka, Founde...9 CEO's who hit $100m ARR Share Their Top Growth Tactics Nathan Latka, Founde...
9 CEO's who hit $100m ARR Share Their Top Growth Tactics Nathan Latka, Founde...
saastr
 
"Choosing proper type of scaling", Olena Syrota
"Choosing proper type of scaling", Olena Syrota"Choosing proper type of scaling", Olena Syrota
"Choosing proper type of scaling", Olena Syrota
Fwdays
 
Columbus Data & Analytics Wednesdays - June 2024
Columbus Data & Analytics Wednesdays - June 2024Columbus Data & Analytics Wednesdays - June 2024
Columbus Data & Analytics Wednesdays - June 2024
Jason Packer
 
Introduction of Cybersecurity with OSS at Code Europe 2024
Introduction of Cybersecurity with OSS  at Code Europe 2024Introduction of Cybersecurity with OSS  at Code Europe 2024
Introduction of Cybersecurity with OSS at Code Europe 2024
Hiroshi SHIBATA
 
Deep Dive: AI-Powered Marketing to Get More Leads and Customers with HyperGro...
Deep Dive: AI-Powered Marketing to Get More Leads and Customers with HyperGro...Deep Dive: AI-Powered Marketing to Get More Leads and Customers with HyperGro...
Deep Dive: AI-Powered Marketing to Get More Leads and Customers with HyperGro...
saastr
 
TrustArc Webinar - 2024 Global Privacy Survey
TrustArc Webinar - 2024 Global Privacy SurveyTrustArc Webinar - 2024 Global Privacy Survey
TrustArc Webinar - 2024 Global Privacy Survey
TrustArc
 
GraphRAG for LifeSciences Hands-On with the Clinical Knowledge Graph
GraphRAG for LifeSciences Hands-On with the Clinical Knowledge GraphGraphRAG for LifeSciences Hands-On with the Clinical Knowledge Graph
GraphRAG for LifeSciences Hands-On with the Clinical Knowledge Graph
Neo4j
 

Recently uploaded (20)

FREE A4 Cyber Security Awareness Posters-Social Engineering part 3
FREE A4 Cyber Security Awareness  Posters-Social Engineering part 3FREE A4 Cyber Security Awareness  Posters-Social Engineering part 3
FREE A4 Cyber Security Awareness Posters-Social Engineering part 3
 
Apps Break Data
Apps Break DataApps Break Data
Apps Break Data
 
Fueling AI with Great Data with Airbyte Webinar
Fueling AI with Great Data with Airbyte WebinarFueling AI with Great Data with Airbyte Webinar
Fueling AI with Great Data with Airbyte Webinar
 
Astute Business Solutions | Oracle Cloud Partner |
Astute Business Solutions | Oracle Cloud Partner |Astute Business Solutions | Oracle Cloud Partner |
Astute Business Solutions | Oracle Cloud Partner |
 
WeTestAthens: Postman's AI & Automation Techniques
WeTestAthens: Postman's AI & Automation TechniquesWeTestAthens: Postman's AI & Automation Techniques
WeTestAthens: Postman's AI & Automation Techniques
 
Energy Efficient Video Encoding for Cloud and Edge Computing Instances
Energy Efficient Video Encoding for Cloud and Edge Computing InstancesEnergy Efficient Video Encoding for Cloud and Edge Computing Instances
Energy Efficient Video Encoding for Cloud and Edge Computing Instances
 
GraphRAG for Life Science to increase LLM accuracy
GraphRAG for Life Science to increase LLM accuracyGraphRAG for Life Science to increase LLM accuracy
GraphRAG for Life Science to increase LLM accuracy
 
Monitoring and Managing Anomaly Detection on OpenShift.pdf
Monitoring and Managing Anomaly Detection on OpenShift.pdfMonitoring and Managing Anomaly Detection on OpenShift.pdf
Monitoring and Managing Anomaly Detection on OpenShift.pdf
 
Y-Combinator seed pitch deck template PP
Y-Combinator seed pitch deck template PPY-Combinator seed pitch deck template PP
Y-Combinator seed pitch deck template PP
 
Skybuffer SAM4U tool for SAP license adoption
Skybuffer SAM4U tool for SAP license adoptionSkybuffer SAM4U tool for SAP license adoption
Skybuffer SAM4U tool for SAP license adoption
 
5th LF Energy Power Grid Model Meet-up Slides
5th LF Energy Power Grid Model Meet-up Slides5th LF Energy Power Grid Model Meet-up Slides
5th LF Energy Power Grid Model Meet-up Slides
 
June Patch Tuesday
June Patch TuesdayJune Patch Tuesday
June Patch Tuesday
 
Building Production Ready Search Pipelines with Spark and Milvus
Building Production Ready Search Pipelines with Spark and MilvusBuilding Production Ready Search Pipelines with Spark and Milvus
Building Production Ready Search Pipelines with Spark and Milvus
 
9 CEO's who hit $100m ARR Share Their Top Growth Tactics Nathan Latka, Founde...
9 CEO's who hit $100m ARR Share Their Top Growth Tactics Nathan Latka, Founde...9 CEO's who hit $100m ARR Share Their Top Growth Tactics Nathan Latka, Founde...
9 CEO's who hit $100m ARR Share Their Top Growth Tactics Nathan Latka, Founde...
 
"Choosing proper type of scaling", Olena Syrota
"Choosing proper type of scaling", Olena Syrota"Choosing proper type of scaling", Olena Syrota
"Choosing proper type of scaling", Olena Syrota
 
Columbus Data & Analytics Wednesdays - June 2024
Columbus Data & Analytics Wednesdays - June 2024Columbus Data & Analytics Wednesdays - June 2024
Columbus Data & Analytics Wednesdays - June 2024
 
Introduction of Cybersecurity with OSS at Code Europe 2024
Introduction of Cybersecurity with OSS  at Code Europe 2024Introduction of Cybersecurity with OSS  at Code Europe 2024
Introduction of Cybersecurity with OSS at Code Europe 2024
 
Deep Dive: AI-Powered Marketing to Get More Leads and Customers with HyperGro...
Deep Dive: AI-Powered Marketing to Get More Leads and Customers with HyperGro...Deep Dive: AI-Powered Marketing to Get More Leads and Customers with HyperGro...
Deep Dive: AI-Powered Marketing to Get More Leads and Customers with HyperGro...
 
TrustArc Webinar - 2024 Global Privacy Survey
TrustArc Webinar - 2024 Global Privacy SurveyTrustArc Webinar - 2024 Global Privacy Survey
TrustArc Webinar - 2024 Global Privacy Survey
 
GraphRAG for LifeSciences Hands-On with the Clinical Knowledge Graph
GraphRAG for LifeSciences Hands-On with the Clinical Knowledge GraphGraphRAG for LifeSciences Hands-On with the Clinical Knowledge Graph
GraphRAG for LifeSciences Hands-On with the Clinical Knowledge Graph
 

D3.js for beginners