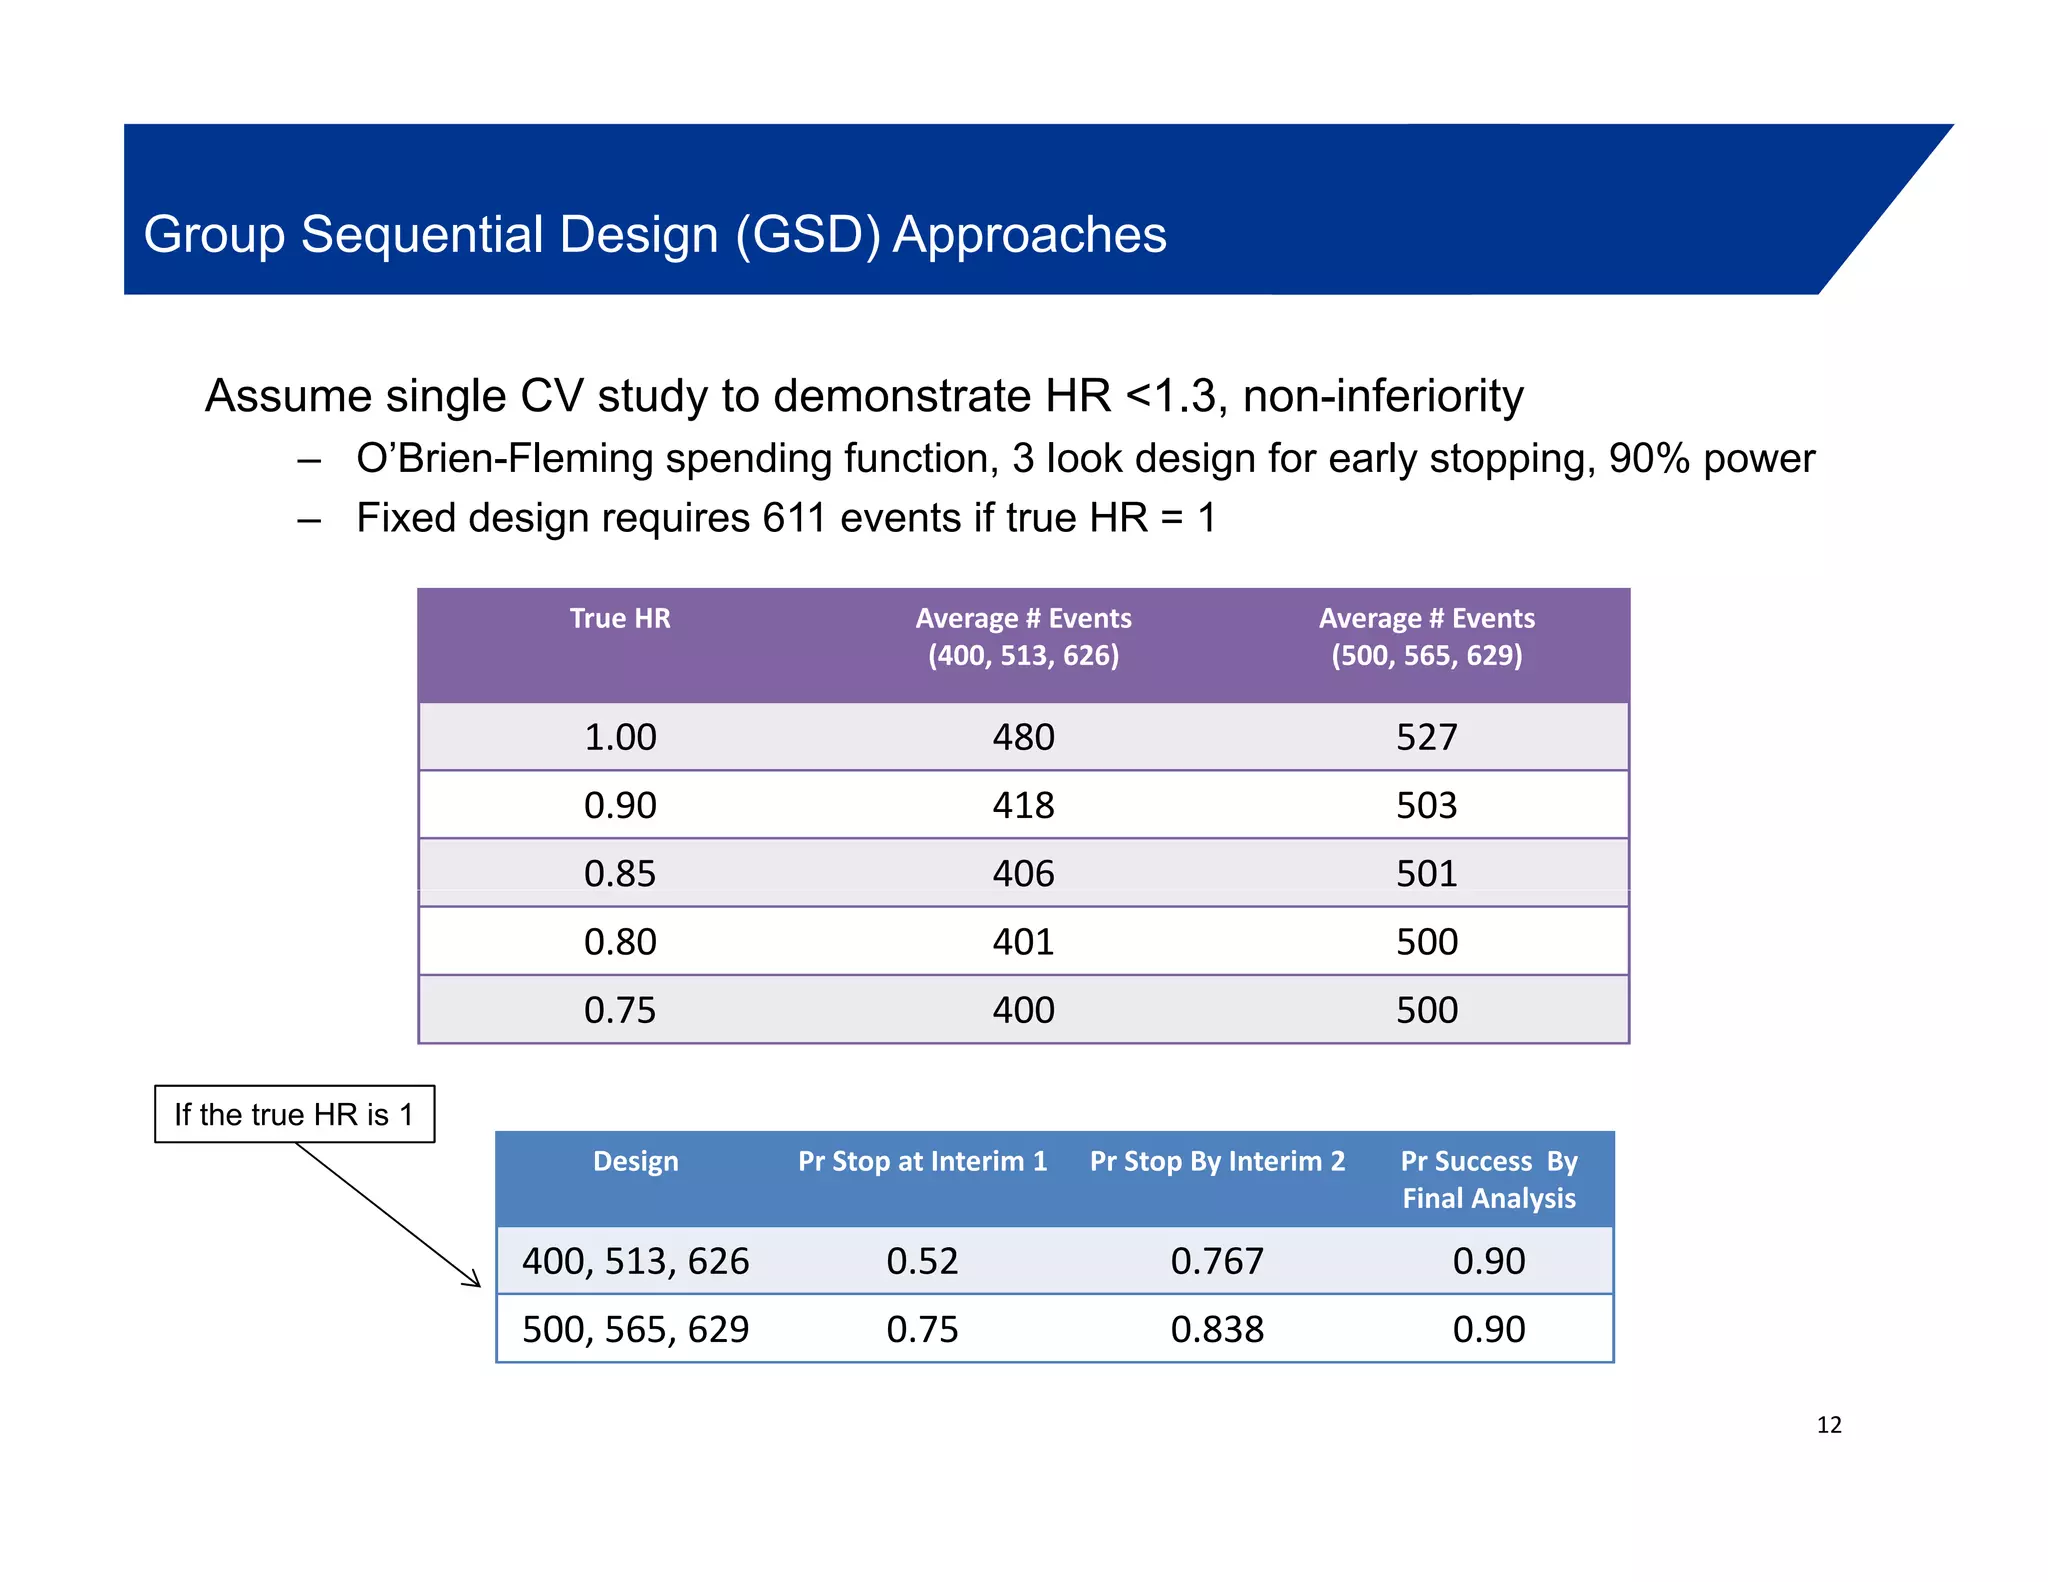
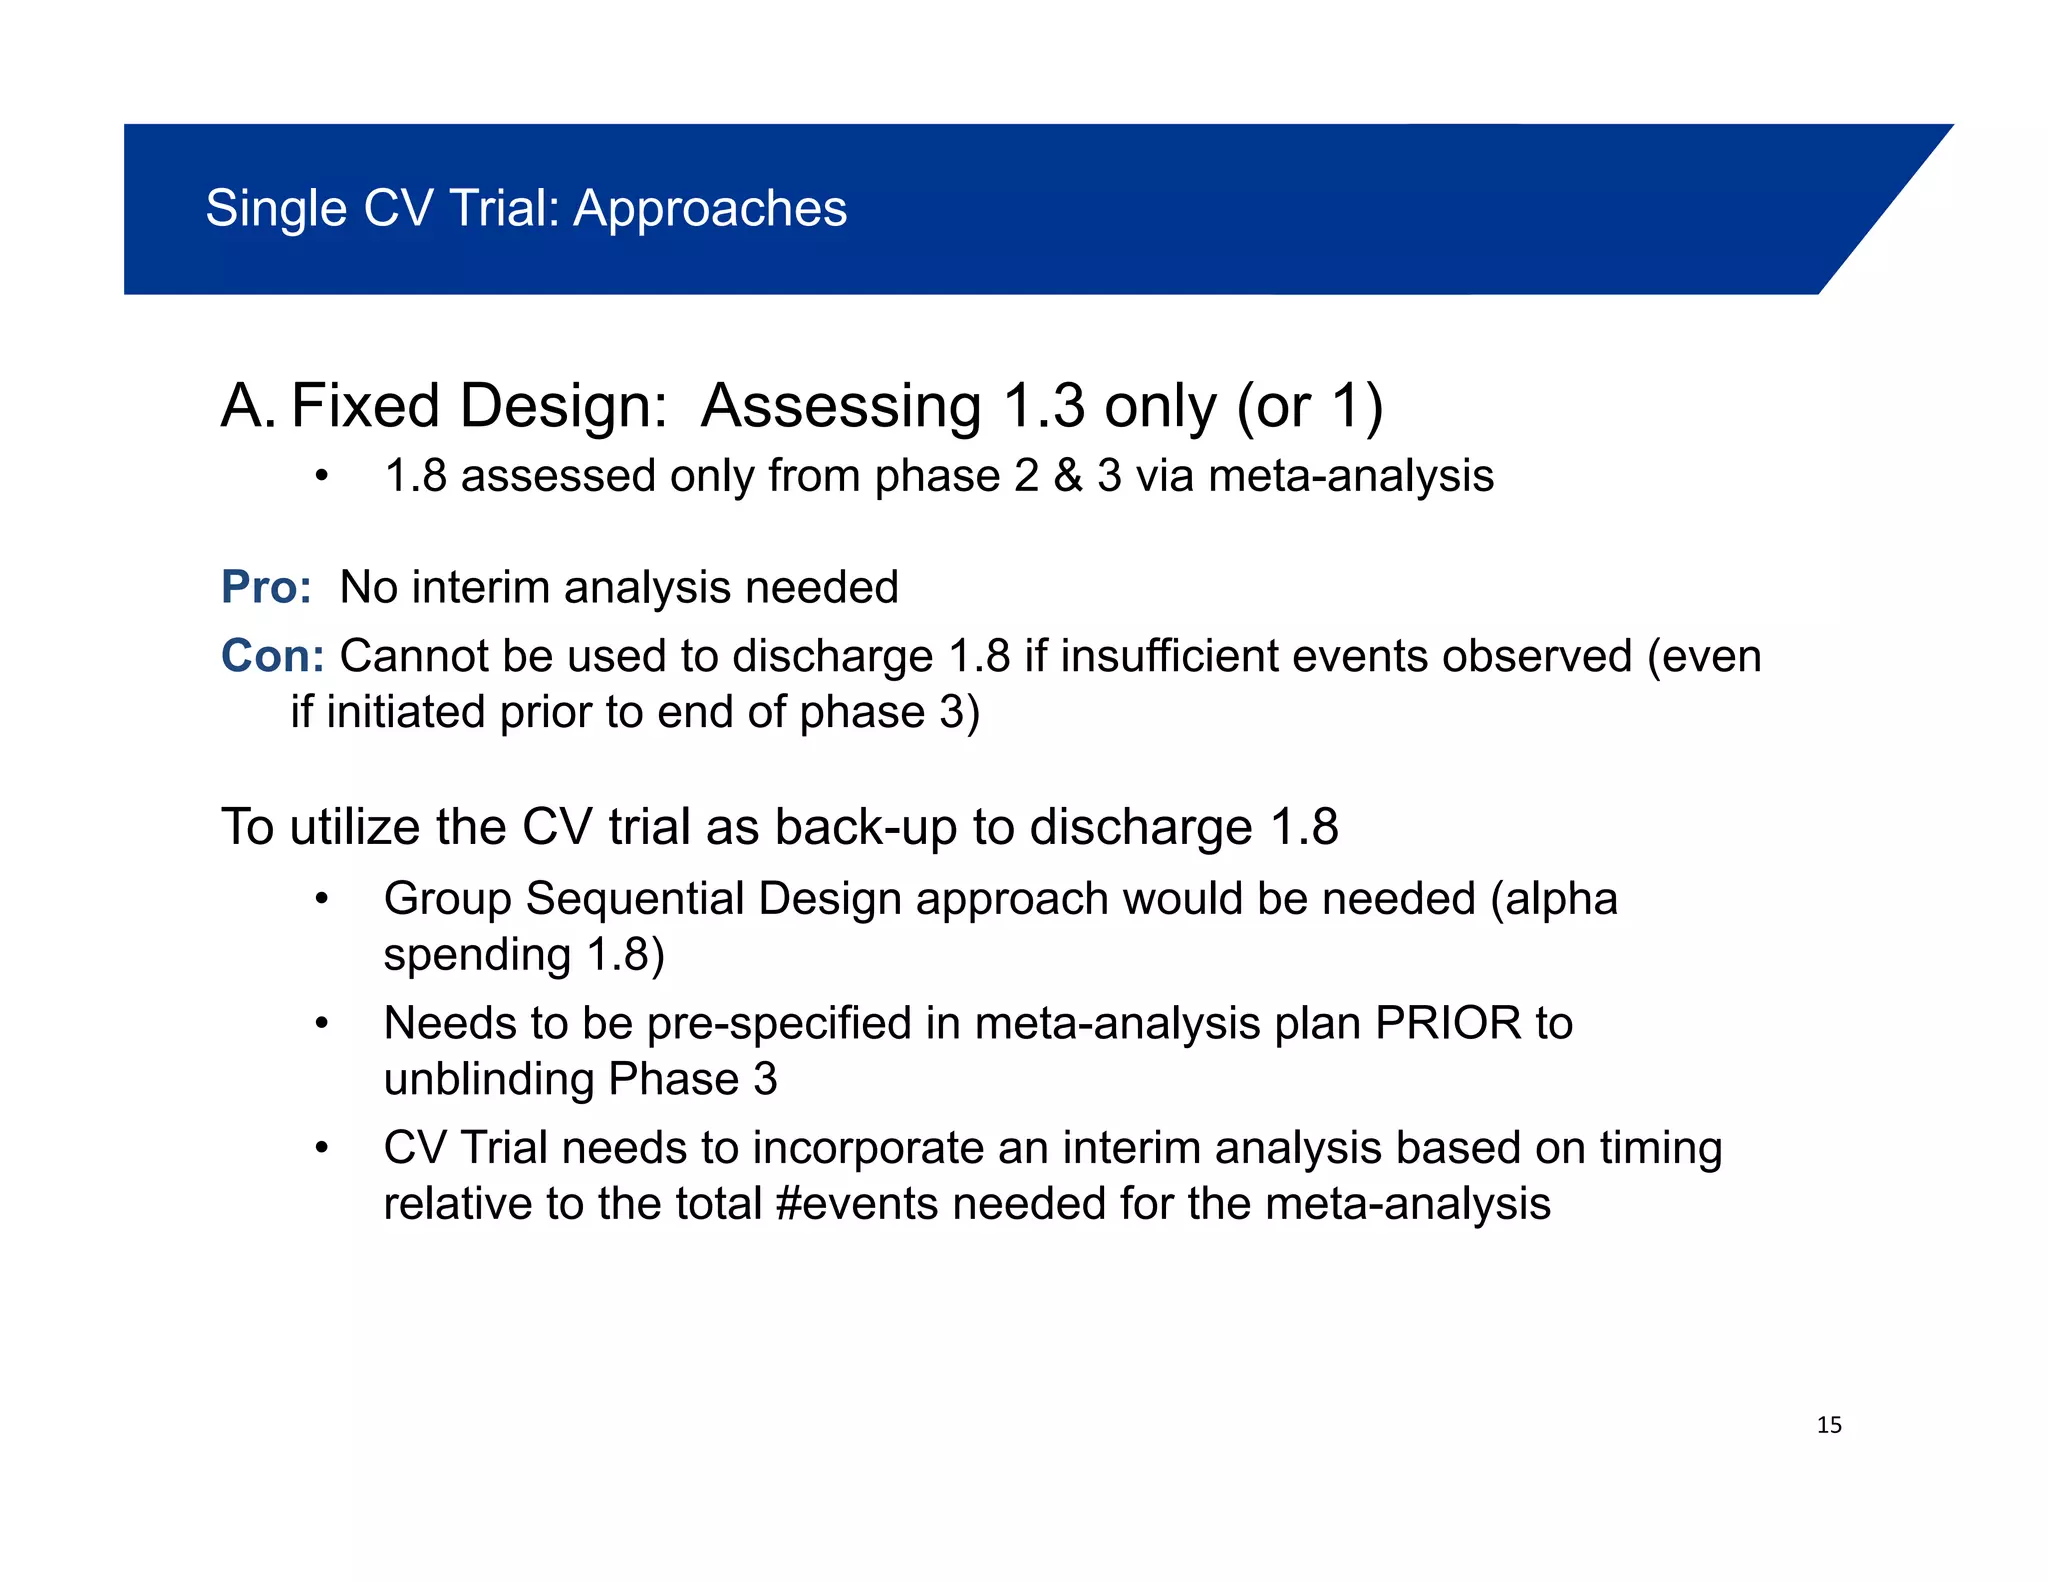
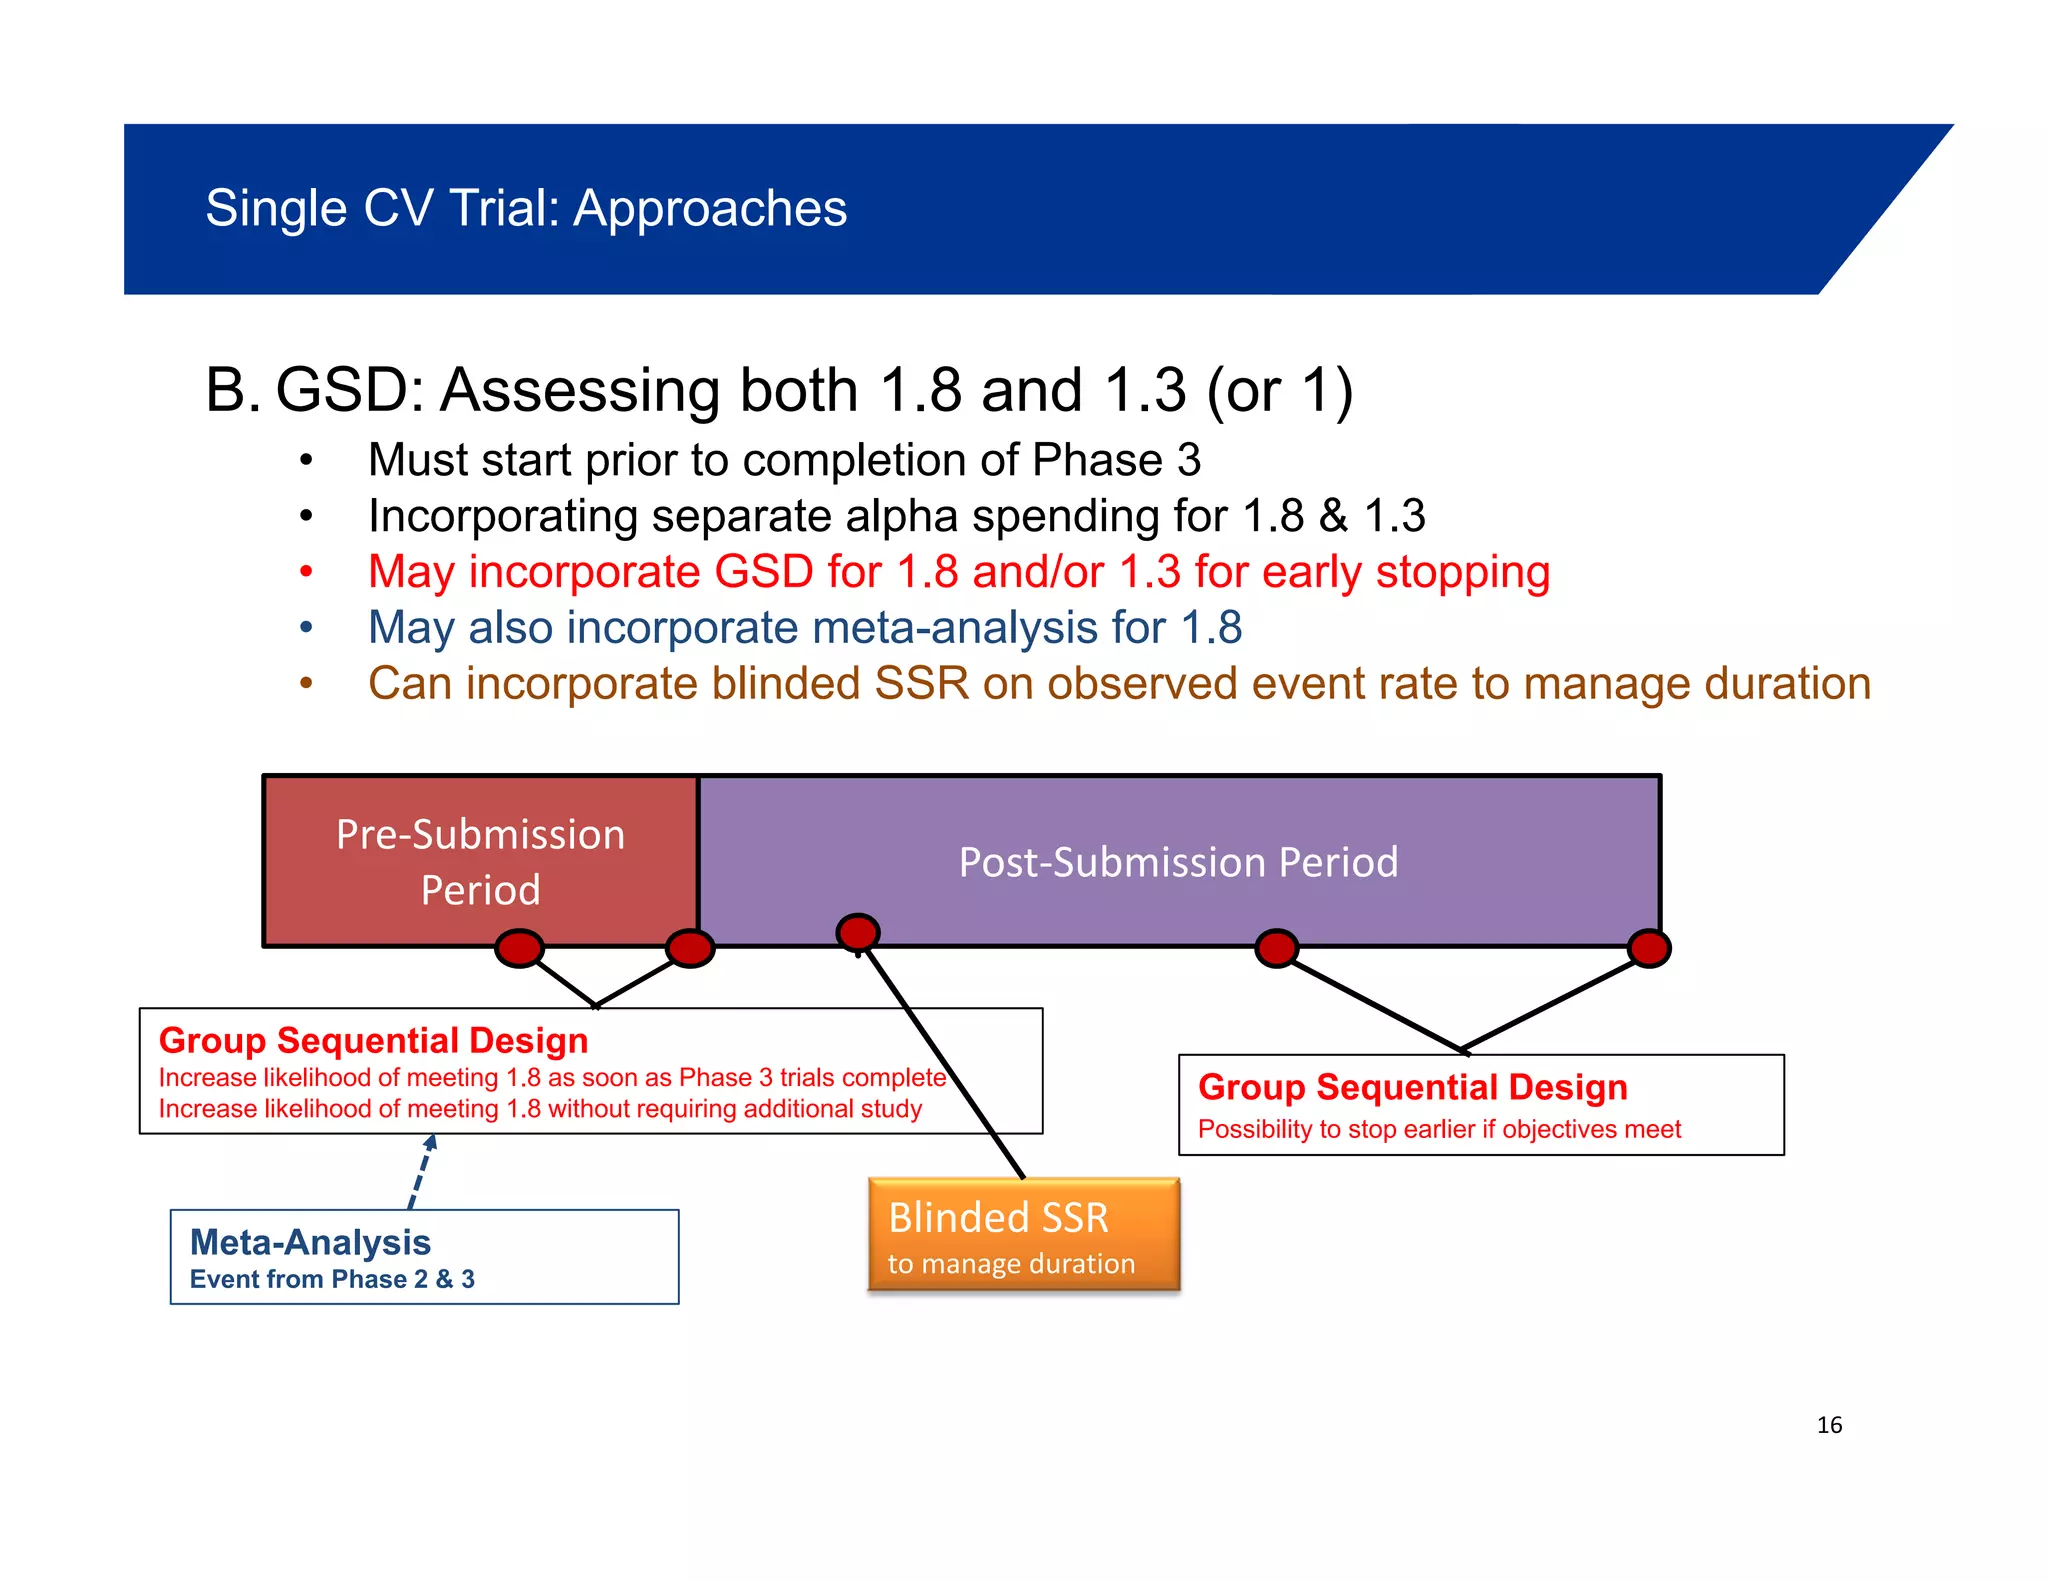
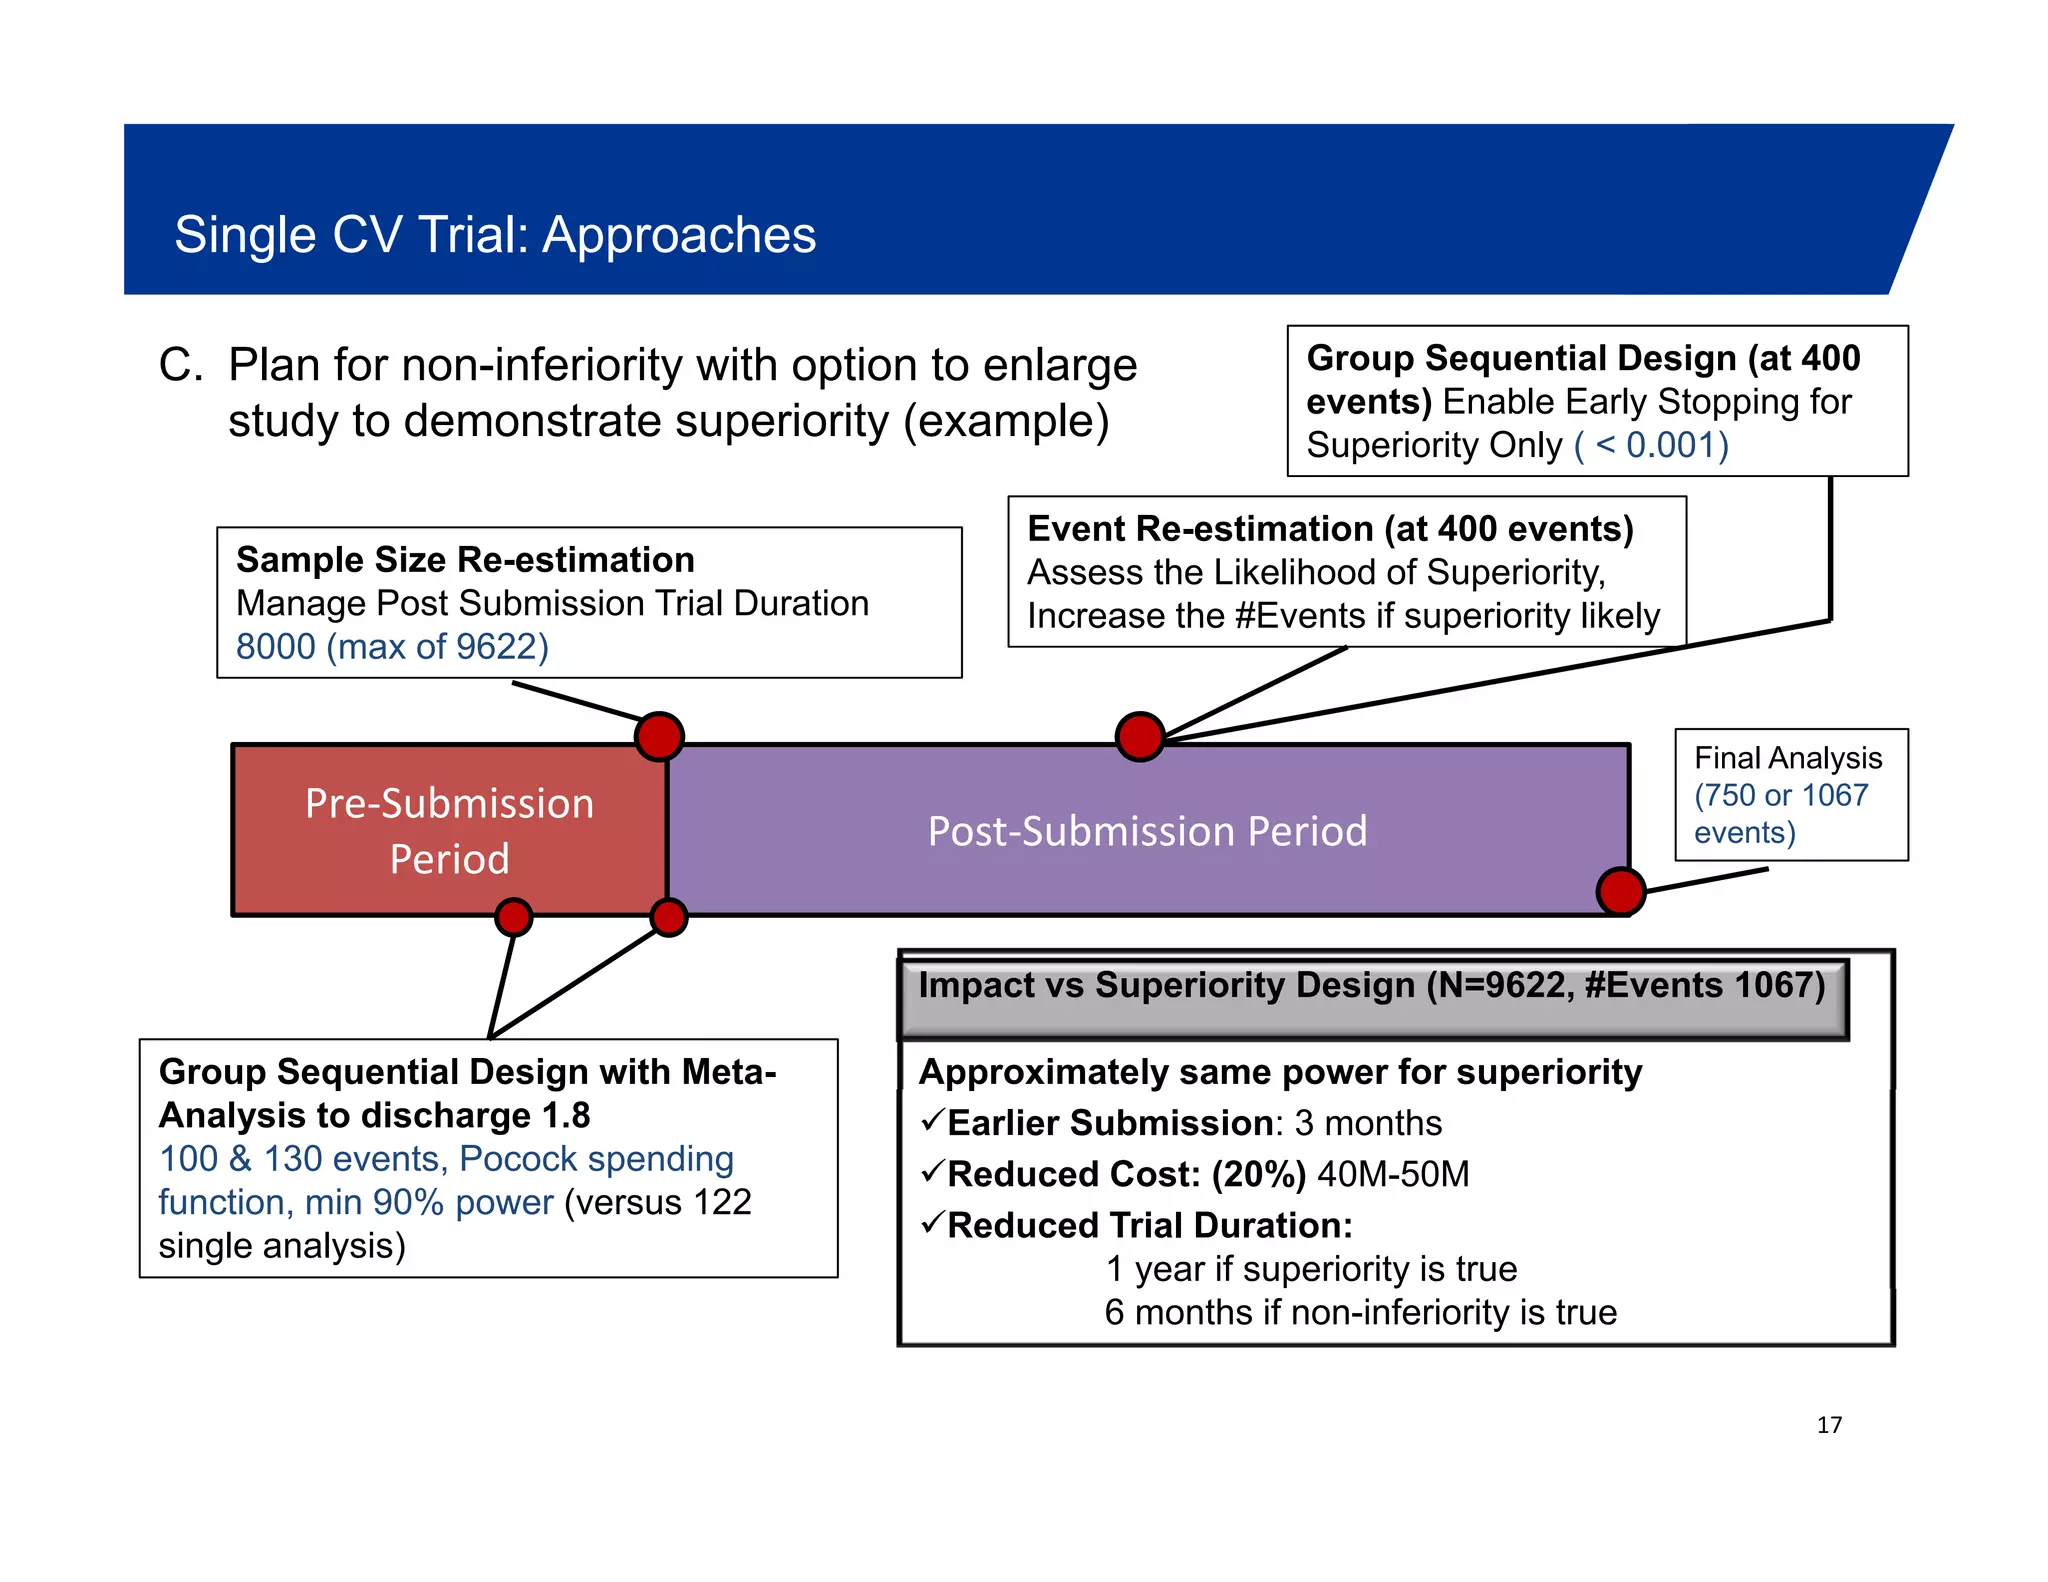
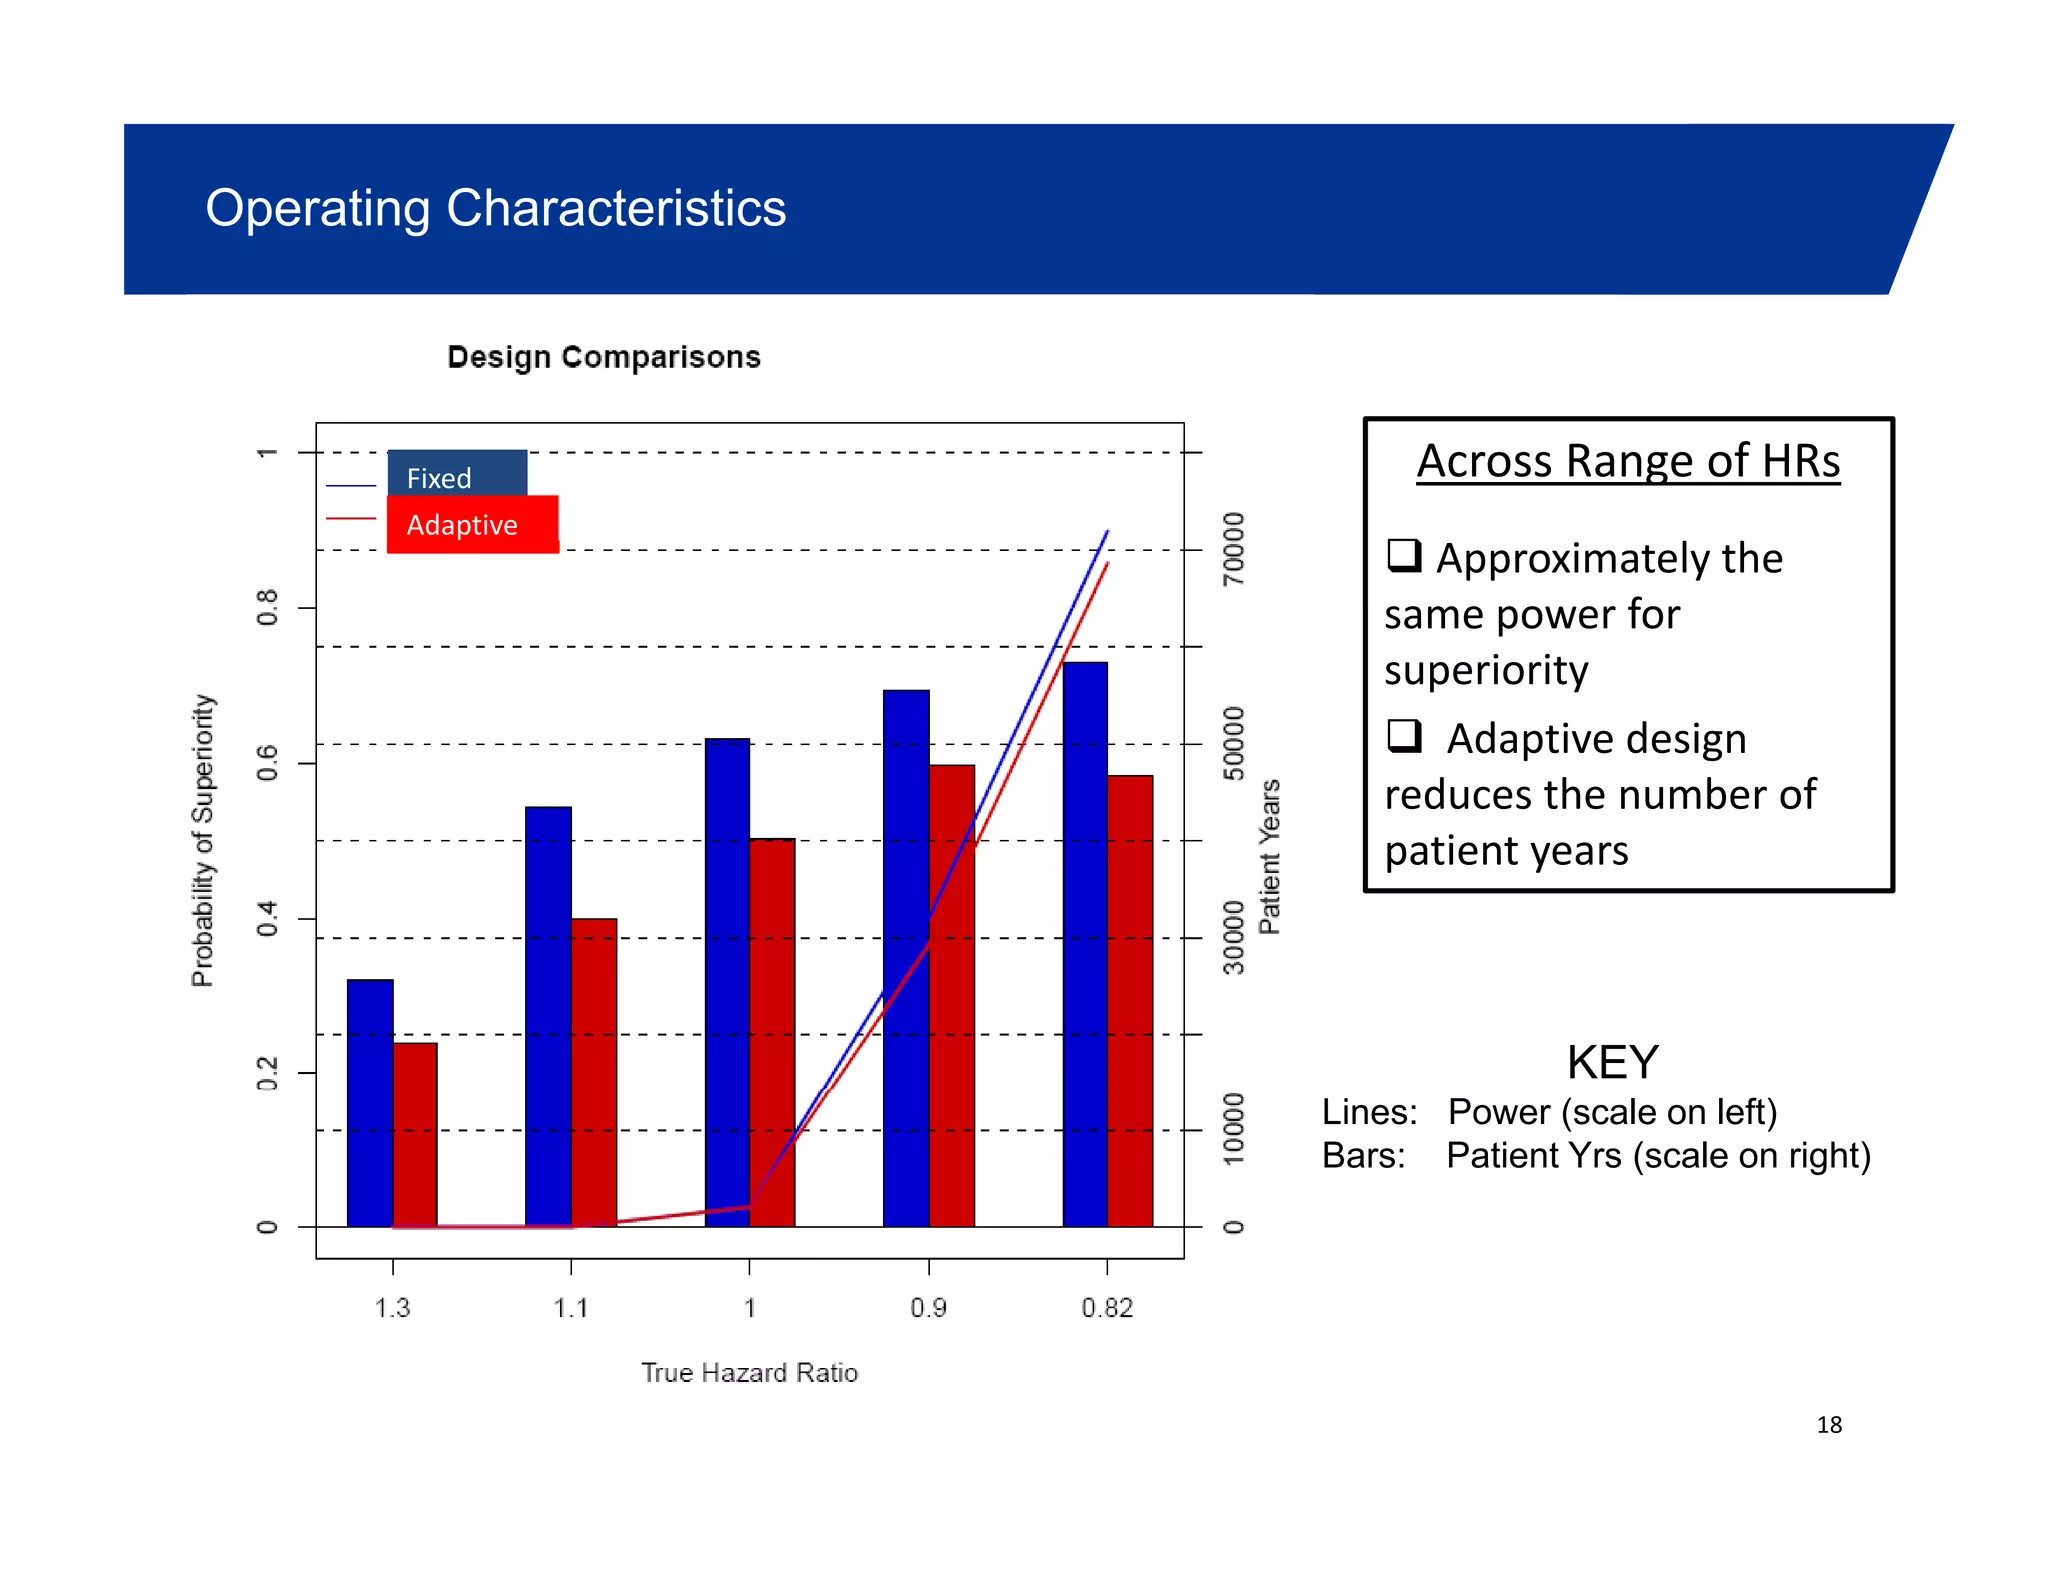
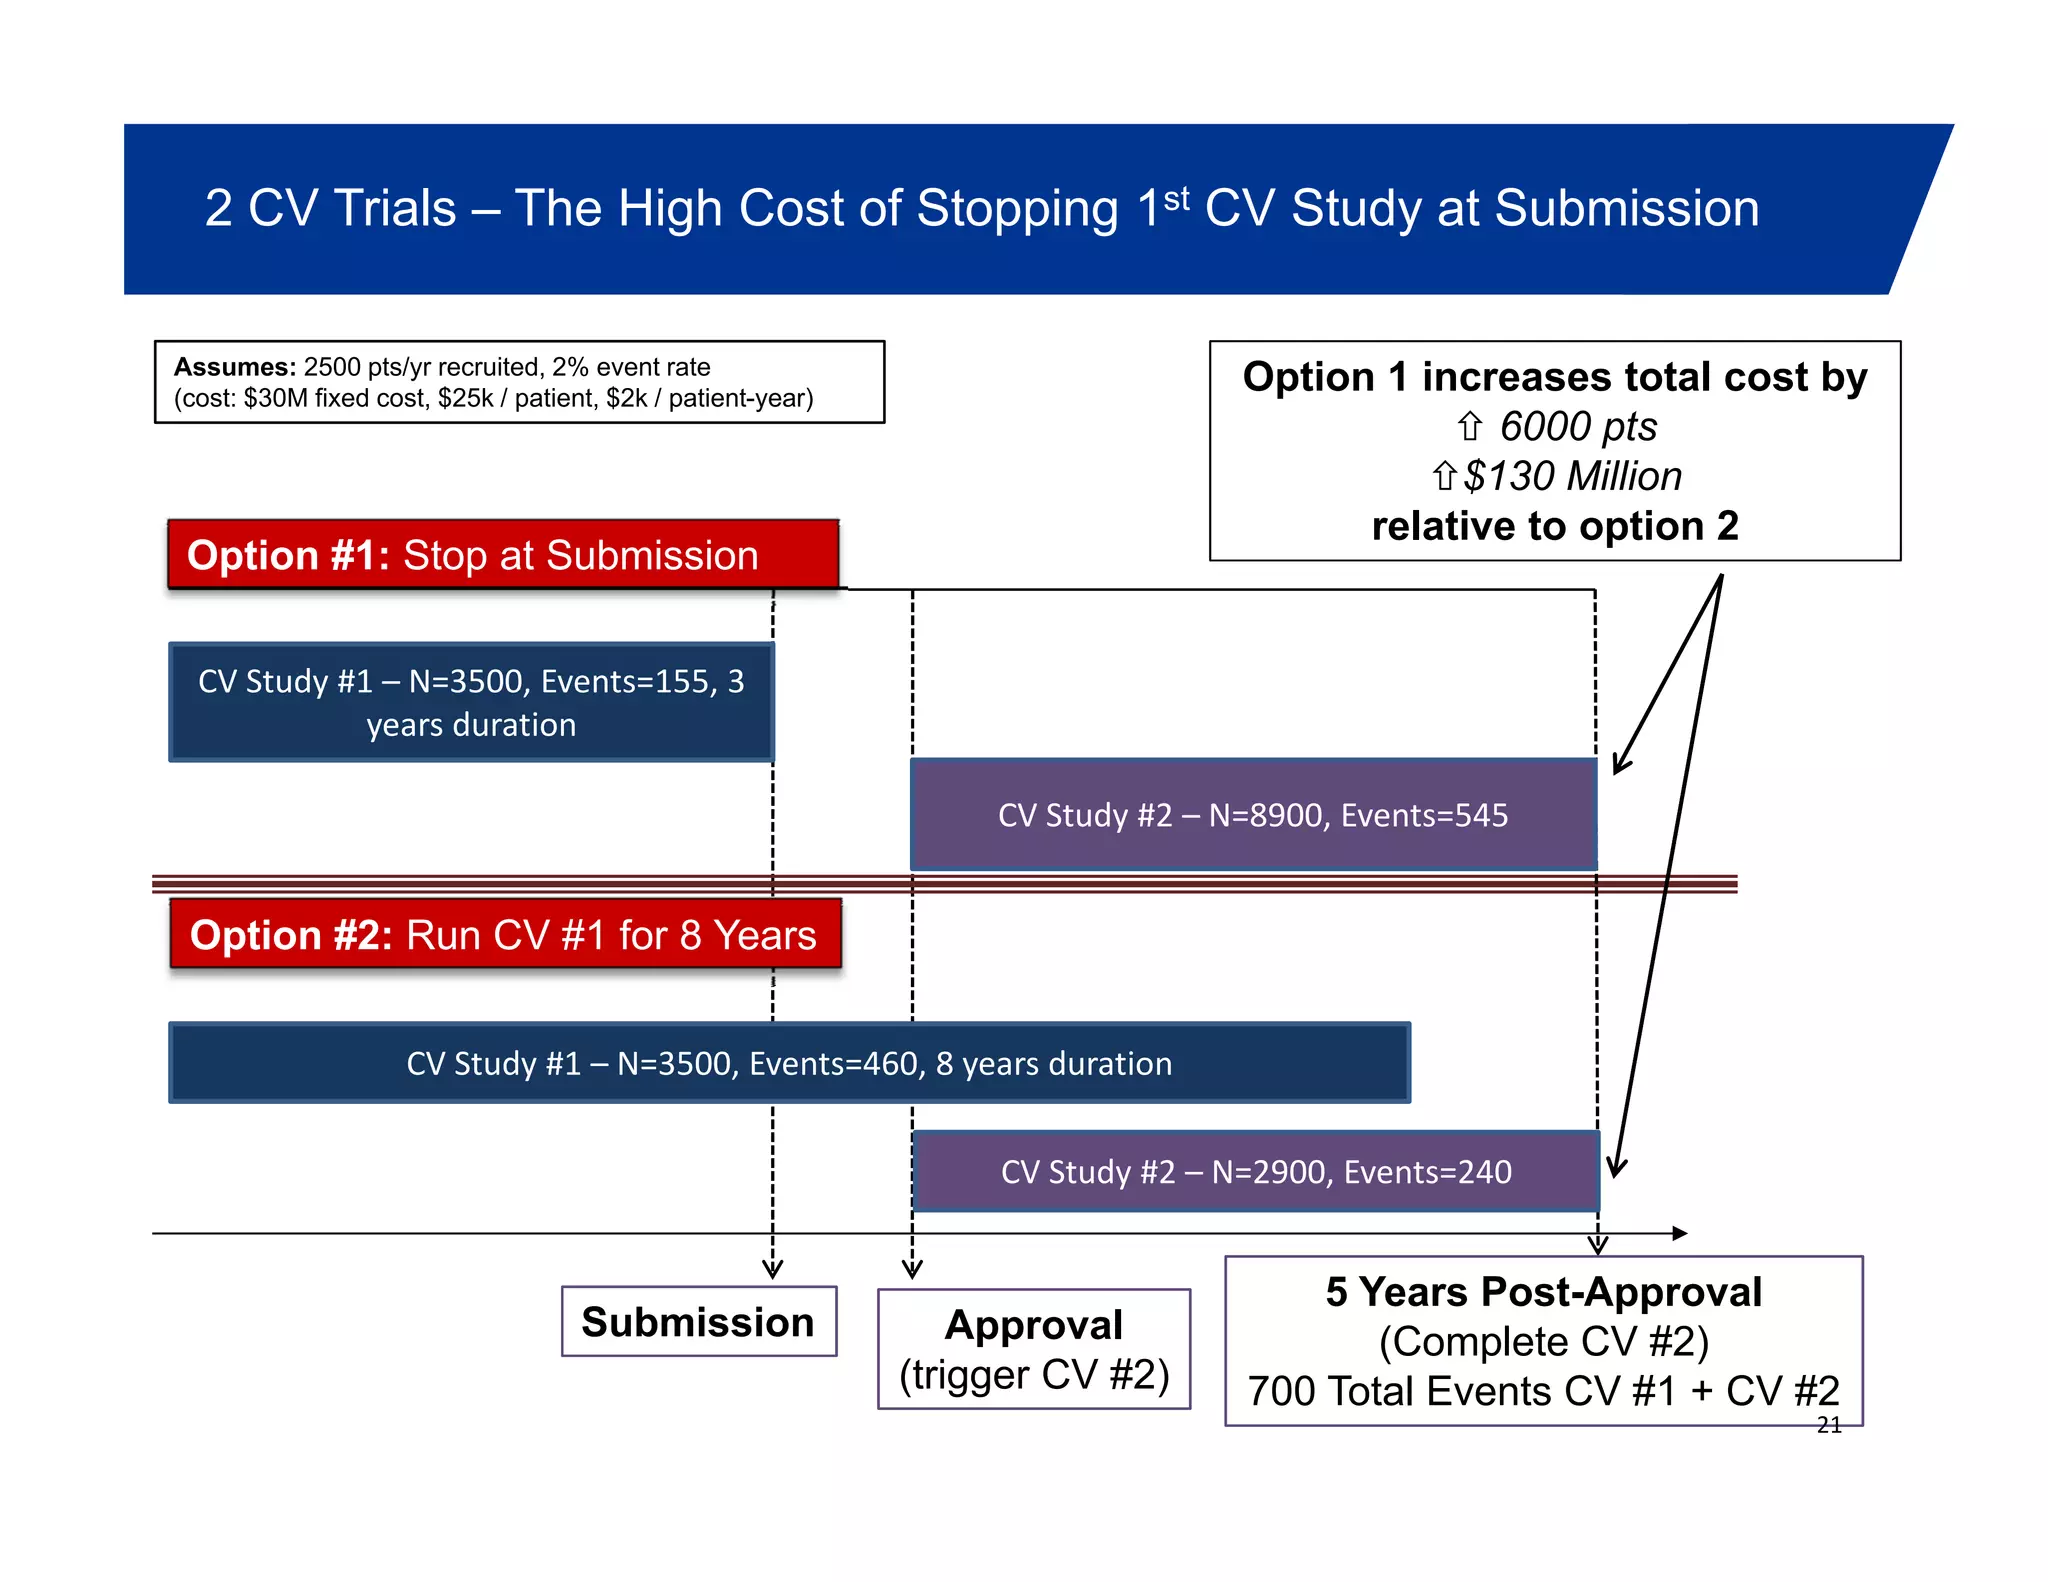
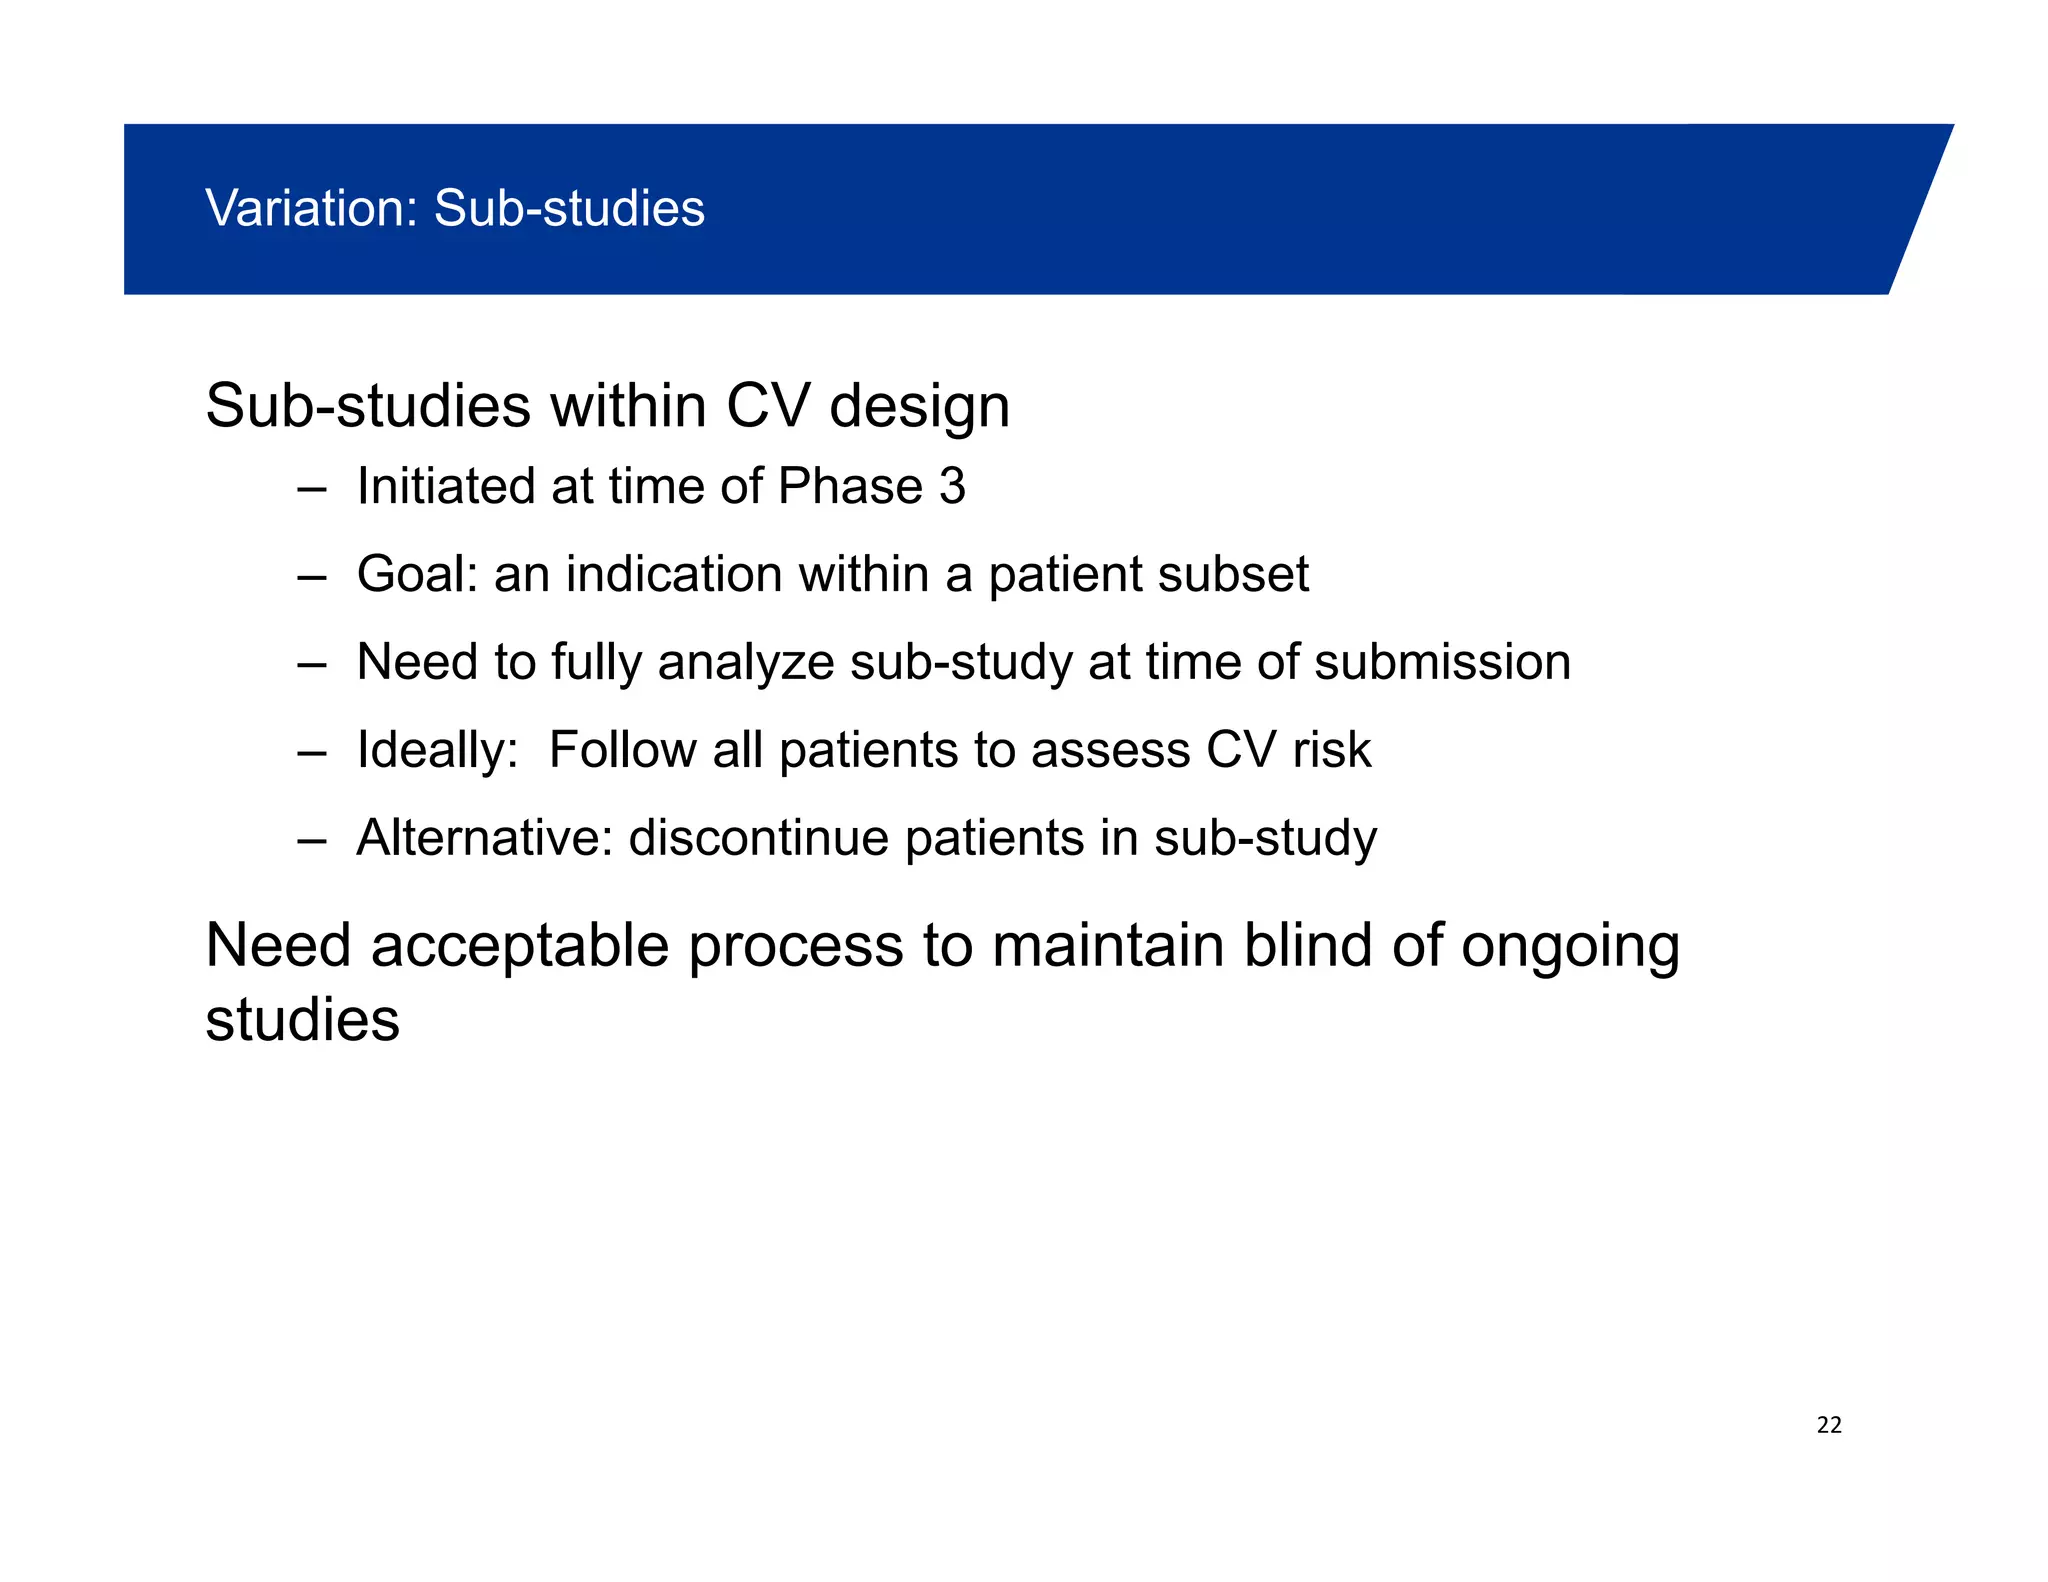
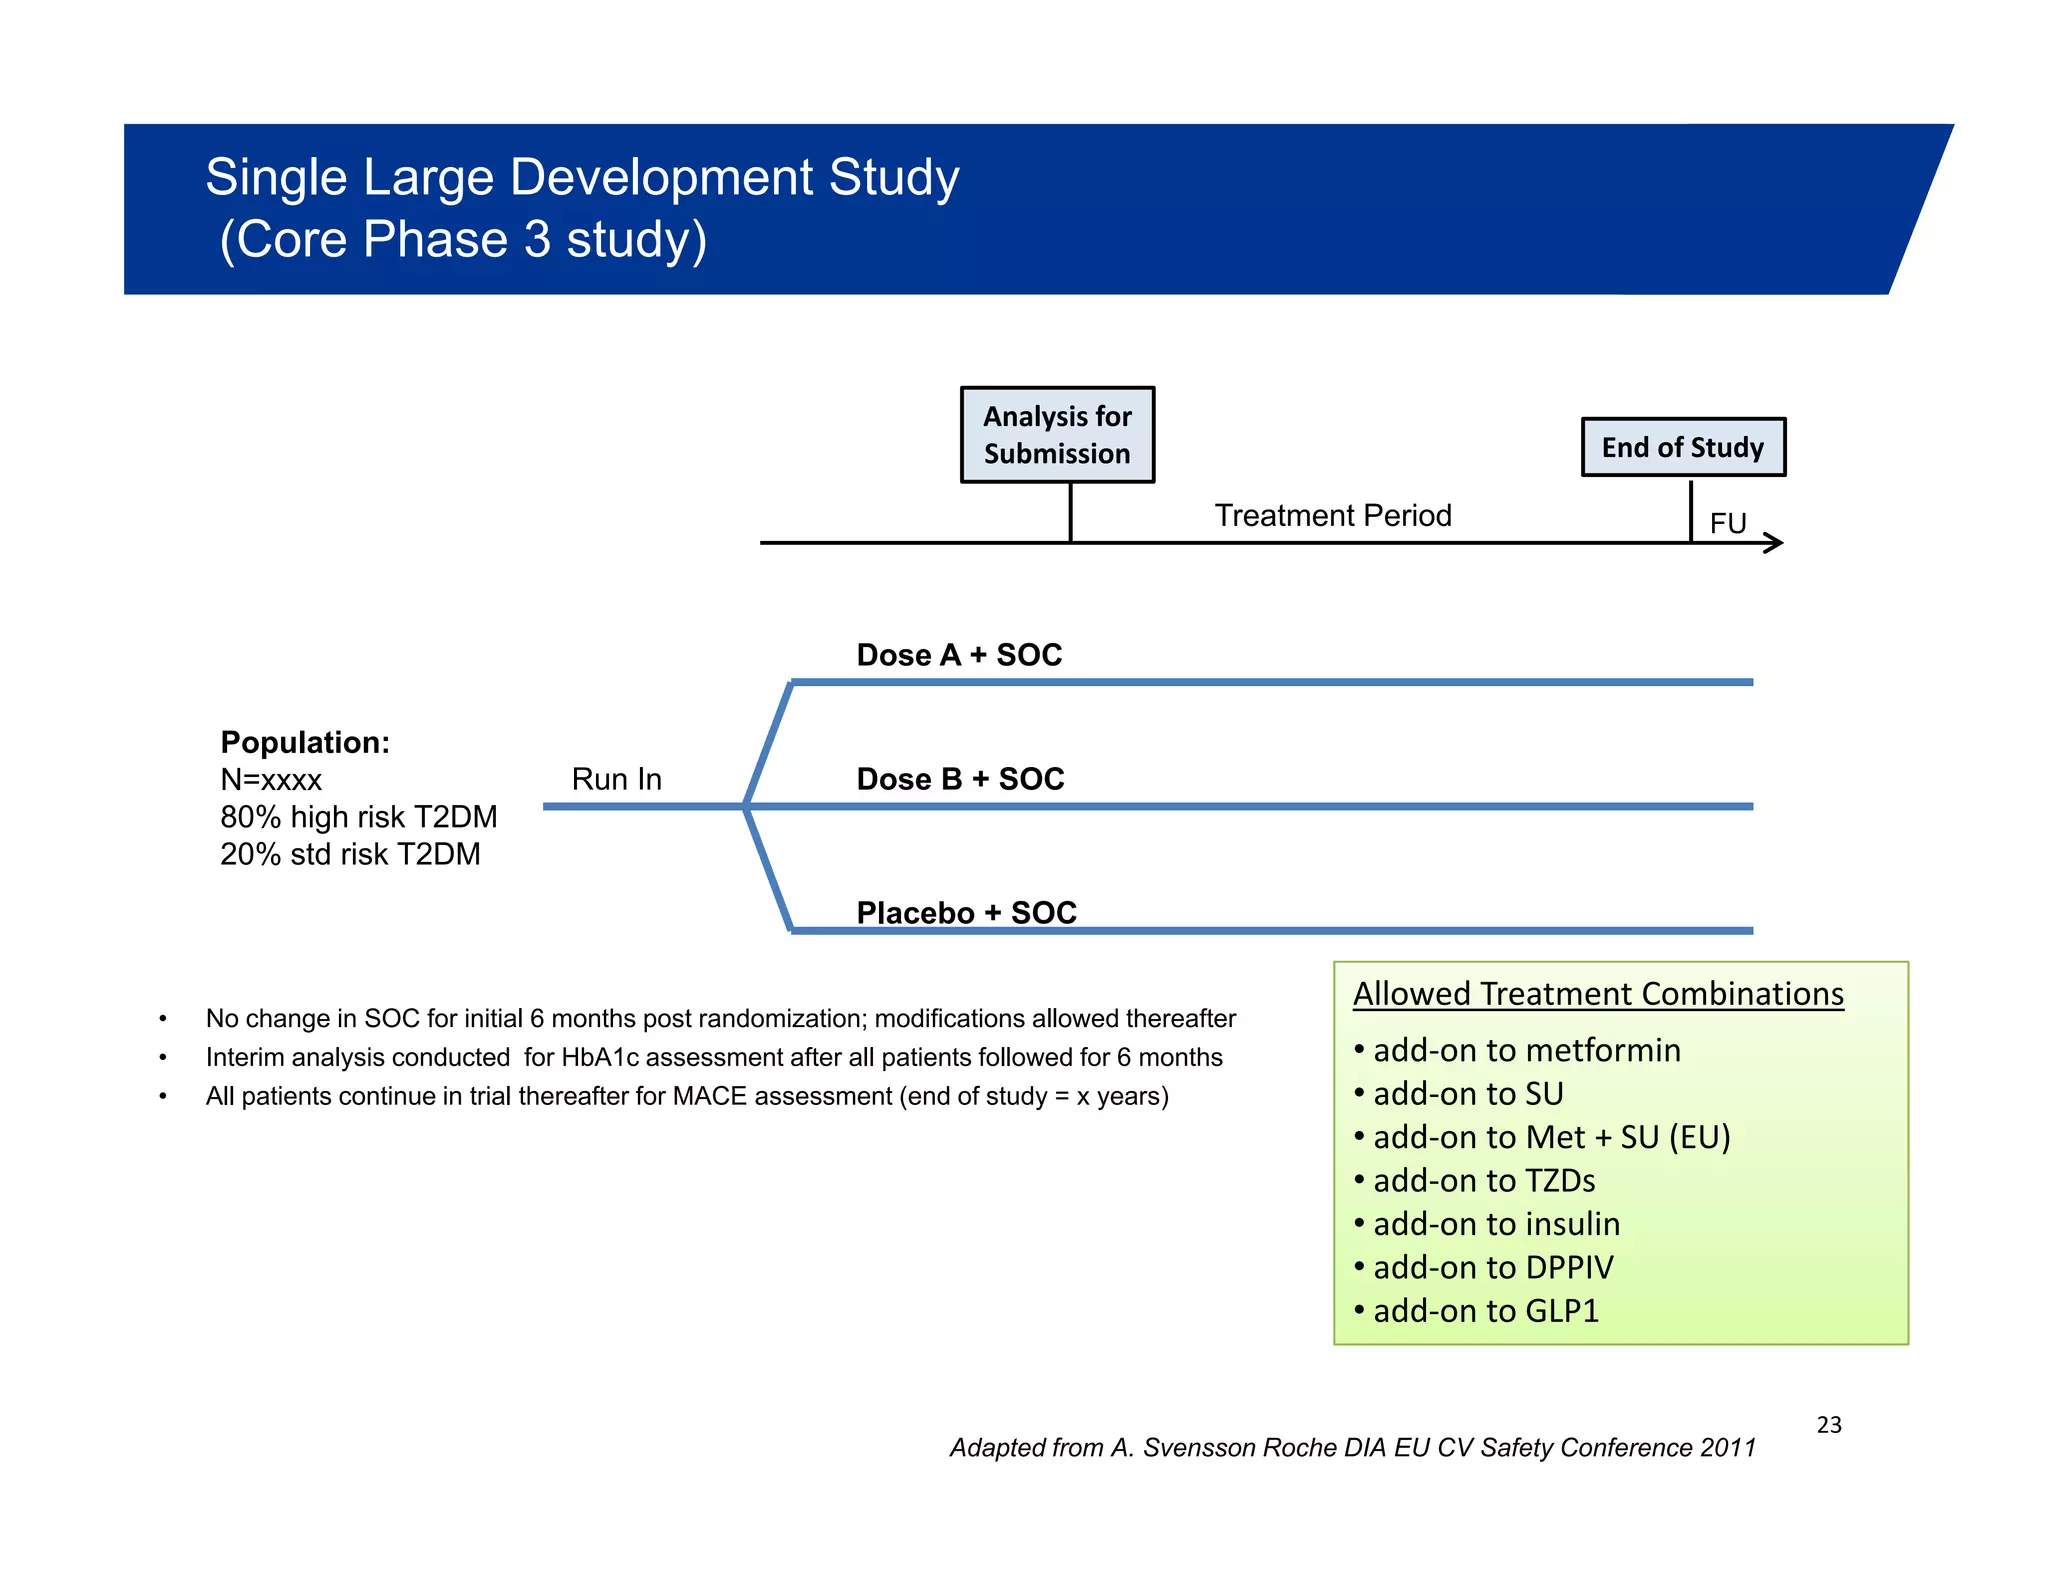
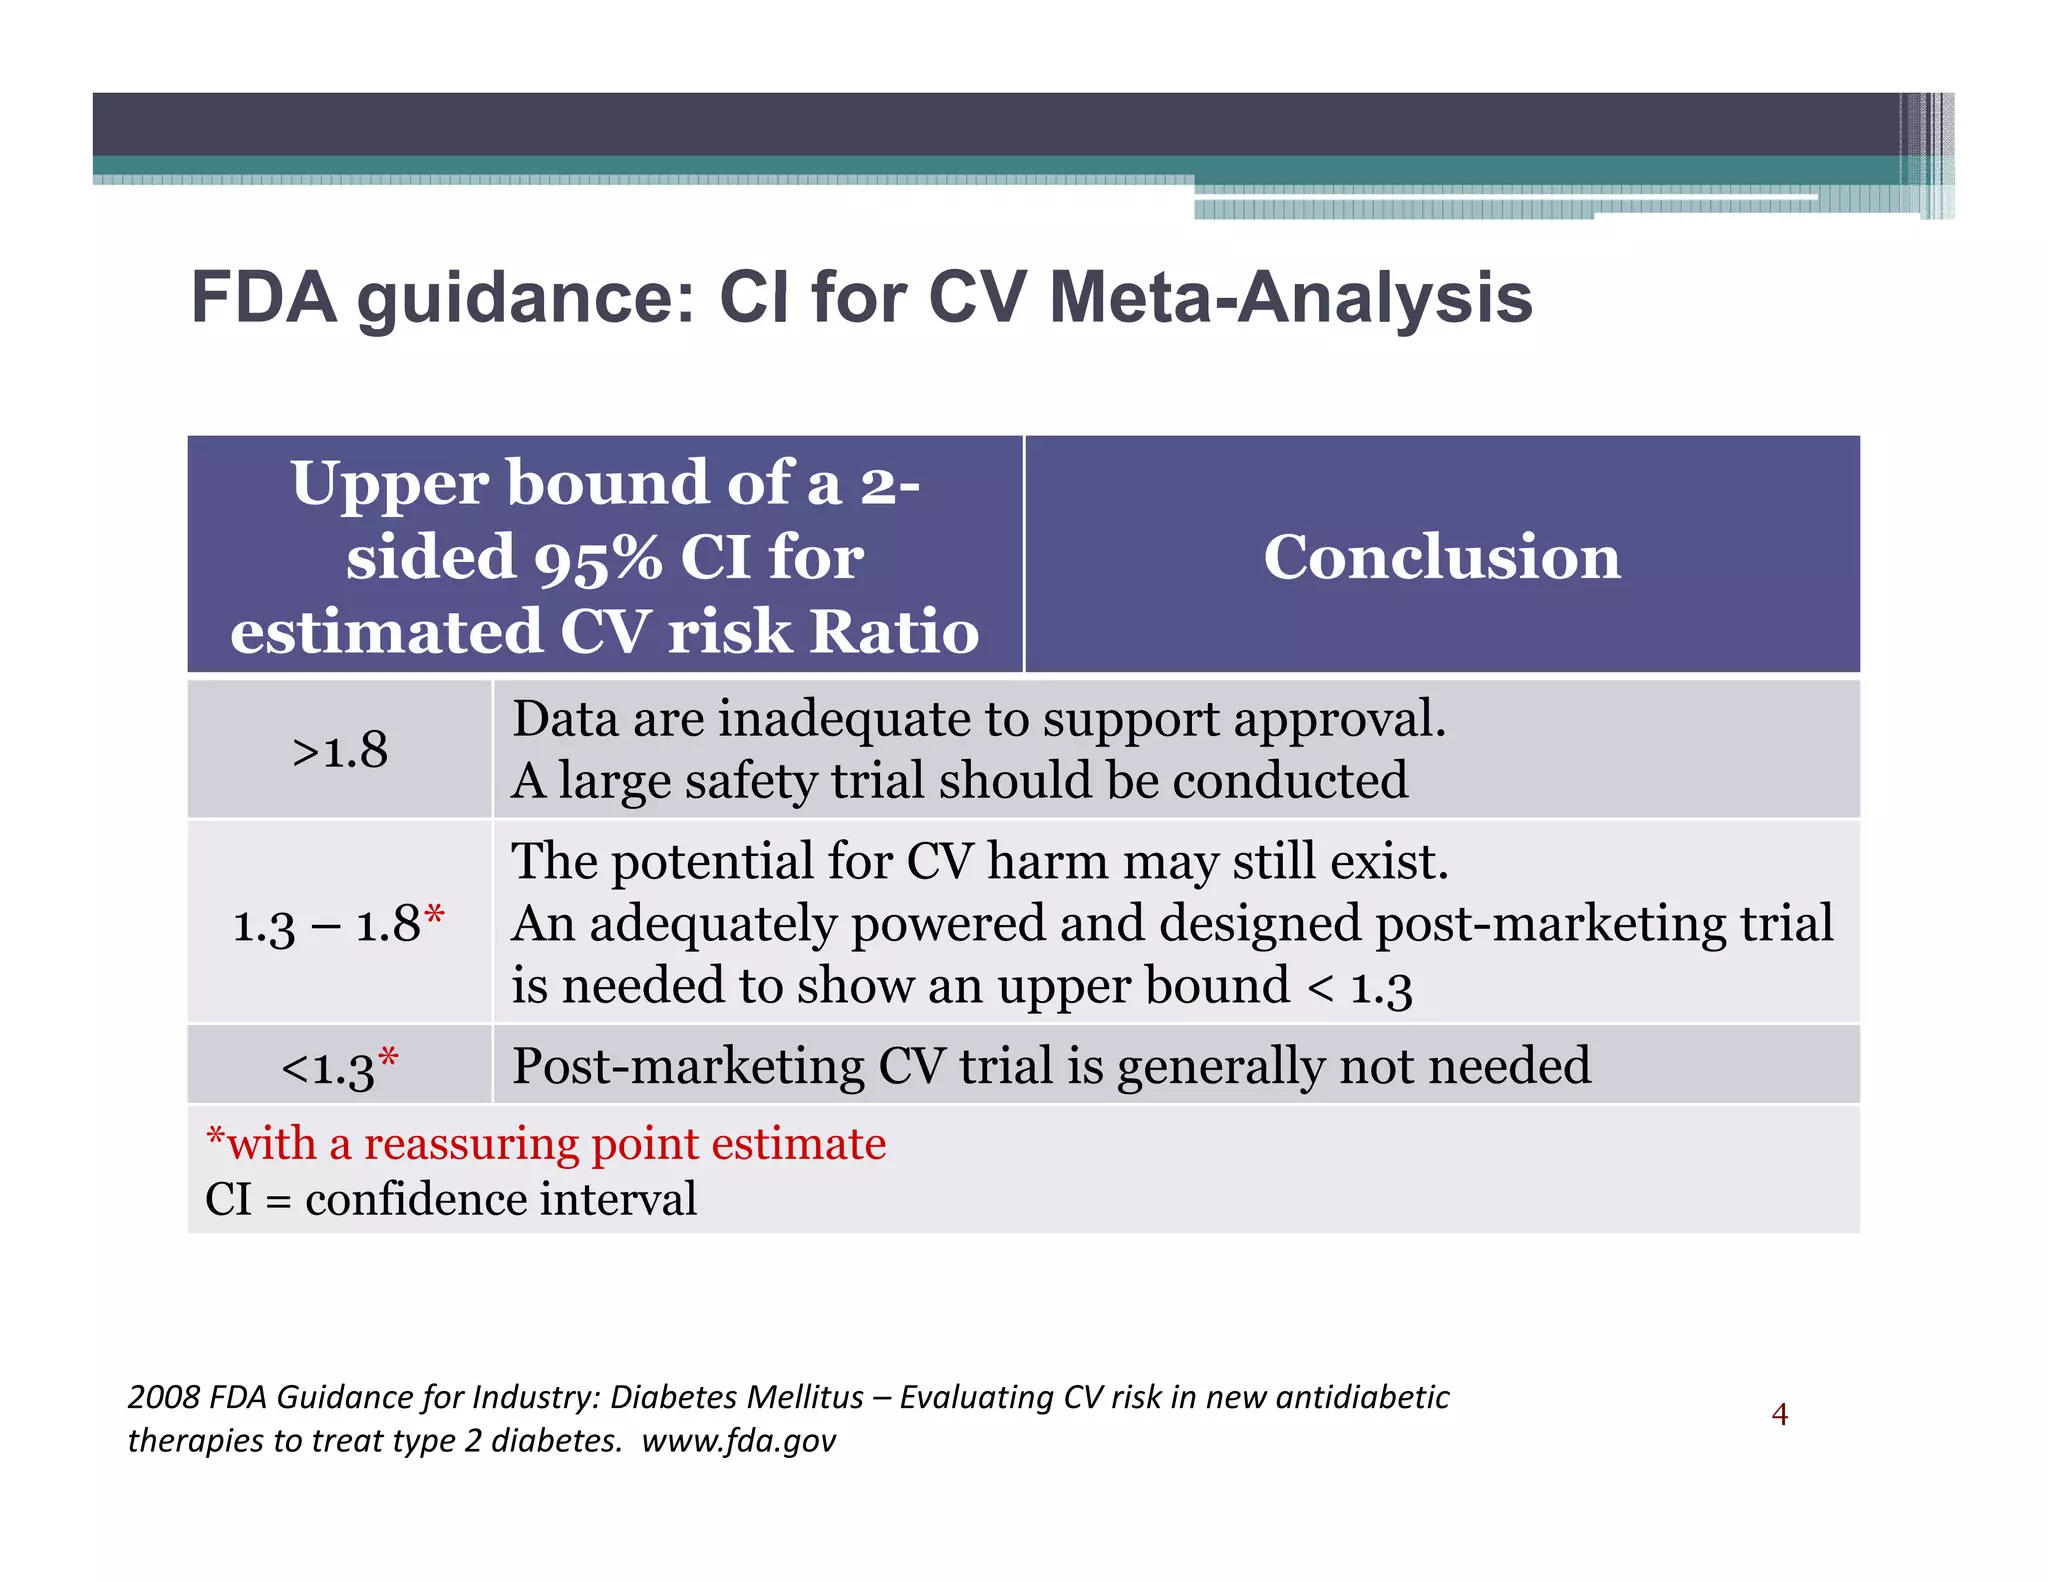
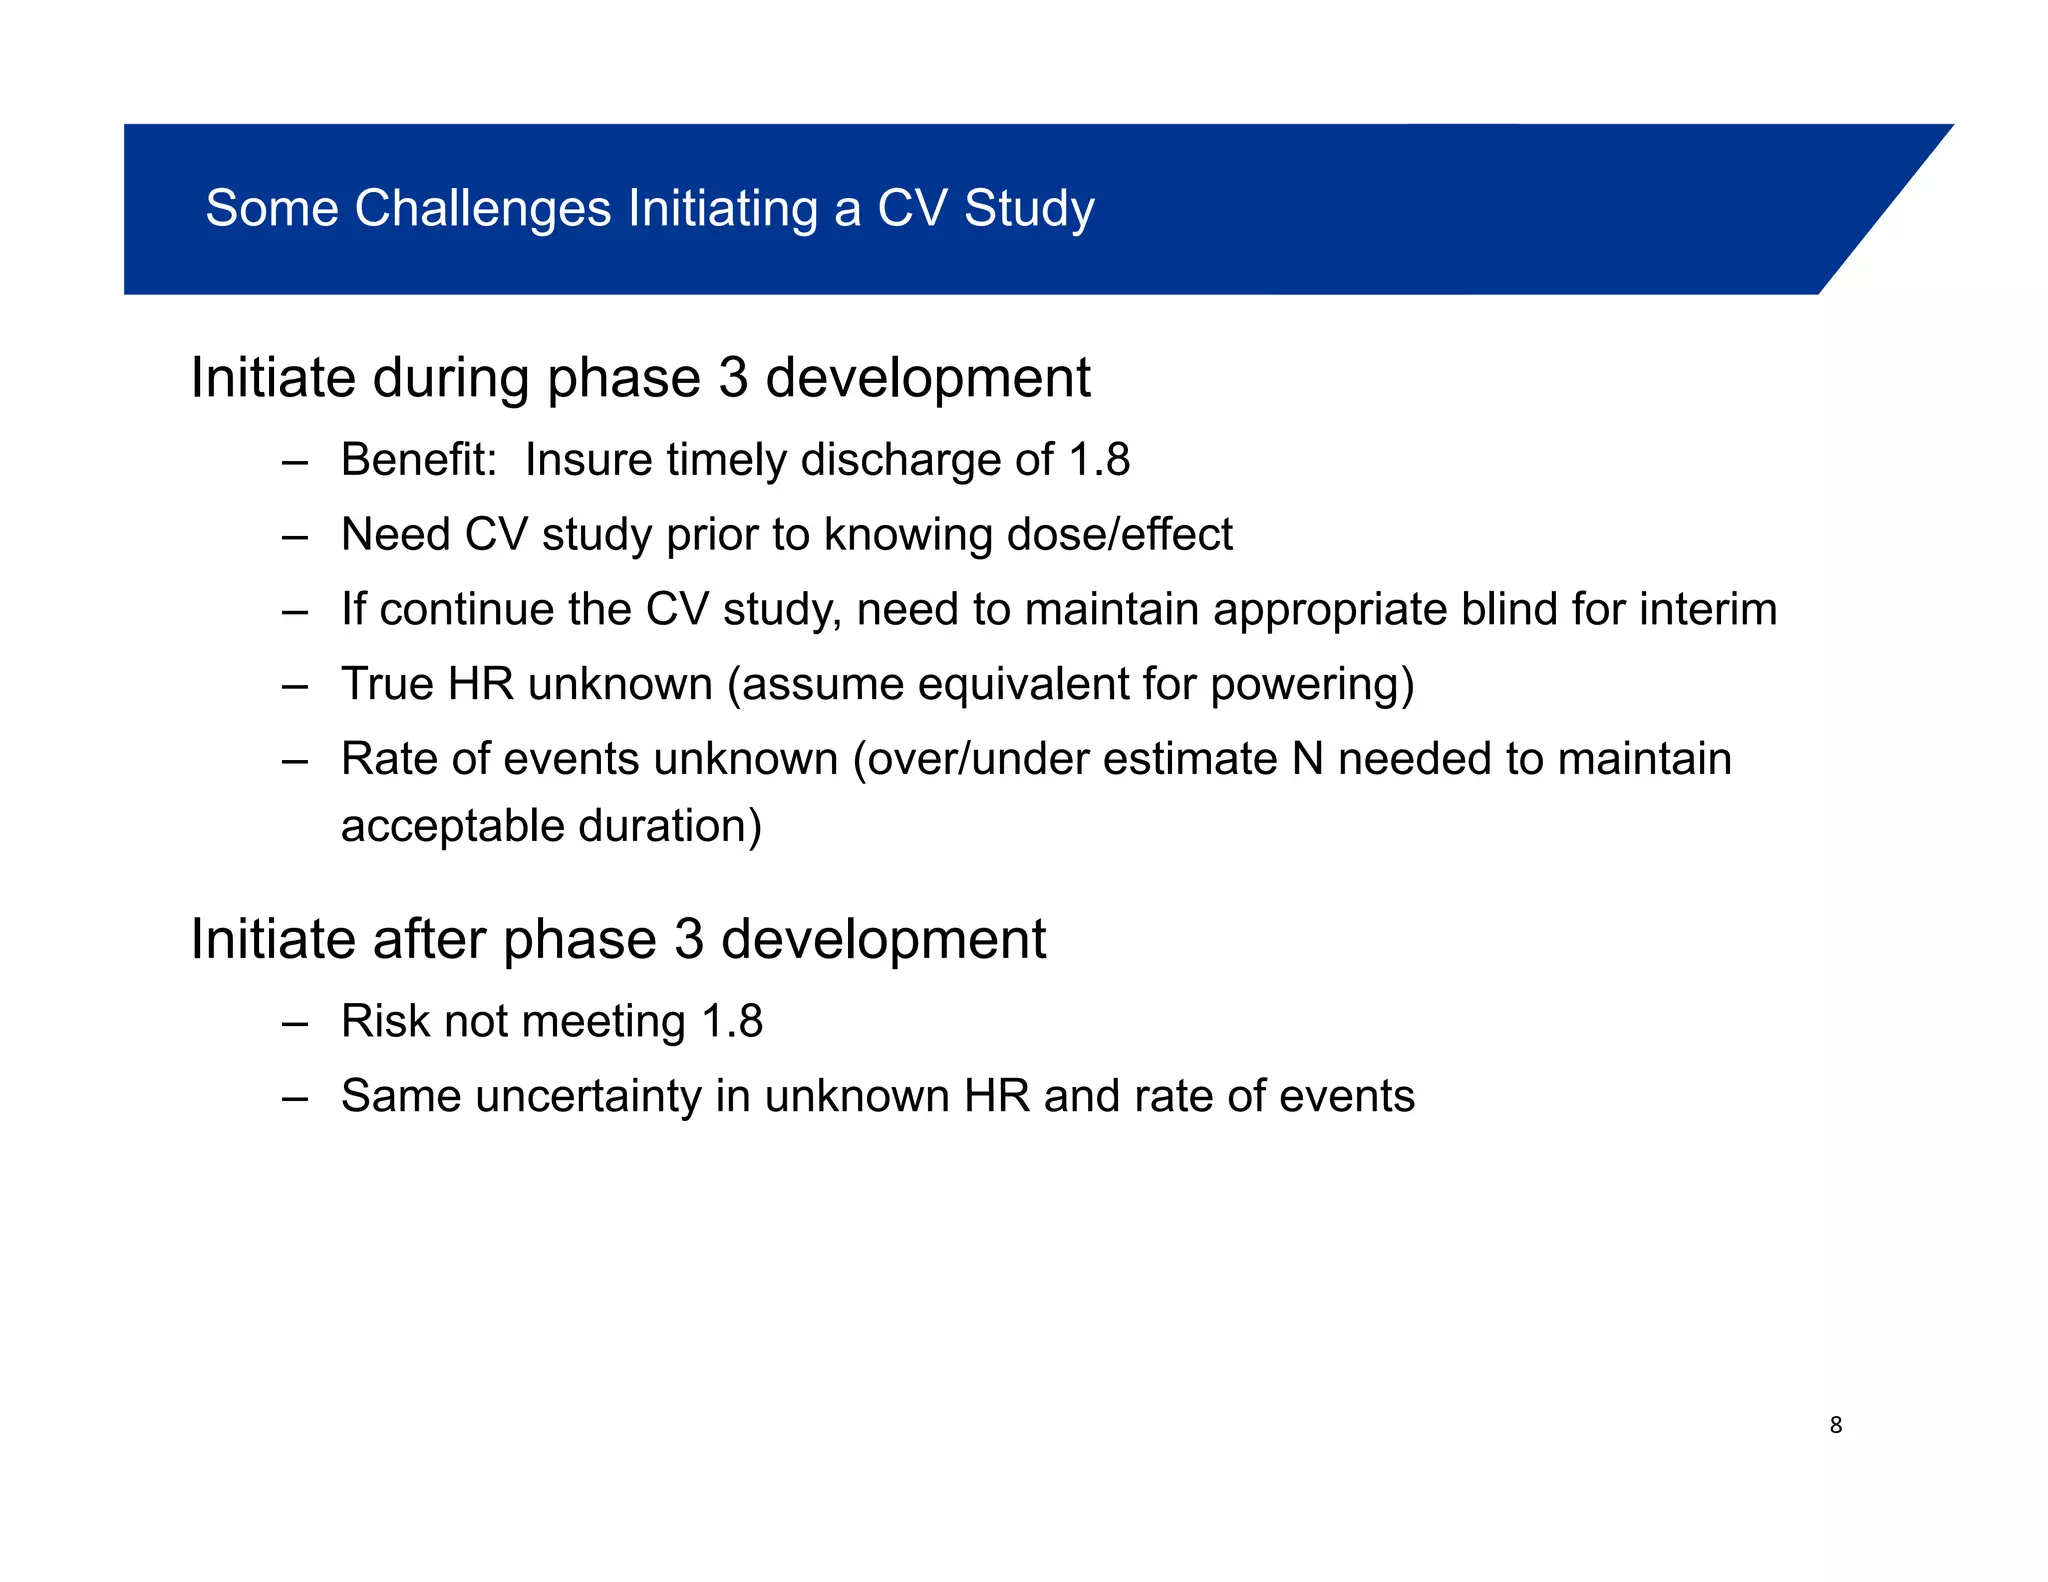
This document summarizes a presentation on approaches to evaluate cardiovascular risk in diabetes drug development. It discusses using meta-analysis and group sequential designs to integrate cardiovascular evaluation into clinical trials and potentially reduce patient exposure. It also compares options like conducting a single large outcome study, two separate cardiovascular outcome trials, or incorporating sub-studies into cardiovascular outcome trials. The presentation emphasizes planning for both non-inferiority and superiority assessments and considering operational aspects like maintaining trial blinding for interim analyses.
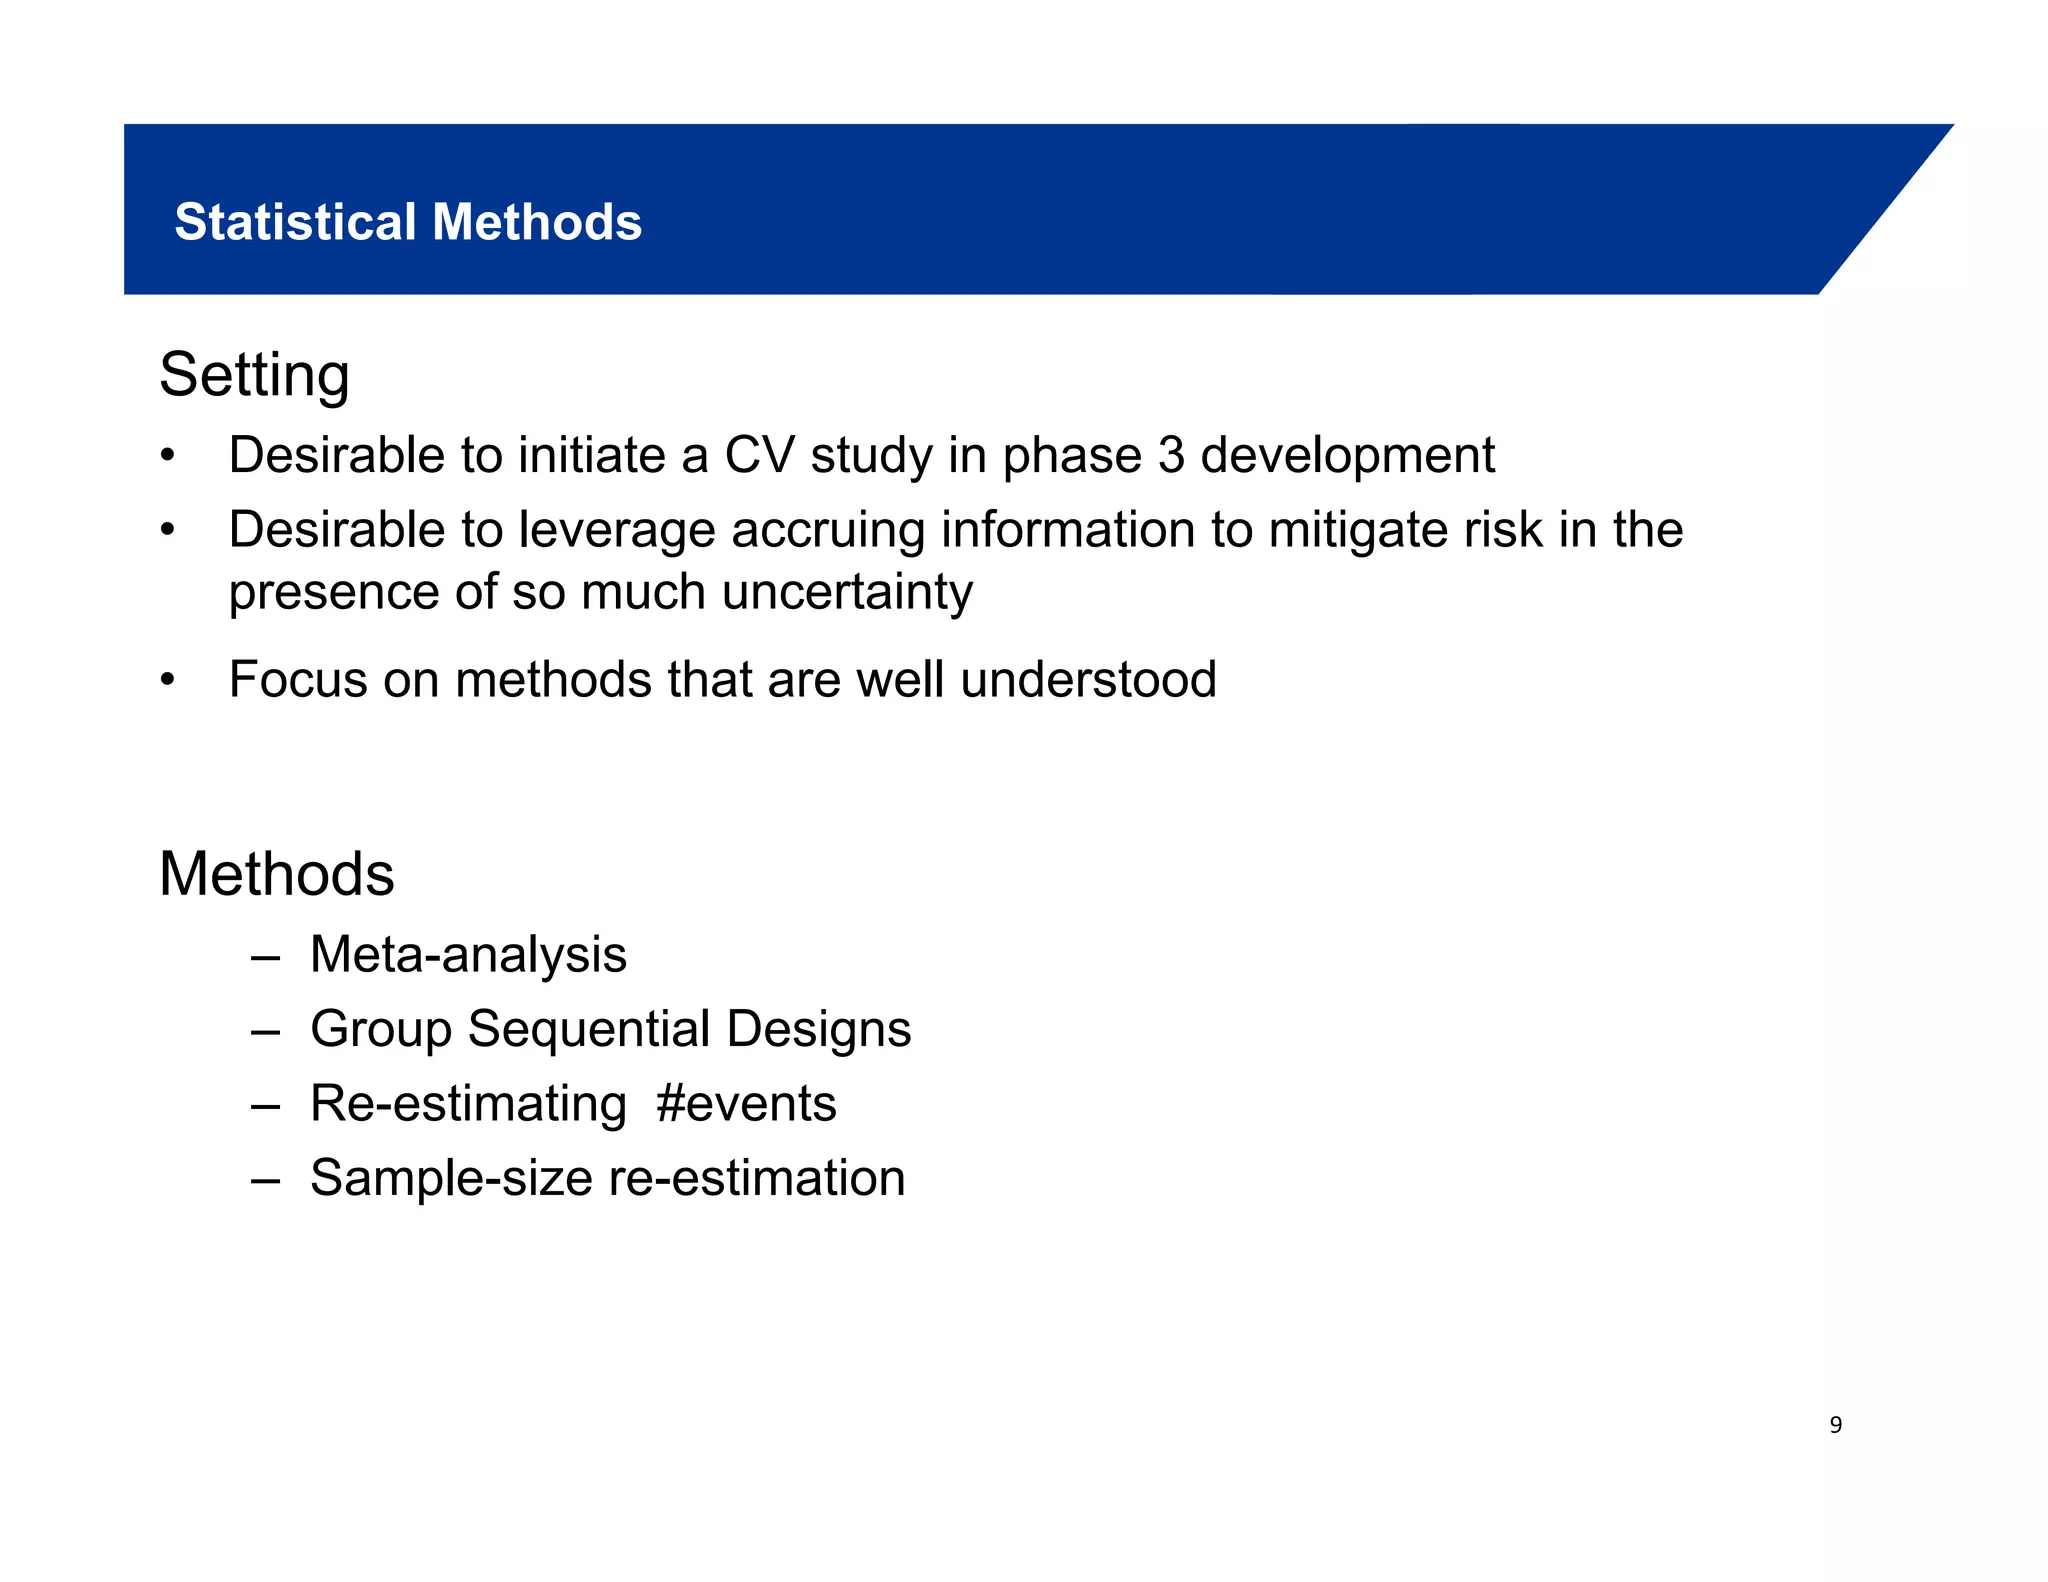
This document discusses various modern management techniques used in healthcare. It begins by defining management and its importance in healthcare, specifically regarding human resources, time, materials, and financial management. It then contrasts traditional behavioral management approaches with modern quantitative and semi-quantitative techniques emerging after World War II using mathematics, statistics, and other concepts. Several specific modern techniques are described in detail, including statistical techniques like decision trees, activity analysis methods like time motion studies and work sampling, queuing theory, and mathematical techniques like simulation, systems analysis, and various inventory control analyses. The document provides examples of how these techniques can increase efficiency and ensure better healthcare.
Illustrating uncertainty in extrapolating evidence for cost-effectiveness mod...cheweb1
1) The document discusses methods for extrapolating evidence from clinical trials to longer time horizons needed for cost-effectiveness modelling. Extrapolation involves assumptions and uncertainty that must be addressed.
2) Common extrapolation methods include parametric survival models fitted to time-to-event data from trials. Choice of model and assumptions about how trends will continue add uncertainty.
3) The document presents approaches for characterizing and addressing extrapolation uncertainty, such as assessing model fit and plausibility, scenario analysis, model averaging, and incorporating expert elicitation. Addressing uncertainty is important for reimbursement decisions.
This document discusses adaptive clinical trials. Adaptive trials allow changes to the trial design based on interim data analysis in order to make the trial more efficient. Key aspects that can be adapted include sample size, treatments, endpoints, and eligibility criteria. Adaptive designs are well-suited for exploratory trials aimed at learning, but confirmatory trials require more prior data and safeguards to ensure the trial's integrity and the validity of its conclusions. The FDA has provided guidance on adaptive designs to ensure patient safety and that adaptive trials meet evidentiary standards for approval.
The document summarizes registered reports, an alternative publication format that aims to address reproducibility issues. It discusses:
1) The standard publication process and reproducibility crisis in science due to biases like publication bias, low statistical power, p-hacking, and HARKing.
2) What registered reports are - a two-stage peer review process where the proposed methods and analyses are peer-reviewed before data collection. This removes biases driven by study outcomes.
3) Why registered reports are gaining popularity - they can increase reproducibility, computational reproducibility, and study quality while reducing biases compared to standard publications.
4) An example of an author's experience submitting a registered report to be peer-reviewed in stage
modern management technique tells us about the management techniques and its implication in health field.
From Statistical methods to SWOT analysis is explained with example.
It also tells about log frame and cost benefit and cost effective analysis
Designing studies with recurrent events | Model choices, pitfalls and group s...nQuery
In this free webinar, we will examine the important design considerations for analyzing recurring events and counts.
Watch the webinar at: https://www.statsols.com/en/webinar/designing-studies-with-recurrent-events
Designing studies with recurrent events (Model choices, pitfalls and group sequential design)
2020 trends in biostatistics what you should know about study design - slid...nQuery
2020 Trends In Biostatistics - What you should know about study design.
In this free webinar you will learn about:
-Adaptive designs in confirmatory trials
-Using external data in study planning
-Innovative designs in early-stage trials
To watch the full webinar:
https://www.statsols.com/webinar/2020-trends-in-biostatistics-what-you-should-know-about-study-design
Sample size for survival analysis - a guide to planning successful clinical t...nQuery
Determining the appropriate number of events needed for survival analysis is a complex task as study planners try to predict what sample size will be needed after accounting for the complications of unequal follow-up, drop-out and treatment crossover.
The statistical, logistical and ethical considerations all complicate life for biostatisticians as issues to balance in planning a survival analysis. However, this complexity has created a need for new analyses and procedures to help the planning process for survival analysis trials.
The wider move from fixed to flexible designs has opened up opportunities for advanced methods such as adaptive design and Bayesian analysis to help deal with the unique complications of planning for survival data but these methods have their own complications that need to be explored too.
Sample size calculation in medical researchKannan Iyanar
A short description on estimation of sample size in health care research. It describes the basic concepts in sample size estimation and various important formulae used for it.
A practical guide to do primary research on meta analysis methodology - PubricaPubrica
• Conventional meta-analysis research techniques are extended to accommodate methods and practices found in basic research.
• Apart from clinical research, where consolidation efforts are facilitated by systematic review and meta-analysis research, basic science occasionally use such rigorous quantitative methods.
Reference: http://bit.ly/2N2iVg8
Continue Reading: https://pubrica.com/services/research-services/meta-analysis/
Why Pubrica?
When you order our services, Plagiarism free|onTime|outstanding customer support|Unlimited Revisions support|High-quality Subject Matter Experts.
Contact us :
Web: https://pubrica.com/
Blog: https://pubrica.com/academy/
Email: sales@pubrica.com
WhatsApp : +91 9884350006
United Kingdom: +44- 74248 10299
Non-inferiority and Equivalence Study design considerations and sample sizenQuery
About the webinar
This webinar examines the role of non-inferiority and equivalence in study design
In this free webinar, you will learn about:
-Regulatory information on this type of study design
-Considerations for study design and your sample size
-Practical worked examples of
--Non-inferiority Testing
--Equivalence Testing
Duration - 60 minutes
Speaker: Ronan Fitzpatrick, Head of Statistics, Statsols
Watch the video at: https://www.statsols.com/webinars
Big data vs the RCT - Derek Angus - SSAI2017scanFOAM
The document describes a novel platform trial design called REMAP (Randomized, Embedded, Multifactorial, Adaptive Platform) that aims to efficiently test multiple interventions for critical illness. It utilizes a point-of-care embedded design within electronic health records to rapidly enroll patients and assign multifactorial intervention regimens based on a Bayesian statistical model. The model continuously updates probabilities of intervention effectiveness based on accumulating trial data and can trigger results when an intervention is found to be superior, equivalent, or inferior for a given patient subgroup. This allows the trial to efficiently evaluate and adapt multiple treatment options in a real-world intensive care setting.
Defining a Central Monitoring Capability: Sharing the Experience of TransCele...www.datatrak.com
Central monitoring, on-site monitoring, and off-site monitoring provide an integrated approach to clinical trial quality management. TransCelerate distinguishes central monitoring from other types of central data review activities and puts it in the context of an overall monitoring strategy. Any organization seeking to implement central monitoring will need people with the right skills, technology options that support a holistic review of study-related information, and adaptable processes. There are different approaches actively being used to implement central monitoring. This article provides a description of how companies are deploying central monitoring, as well as samples of the workflows that illustrate how some have implemented it. The desired outcomes include earlier, more predictive detection of quality issues. This paper describes the initial implementation steps designed to learn what organizational capabilities are necessary.
This document provides an overview of risk-based monitoring (RBM) for clinical trials. It discusses the history and evolution of RBM, which originated from quality by design principles. The document outlines an 8-step RBM methodology involving assessing risks, determining key risk indicators and performance thresholds, defining response plans, communication plans, and adjusting the plan based on monitoring results. It also discusses how electronic tools can facilitate remote, centralized RBM using metrics and dashboards. The role of clinical research associates is shifting from on-site monitoring to focusing monitoring efforts based on risk-driven data.
White Paper: From Here to Risk-Based MonitoringFreedom Monk
This white paper discusses risk-based monitoring approaches for clinical trials. It provides a framework for comparing different risk-based monitoring solutions, focusing on tailoring the approach for each individual study, looking backward to correct past errors, monitoring in real-time, ensuring future success through error prediction and prevention, and planning a successful transition. The paper emphasizes the importance of individualizing monitoring plans for each specific study based on risks, adjusting plans as needed during the study based on observed circumstances, and using metrics and indicators to proactively manage quality and performance in real-time rather than just focusing on detecting errors after the fact.
This document provides an overview of quality improvement (QI) concepts and tools. It discusses the key dimensions of healthcare quality and defines QI. The QI journey is summarized as building willingness for change, understanding the current system, developing aims and change ideas, testing changes using the PDSA cycle, implementing successful changes, and spreading changes. Popular QI tools introduced include driver diagrams, process mapping, the Model for Improvement, statistical process control charts, and Plan-Do-Study-Act cycles. Tips for successful QI projects emphasize clear aims, manageable scope, leadership, engagement, data, measures, and sharing learning.
The document discusses key concepts in statistics and risk management including probability, sampling, measures of central tendency, dispersion, and graphical presentation of data. It covers probability distributions like Poisson and exponential that can be applied to business continuity and risk analysis. Forecasting techniques like moving average and exponential smoothing are also summarized.
The document provides guidance on conducting patient and staff surveys at The Christie, outlining the approval process, survey design considerations, questionnaire design tips, information governance requirements, and support available from the Quality Improvement and Clinical Audit (QICA) team. Proper planning and following best practices are emphasized to ensure surveys are necessary, designed well, protect patient privacy, and can inform quality improvement efforts.
This document provides guidance on conducting patient and staff surveys at The Christie hospital. It covers the approval process, survey design, questionnaire design, information governance, and support available from the Quality Improvement, Clinical Audit and Effectiveness (QICA) team. Key points include:
- All surveys must be registered and approved by submitting a proposal form to the QICA team.
- Surveys should be necessary and avoid over-surveying patients who are under stress.
- Guidance is provided on patient selection, data collection methods, questionnaire design best practices, and information governance considerations like consent and anonymization.
- The QICA team can provide support and advice on all aspects of the survey process.
Innovative Strategies For Successful Trial Design - Webinar SlidesnQuery
Full webinar available here: https://www.statsols.com/webinar/innovative-strategies-for-successful-trial-design
[Webinar] Innovative Strategies For Successful Trial Design- In this free webinar, you will learn about:
- The challenges facing your trials
- How to calculate the correct sample size
- Worked examples including Mixed/Hierarchical Models
- Posterior Error
- Adaptive Designs For Survival
www.statsols.com
Power and sample size calculations for survival analysis webinar SlidesnQuery
This webinar presentation introduced sample size determination for survival analysis. It discussed how to estimate the appropriate sample size, key considerations for survival analysis including expected survival curves and handling dropouts. It demonstrated an example in nQuery software to calculate the sample size needed for a clinical trial to show a risk reduction in progression-free survival between treatment arms. The webinar concluded with plans to further enhance survival analysis capabilities in nQuery and addressed questions from participants.
Evaluating National Malaria Programs’ Impact in Moderate- and Low-Transmissio...MEASURE Evaluation
The framework highlights the importance of routine surveillance data and confirmed malaria incidence for evaluating national malaria programs in low- and moderate-transmission settings. Process evaluations assess program performance and coverage to determine when impact evaluations are needed. Impact evaluations then measure reductions in malaria burden using methods like interrupted time series and constructed controls while accounting for other factors. Key challenges include defining intervention maturity and coverage thresholds needed to achieve measurable impact. The framework emphasizes continuous evaluation along the implementation and impact pathways to guide program decisions.
The document discusses sample size determination for clinical and epidemiological research. It explains that proper sample size is important for validity, accuracy, and reliability of research findings. Key factors to consider in sample size calculations include the study objective, details of the intervention, outcomes, covariates, research design, and study subjects. Precision analysis and power analysis are two common approaches, with power analysis being most suitable for studies aiming to detect an effect. The document provides formulas and examples for calculating sample sizes for comparative and descriptive studies with both continuous and dichotomous outcomes. It also discusses the concepts of type I and II errors and their relationship to statistical power.
This document provides an outline for a presentation on determining sample size. It discusses key concepts like what sample size is, why determining an appropriate sample size is important, and factors that affect sample size calculations like available resources, required accuracy, and study design. The presentation aims to help audiences understand how to determine sample sizes and how to apply the concept in research and studies.
Planning clinical supplies has become more complex due to increased trial numbers, reduced timelines, recruitment challenges, and globalization. Forecasting and simulation tools help sponsors determine initial supply needs, optimize supply chain strategies, and ensure supplies remain sufficient. An interactive response technology system automates supply management and provides real-time data to forecasting dashboards. These dashboards allow exploring scenarios to prevent issues like stockouts and optimize efficiency. Regularly checking forecasts enables proactive management of clinical supplies.
1. The document discusses strategies for designing large cardiovascular outcomes trials to evaluate new diabetes drugs.
2. One strategy addresses pre-marketing and post-marketing objectives simultaneously through a single meta-analysis of all trial data including an ongoing cardiovascular outcomes trial. Interim analyses would be used to assess the 1.8 and 1.3 risk thresholds.
3. An alternative strategy addresses the objectives separately, using a meta-analysis of earlier trials for pre-marketing approval and a separate post-marketing cardiovascular outcomes trial for the 1.3 risk assessment.
Group project
Population : The elderly
Communicator: Sidney
Topic: Injury prone (Nursing home, diseases, trauma, statistics
Title: Fall and Injury Prevent for the Elderly patients
Set age group: 60-75
Gender: Both male and female
Ethnicity: will briefly discuss how other ethnicities are correlates with this data
Goals and Objectives:
Reduce injuries in nursing homes
Educational programs for employers
Know signs and symptoms for serious trauma minor or huge
Documentation that prevention is key (objective)
Set specific needs for elderly, identify program focus
Come up with time line for statistics
Source: chapter 10 fall and injury prevention
Needs:
Set more goals and objectives
Data
Basis of what We want to do for our program
What moto will we use?
Program Ideas:
Offer a class over prevention
Send trained professional to admit training
Inform patients on a way to prevent falling
Certification of test after class
Proper equipment (gate belts, lifts, rails, and walkers)
Conduct survey than evaluate the results
Signs indicating reminders of safety tips
Cautious of prescribed medicines and,diets that they have
Assess patient risk
Implementation:
*precede procedure method
Precede: help with measurable objectives for projects
Proceed- monitor quality of methods to keep program going
Overview- program cost X amount
Whats 1st?
Send trained professional
Educate the workers + certifications
Assess patient needs
Inform patients over information
Assess what equipment is needed
Safety tips are posted
Look at increase + decrease of falls (stats)
Survey the effectiveness of programs
Go in depth of how survey results affect the program and ETC
Survey should go to nursing home administrator
Make a short survey
Part 1.Program assessment- someone (
Two Slides of power point)
Part 2.Planning- someone (
Two Slides of power point)
Part 3.Goals and objectives- someone (
Two Slides of power point)
Part 4.Development and implementation- someone (
Two Slides of power point)
Part 5.Evaluating the results- Me :
( One page , One source And Two Slides of power point)
YOU HAVE to Take Care of THIS PART
(
Evaluating the results)
And Than do Power Point for all Group project 10 Slides 2 Slides for each Part
***Evaluating the results- Me :
( One page , One source And Two Slides of power point)
.
Clinical Research Statistics for Non-StatisticiansBrook White, PMP
Through real-world examples, this presentation teaches strategies for choosing appropriate outcome measures, methods for analysis and randomization, and sample sizes as well as tips for collecting the right data to answer your scientific questions.
The Blueprint for Success for Effective and Efficient Clinical Protocols.pptxMMS Holdings
The document discusses efficiencies in clinical trial design including:
- New statistical methods like accelerated titration designs, modified toxicity probability intervals, and continual reassessment methods that allow for faster dose escalation compared to traditional 3+3 designs.
- Adaptive designs that allow modifications to the trial based on accumulating data like changing the sample size or stopping early.
- Using phase 0 trials to obtain preliminary data before traditional phase 1 trials to better inform dose escalation and safety.
- Master protocols that allow multiple substudies under a single umbrella protocol for related research questions.
Cyrus Mehta outlines four new initiatives for enhancing the simulation capabilities of East: 1) permitting external calls to R and SAS, 2) conditional simulation of trial remainder given interim data, 3) multi-arm group sequential designs, and 4) population enrichment designs. He discusses challenges in software for event-driven trials and how population enrichment can improve late-stage oncology trial success rates. The presentation provides examples of conditional simulation plots and a proposed two-stage adaptive design for population enrichment. Mehta is optimistic about Cytel's future in advancing adaptive trial methodology software over the next 25 years.
Eugm 2012 mehta - future plans for east - 2012 eugmCytel USA
Cyrus Mehta outlines four new initiatives for enhancing the simulation capabilities of East: 1) permitting external calls to R and SAS, 2) conditional simulation of trial remainder given interim data, 3) multi-arm group sequential designs, and 4) population enrichment designs. He discusses challenges in software for event-driven trials and how population enrichment can improve late-stage oncology trial success rates. The presentation provides examples of adaptive designs and concludes by thanking participants for ideas to further develop Cytel's software.
The document discusses various concepts related to health planning including strategic planning, situational analysis, problem identification, priority setting, options appraisal, cost-effectiveness analysis, force field analysis, programming and documentation, logframe analysis, and monitoring and evaluation. It provides examples of how these concepts can be applied to improve the health of mothers and children in a given population with a limited budget.
Measurement Control Risk Based Test Cases Activities Latw09Júlio Venâncio
1) The document discusses defining metrics to measure and control risk-based testing activities and test cases. It describes applying the Goal Question Metric approach to define relevant metrics.
2) A case study is described where risks were identified for a Health-Watcher system and students tracked time spent on risk-based testing activities to collect metric values.
3) Metrics were proposed to measure aspects like risk identification, analysis and priority, time spent on activities, and number of test cases targeting different risks. The aim is to support risk-based testing process improvement.
Presentation on the examination of microbiological data for assessment and trending.
Includes: normalizing data, graphs, and assessment of alert and action levels.
Certified Specialist Business Intelligence (.docxdurantheseldine
Certified Specialist Business
Intelligence (CSBI) Reflection
Part 5 of 6
CSBI Course 5: Business Intelligence and Analytical and Quantitative Skills
● Thinking about the Basics
● The Basic Elements of Experimental Design
● Sampling
● Common Mistakes in Analysis
● Opportunities and Problems to Solve
● The Low Severity Level ED (SL5P) Case Setup as an Example of BI Work
● Meaningful Analytic Structures
Analysis and Statistics
A key aspect of the work of the BI/Analytics consultant is analysis. Analysis can be defined as
how the data is turned into information. Information is the outcome when the data is analyzed
correctly.
Rigorous analysis is having the best chance of creating the sharpest picture of what the data
might reveal and is the product of proper application of statistics and experimental design.
Statistics encompasses a complex and detailed series of disciplines. Statistical concepts are
foundational to all descriptive, predictive and prescriptive analytic applications. However, the
application of simple descriptive statistical calculations yields a great deal of usable information
for transformational decision-making. The value of the information is amplified when using these
same simple statistics within the context of a well-designed experiment.
This module is not designed to teach one statistic. It is designed to place statistical work within
the appropriate context so that it can be leveraged most effectively in driving organizational
performance..
An important review of the basic knowledge for work with descriptive and inferential statistics.
The Basic Elements of Experimental Design
Analytic tools also can provide an enhanced ability to conduct experiments. More than just
allowing analysis of output of activities or processes, experiments can be performed on
processes and the output of processes. Experimenting on processes is a movement beyond
the traditional r.
The document discusses the role and responsibilities of statisticians in clinical trials. It notes that statisticians can help at all stages of clinical trials from study design to analysis and reporting. Specifically, statisticians can help choose appropriate study designs, determine sample sizes, implement randomization and blinding procedures, monitor trial safety and conduct interim analyses, and analyze and interpret trial results. The document emphasizes that involving statisticians early in the research process allows them to provide valuable input that can improve study design and ensure the research question is properly addressed.
This is a study case in all the photosthe SIPOC diagram bel.pdfjkcs20004
This is a study case in all the photos
the SIPOC diagram bellow is incomplete and wrong I need to fix it
Perfect Match TEAM APPLIES n January 2008, the University of Toledo Medical Center
(UTMC) in northwest Ohio collaborated with the University of Toledo's Industrial SIX SIGMA
TO Engineering Department to analyze and improve the preoperational processes for patients
undergoing kidney transplants. Six Sigma was applied to the REDUCE TIME project, and the
following goals were established: IT TAKES TO - Optimize cycle times. QUALIFY PATIENTS
- Enhance customer satisfaction. - Improve efficiencies. FOR KIDNEY - Reduce costs.
TRANSPLANTS - Streamline administrative processes. - Eliminate errors. - Improve protocol
execution and effectiveness. The project's primary metric was the number of days required from
the date a patient was referred to UTMC for a kidney transplant to the date the hospital staff
declared the patient a suitable transplant candidate. The research By Matthew was needed and
the project selected because of an increase in the number of Franchetti and year because of the
increased service area for UTMC. Because of a waiting list of nearly 500 patients, it was
determined a reduced cycle time would save lives. Kyle Bedal, Background and terminology
University of For more than 30 years, UTMC has performed adult and pediatric kidney Toledo
transplants as one of the treatment options for end-stage renal disease. Since UTMC's first
kidney transplant operation in 1972, more than 1,500 kidney transplant operations have been
performed there, with an average patient survival rate of 98% and a graft survival rate of 94%.
The program relies on advanced surgical techniques-including laparoscopic kidney donation,
improved anti-rejection medications and high-quality patient care-to make it one of the most
successful programs in the country. There are a number of steps patients must complete before
receiving a kidney transplant. Generally, the patient must be referred to a medical center and
complete required labs and tests to determine if he or she is suitable. The labs and tests are
usually similar among all transplant centers and among patients. The labs include tuberculosis
(TB) tests, dental clearance, a colonoscopy, chest X-rays, electrocardiography tests, stool
samples, blood work, mammograms, pap smears and diabetes tests. Once the patient fulfills the
requirements, a committee reviews the results and determines whether the patient is a good
candidate. The patient is then allowed to receive a kidney; this is called being "listed," or placed
on the waiting list.
Fil TB EK Often, the time required to complete these health Partnering With Your Transplant
Team, The Patient's Guide screenings is up to nine months. In addition, another to
Transplantation. 2 two years may pass after the patient is listed before a The team deployed the
define, measure, analyze, kidney transplant is performed. improve and control (DMAIC)
approach for this Six It is.
Audit and stat for medical professionalsNadir Mehmood
This document discusses clinical audit and statistics. It begins by defining audit and its importance in clinical practice. The document outlines the types of audit and how statistics are used in clinical practice. It discusses the components of a clinical audit and defines key statistical terms like population, sample, and descriptive statistics. The document provides examples to illustrate statistical concepts and calculations like descriptive statistics and the area under the curve of a normal distribution. It emphasizes that the goal of statistics is to summarize data in a way that is understandable for non-statisticians.
The document discusses a project to analyze and predict sepsis early using clinical data. It aims to predict sepsis 6 hours before clinical diagnosis to allow for earlier treatment. The author handles missing data and class imbalance in a large dataset. Features are engineered and selected. Decision trees and XGBoost models are used for prediction, achieving partial success. Further research is needed on time-series modeling, feature importance, and model performance with a domain expert.
Data Con LA 2019 - Best Practices for Prototyping Machine Learning Models for...Data Con LA
Medical institutions, universities and software giants like Google and Microsoft are dedicating increasing resources to machine learning for healthcare. This is a very exciting but relatively young field. However, best practices for methods and reporting of results are not yet fully established. I have 2.5 years of experience as data scientist at a national cancer center working on clinical data, evaluating external vendors and peer reviewing machine learning in healthcare papers. The talk gives an overview of best practices in prototyping machine learning models on data from the patient electronic health record (EHR). The topics addressed are:1. Introduction to the EHR2. Overview of machine learning applications to the EHR3. Cohort definition for survival problems4. Data cleaning5. Performance metricsExcerpts of papers from renowned institutions will be critically reviewed. The material is intended to be useful not only to machine learning for healthcare professionals, but to practitioners dealing with very unbalanced dataset in the temporal domain. For example, customer churn prediction can be modeled as survival problem.
This document discusses an adaptive clinical trial design that was used in a phase III oncology study. The particular adaptation was an unblinded sample size re-estimation based on interim analysis results. This required changes to the SDTM and ADaM data models to account for the interim analysis cut-off dates. The reviewer guides were also updated to explain how to identify patients in the interim analysis and which analysis datasets to use for re-calculating results based on the interim and final cut-offs.
This document provides an overview of research methods and statistical concepts. It discusses research design types including descriptive, historical, and experimental. Experimental design can be true experiments or quasi-experiments. It also discusses quantitative and qualitative research approaches and mixed methods. Key statistical concepts are defined, such as population, sample, probability and non-probability sampling, and levels of measurement. Common statistical tests are introduced along with important assumptions. The document provides guidance on how to measure learning experimentally using different research designs. It also discusses how to determine appropriate sample sizes and select statistical analyses based on the research questions.
This document discusses the evolving role of statisticians in clinical research. It begins with an introduction of the presenter. The presentation then outlines how statisticians contribute throughout the different stages of a clinical study, including study planning, start-up, maintenance, risk-based monitoring, data monitoring committees, end of study analysis, and reporting. It emphasizes that statisticians can add more value through activities such as data management programming, cross-study analyses, organizational statistics, and training. The presentation concludes by encouraging clinical research organizations to keep statisticians involved, ask them questions, and make full use of their skills and expertise throughout all phases of a clinical study.
Protocol Design & Development: What You Need to Know to Ensure a Successful S...Brook White, PMP
Solid protocol design is critical to clinical development. No matter how well executed a clinical study is, if the underlying design is flawed, it wasn’t worth doing. In this presentation, Dr. David Shoemaker, SVP R&D, and Dr. Karen Kesler, AVP Operations, will walk through the process of developing a protocol, explain the major considerations, and point out common mistakes and challenges.
Similar to D1 design and analysis approaches to evaluate cardiovascular risk - 2012 eugm (20)
This document summarizes a webinar presentation about adaptive sample size re-estimation for confirmatory time-to-event trials. The presentation discusses a motivating lung cancer trial example and introduces a promising zone design where the sample size is increased only if interim results fall within a promising zone. It demonstrates the design, simulation, and interim monitoring capabilities of East®SurvAdapt software. Key aspects of the adaptive design methodology are discussed, including conditional power calculations, maintaining type 1 error control, and balancing sample size increases with trial duration.
Adaptive Drug Development Programs for Phases 2 and 3 in Neuropathic Pain - 2...therealreverendbayes
- The document describes a simulation plan to investigate adaptive Phase 2b and Phase 3 development programs for neuropathic pain drugs. The simulation evaluates different Phase 2 sample sizes, numbers of doses, and adaptive designs based on probability of success, number of patients, and expected profit.
- The simulation models efficacy and safety dose response curves, nuisance and serious adverse events, Phase 2b and 3 trial designs, and a commercial model to calculate net present value. Initial results from the base case are presented.
Designing Adaptive Programs for Neuropathic Pain and the Product Revenue impl...therealreverendbayes
This document discusses optimizing clinical trial designs for neuropathic pain drug development programs. It presents statistical models to simulate Phase 2b and Phase 3 trials, estimate probability of success, and calculate expected net present value. Simulation results show that selecting the dose based on maximum utility rather than just efficacy, and optimizing Phase 2b and Phase 3 sample sizes can improve expected profit by up to 30% compared to default designs. Reducing the minimum patient exposure requirements from regulatory guidance also increases potential profit.
This document discusses efficacy endpoints in oncology drug development. It begins with an introduction to endpoints used in early and late phase trials. Overall survival is discussed as the gold standard, but surrogate endpoints are also examined, including objective response rate, progression-free survival, and time to progression. Considerations for various surrogate endpoints like bias, validation, and data management are provided. The document reviews regulatory requirements and considerations for different cancer types and endpoints.
D6 transforming oncology development with adaptive studies - 2011-04therealreverendbayes
This document discusses adaptive clinical trial designs, which allow modifications to trials based on interim data analysis. It provides an example of using a promising zone design for a phase 3 oncology trial testing a new treatment for metastatic non-small cell lung cancer. The design calls for an interim analysis when 50% of required events are reached, with the option to increase the sample size if results fall within a promising zone, defined as a conditional power between 30-90%, indicating the treatment may be beneficial. Simulations show this adaptive approach maintains high power even if the treatment effect is smaller than initially estimated.
This document discusses experiences with program-level modeling and simulation (M&S) of drug development programs. It presents a case study using M&S to optimize the design of a Phase 2 and Phase 3 clinical trial program for a neuropathic pain drug. The M&S evaluated factors like dose selection methods, Phase 2 sample size, and dose-response models. It found that maximizing clinical utility for dose selection and larger Phase 2 samples improved the probability of success and expected value compared to traditional methods. M&S allowed quantitative evaluation of design choices to better align with commercial objectives like expected net present value. The main challenges were time needed to develop simulation models and integrating inputs from different functions.
E00 program-level modeling and simulation experiences
D1 design and analysis approaches to evaluate cardiovascular risk - 2012 eugm
1. Cytel East Users Group Meeting
Cambridge, Massachusetts
D i d A l i A h
Cambridge, Massachusetts
Design and Analysis Approaches
to Evaluate Cardiovascular Risk
October 12, 2012
11:45-12:15
Brenda Gaydos, Ph.D. Research Fellow
3. Background
• CV disease remains the leading cause of morbidity and mortality in patients
with diabetes
• In light of the potentially harmful CV effects raised with rosiglitazone,
regulatory agencies now require Sponsors to show that a new therapy for
T2DM is not associated with an unacceptable increase in CV risk
Primary
– Hazard Ratio (HR)
– Time to first occurrence of any of the following adjudicated components:
• MACE (or 3-point MACE): CV death, non-fatal MI, non-fatal stroke
• MACE +: typically 4th component hospitalization for unstable angina
– Cox proportional hazards model
– Non-inferiority to standard of care
– ITT population
3
4. FDA guidance: CI for CV Meta AnalysisFDA guidance: CI for CV Meta-Analysis
Upper bound of a 2-Upper bound of a 2
sided 95% CI for
estimated CV risk Ratio
Conclusion
>1.8
Data are inadequate to support approval.
A large safety trial should be conducted
The potential for CV harm may still exist.
1.3 – 1.8* An adequately powered and designed post-marketing trial
is needed to show an upper bound < 1.3
<1.3* Post-marketing CV trial is generally not needed3 g g y
*with a reassuring point estimate
CI = confidence interval
42008 FDA Guidance for Industry: Diabetes Mellitus – Evaluating CV risk in new antidiabetic
therapies to treat type 2 diabetes. www.fda.gov
5. Cardiac Safety Research Consortium
White Paper
Working title Designs and statistical approaches to assess CV• Working title: Designs and statistical approaches to assess CV
risk of new type 2 diabetes therapies in development
• Target journal: American Heart Journal
Objectives
• Increase the quality and efficiency of CV risk assessment of new
therapies to treat T2DMtherapies to treat T2DM
• Propose study designs and statistical analysis methods to meet
current CV safety regulatory requirements
• Discuss operational considerations (e g processes for interim• Discuss operational considerations (e.g. processes for interim
analyses)
• Use simulation to provide examples and discuss impact of
decisionsdecisions
5
6. Typical Development Program
Efficacy Studies
– 3-5 Phase 3 studies (HbA1c is primary)
– 1-2 Phase 2 studies1 2 Phase 2 studies
Discharge 1.8 and 1.3 based on meta-analysis
– Independent, blinded, adjudication of all CV events
– Prospectively planned meta-analysis at end of phase 3
– Sufficient events to allow a meaningful estimate of risk
– Include patients at higher risk of CV events (e.g. relatively advanced
disease elderly patients some degree of renal impairment)disease, elderly patients, some degree of renal impairment)
– Controlled trials of longer duration needed (minimum 2 years)
Challengesg
– Few events
– Typically lower risk population
– Relatively short duration
– Can meet statistical significance, but be inconsistent across sensitivity
analyses
6
7. No Dedicated CV Trial: Challenging
Assume:
– All trials start in parallel; Fixed duration follow-up
1 year to fully enroll a trial; 1% lost to follow up– 1 year to fully enroll a trial; 1% lost to follow-up
– 90% power for non-inferiority (1.3)
True HR Fixed Sample Size Sample Size
Duration (2% event rate
on control)
(1% event rate
on control)
0.80
(178 events)
18 months 10,058 20,017
(178 events)
2 years 6,750 13,405
3 years 4,106 8,118
1
(611 events)
18 months 31,028 61,722
2 years 20 831 41 342
7
2 years 20,831 41,342
3 years 12,681 25,047
8. Some Challenges Initiating a CV Study
Initiate during phase 3 development
– Benefit: Insure timely discharge of 1.8
– Need CV study prior to knowing dose/effect
– If continue the CV study, need to maintain appropriate blind for interim
– True HR unknown (assume equivalent for powering)True HR unknown (assume equivalent for powering)
– Rate of events unknown (over/under estimate N needed to maintain
acceptable duration)
Initiate after phase 3 development
– Risk not meeting 1.8
Same uncertainty in unknown HR and rate of events– Same uncertainty in unknown HR and rate of events
8
9. Statistical Methods
Setting
• Desirable to initiate a CV study in phase 3 development
• Desirable to leverage accruing information to mitigate risk in the
presence of so much uncertainty
• Focus on methods that are well understoodFocus on methods that are well understood
MethodsMethods
– Meta-analysis
– Group Sequential Designs
R ti ti # t– Re-estimating #events
– Sample-size re-estimation
9
10. Statistical Methods
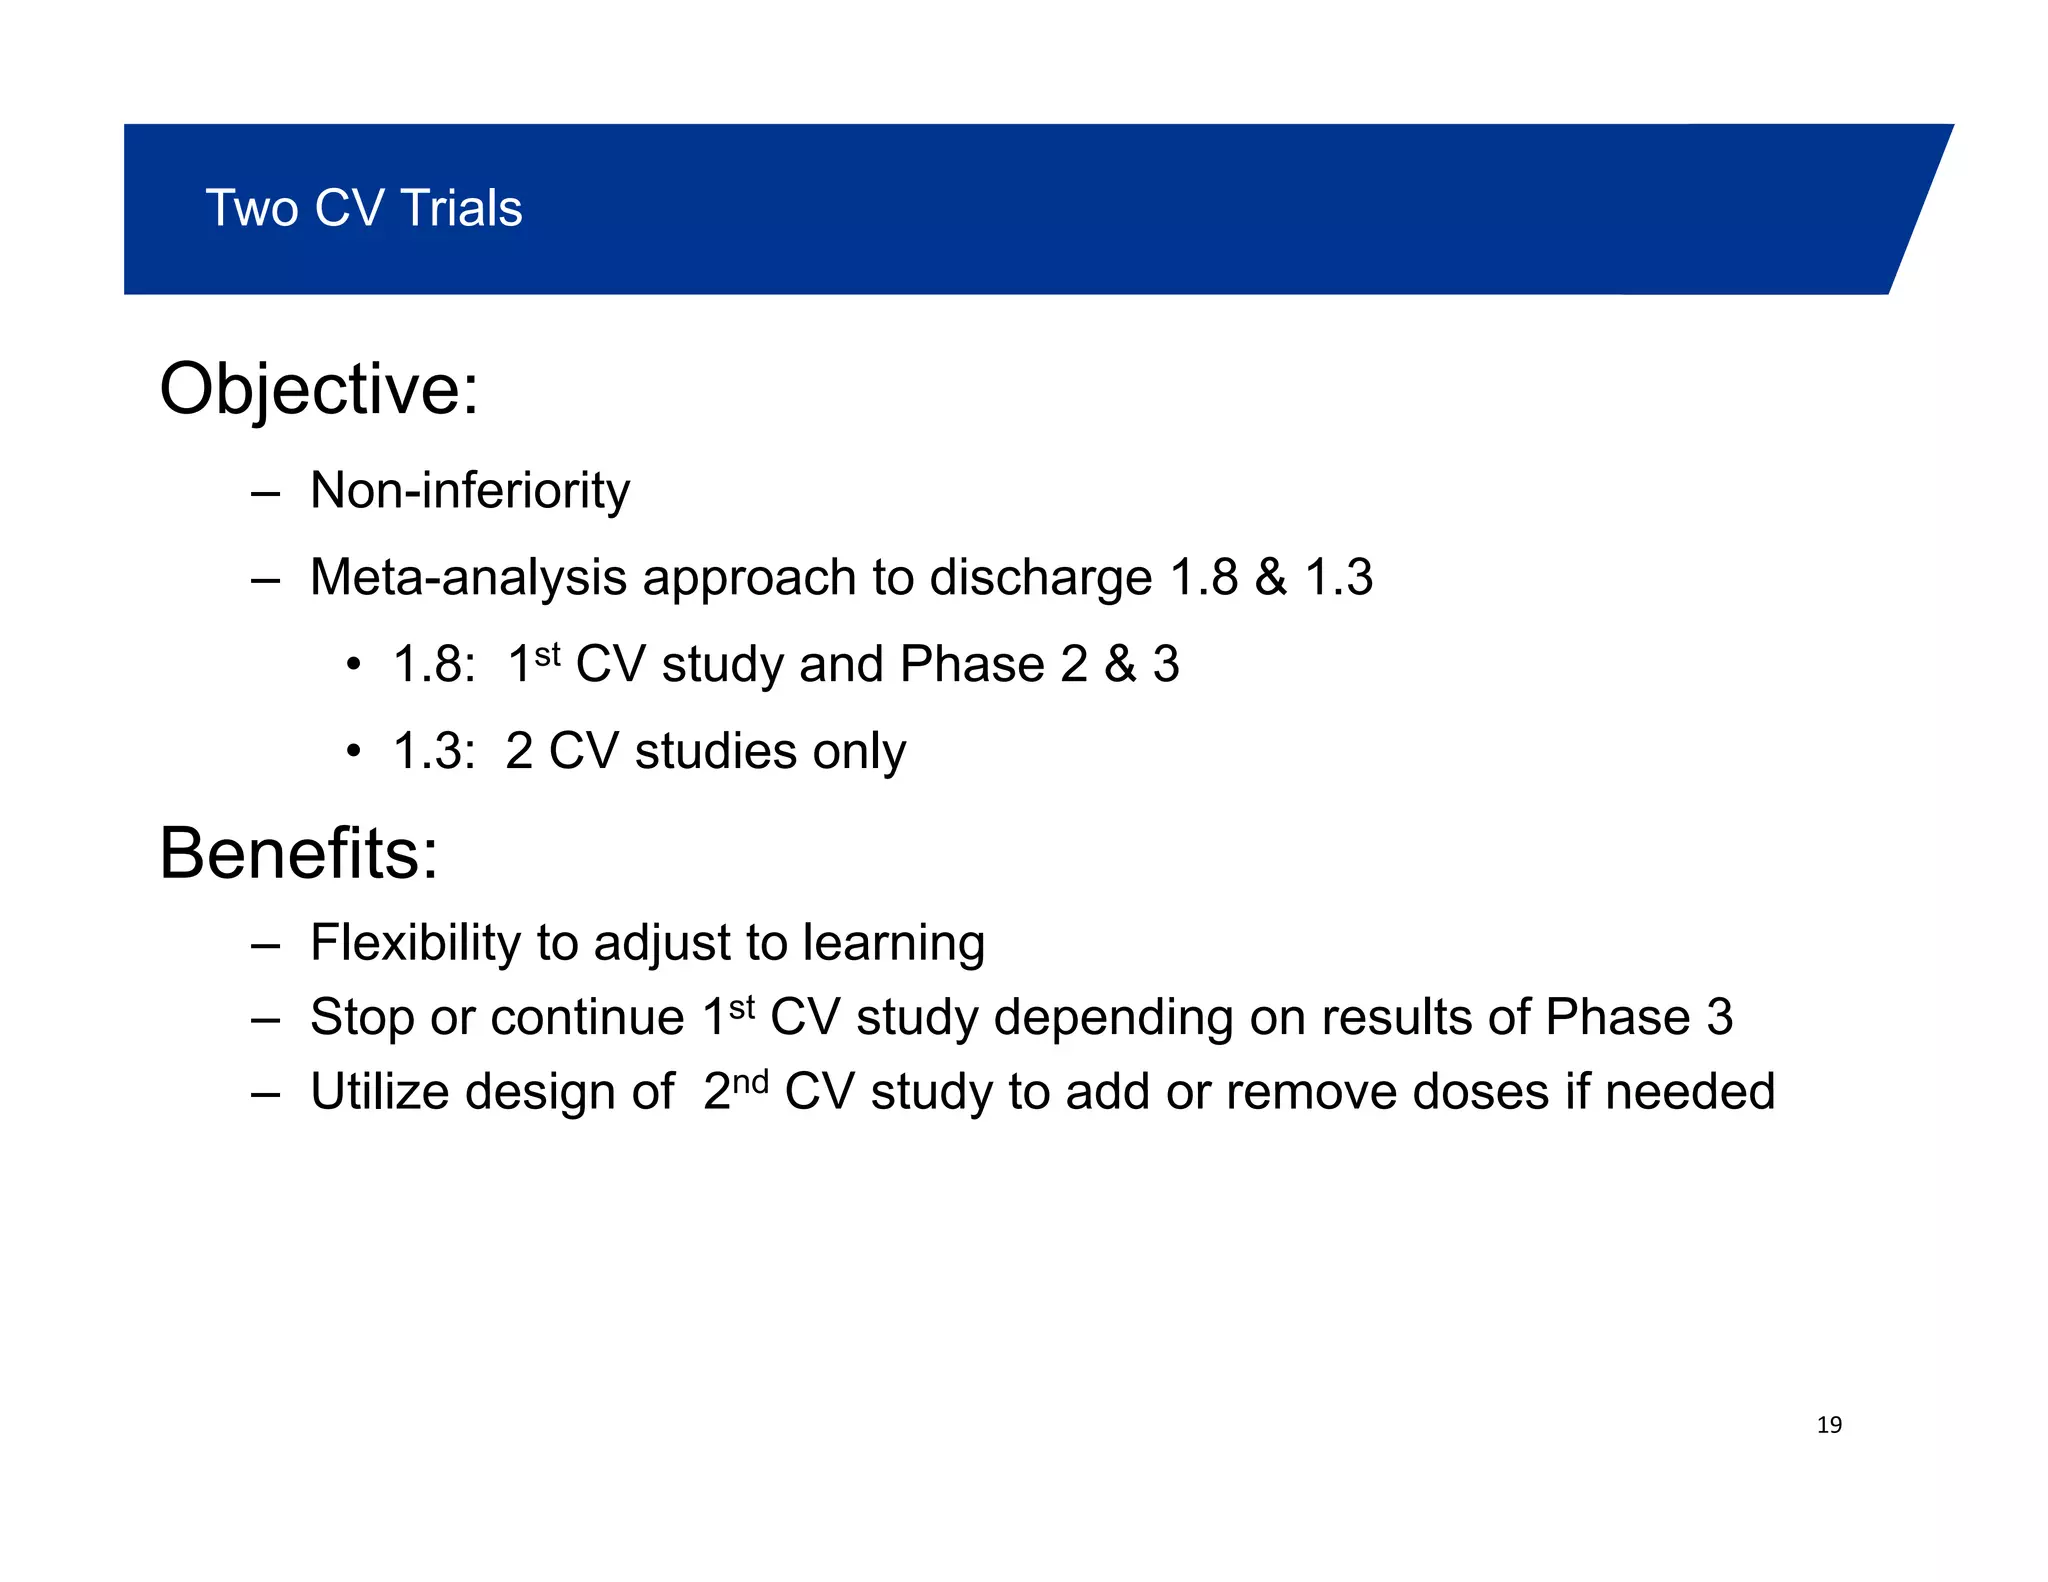
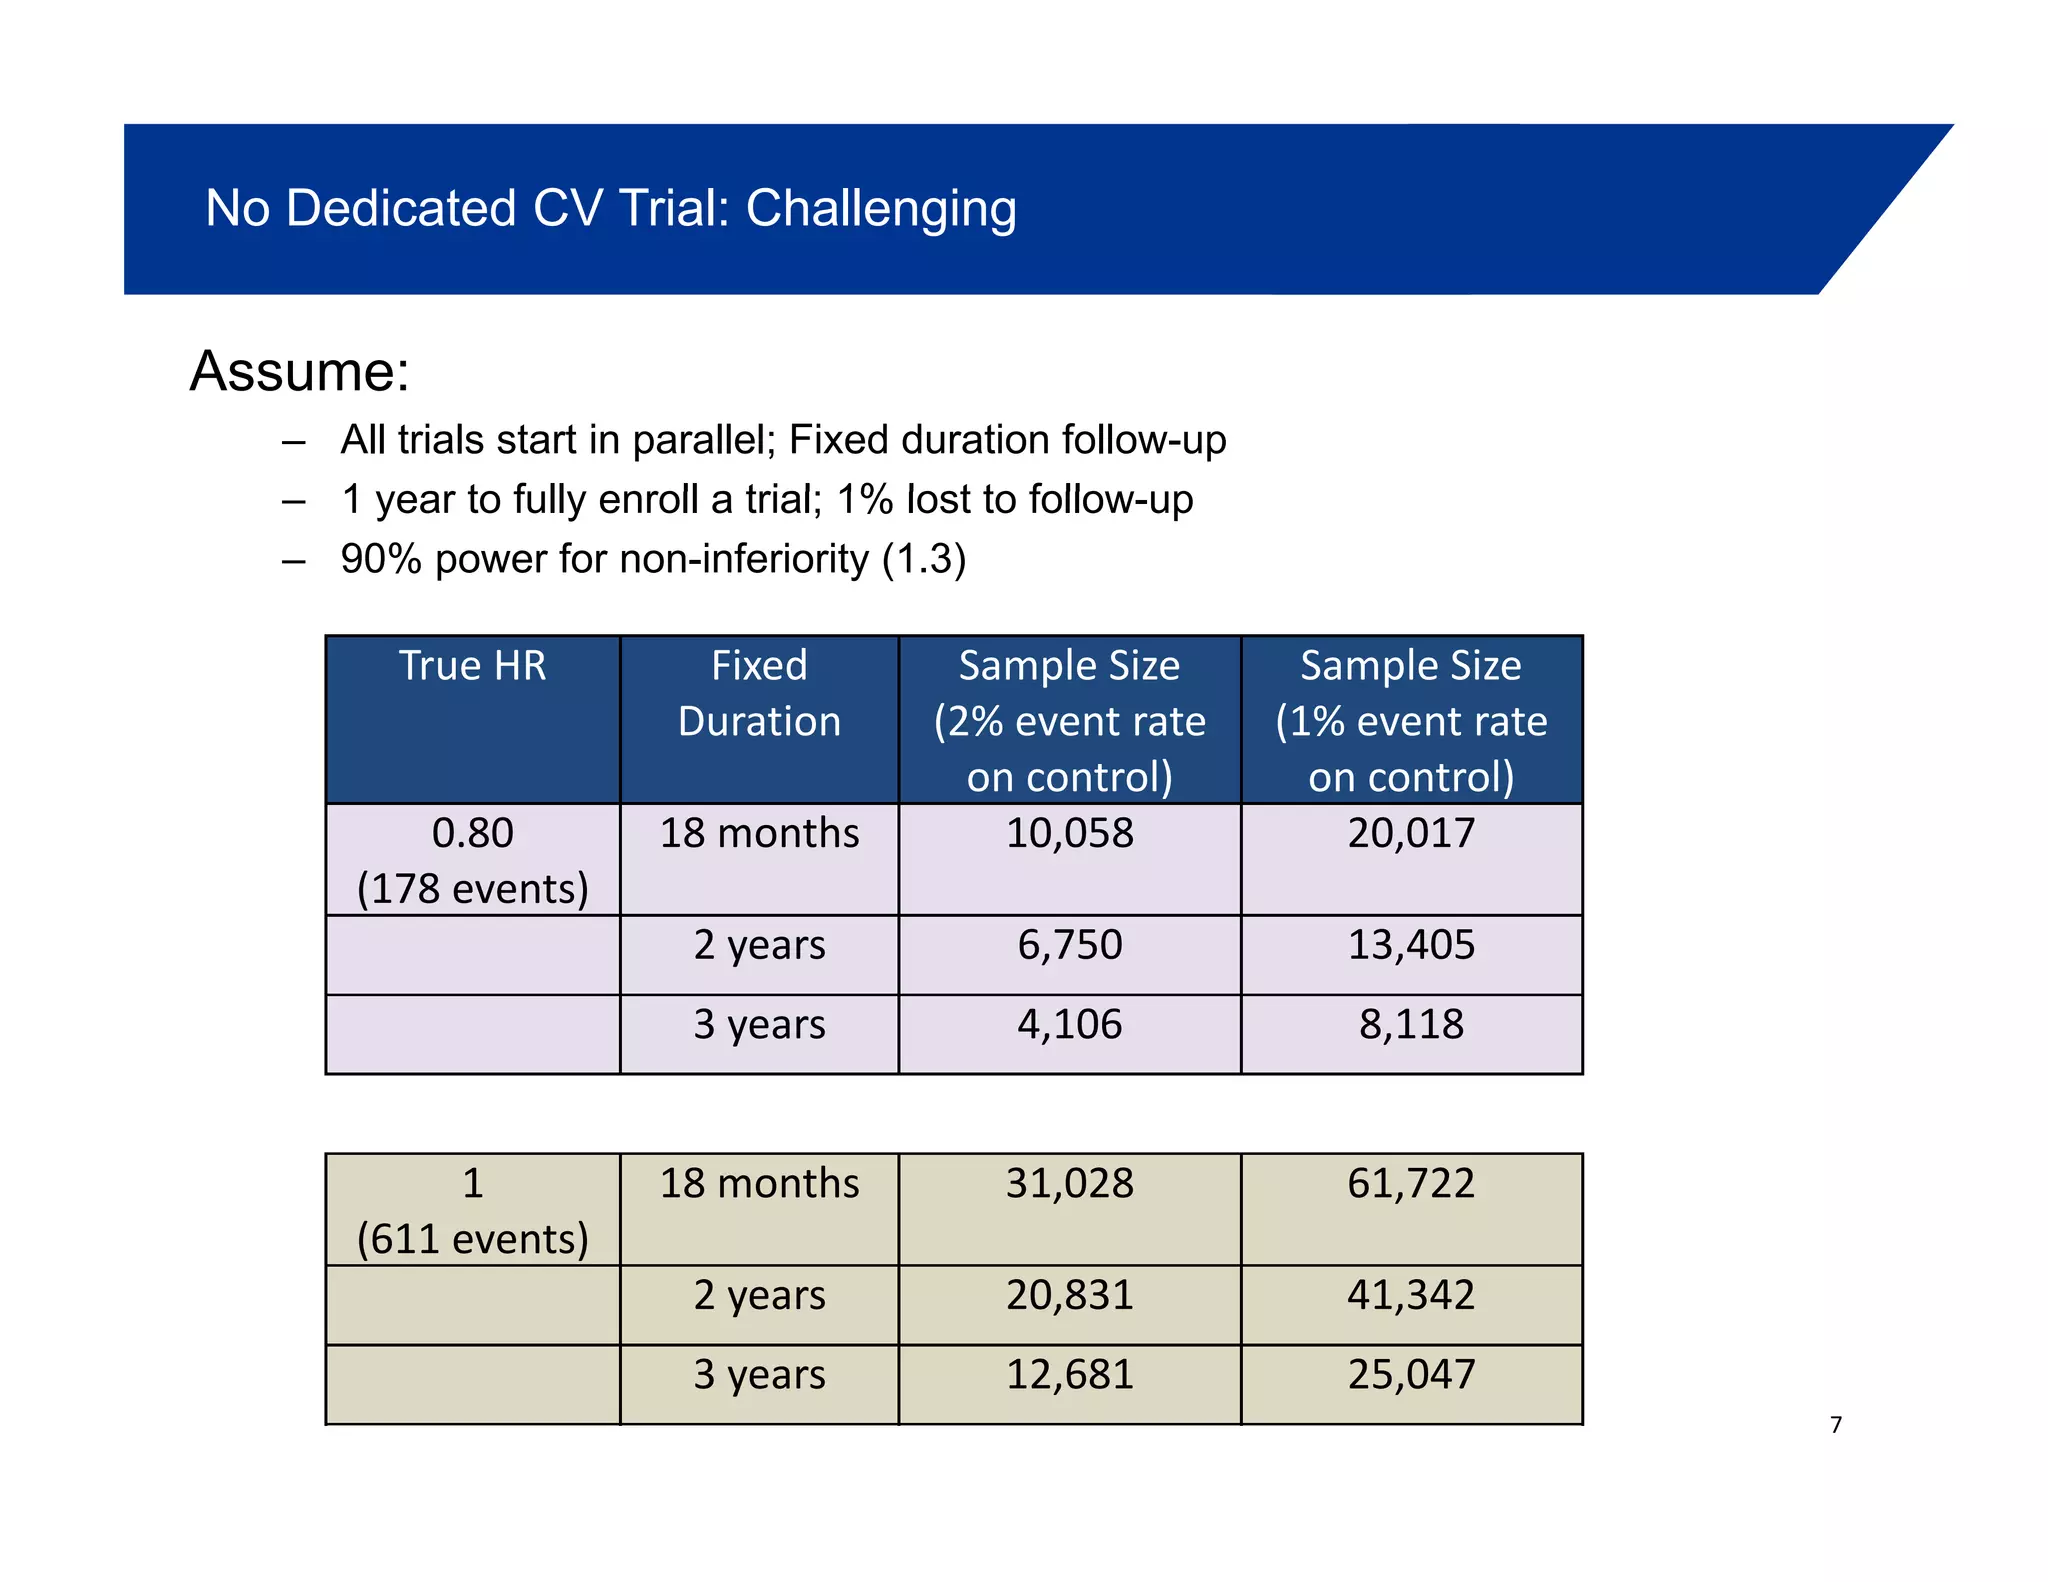
Meta-Analysis: Reduce patient exposure by efficiently utilizing events
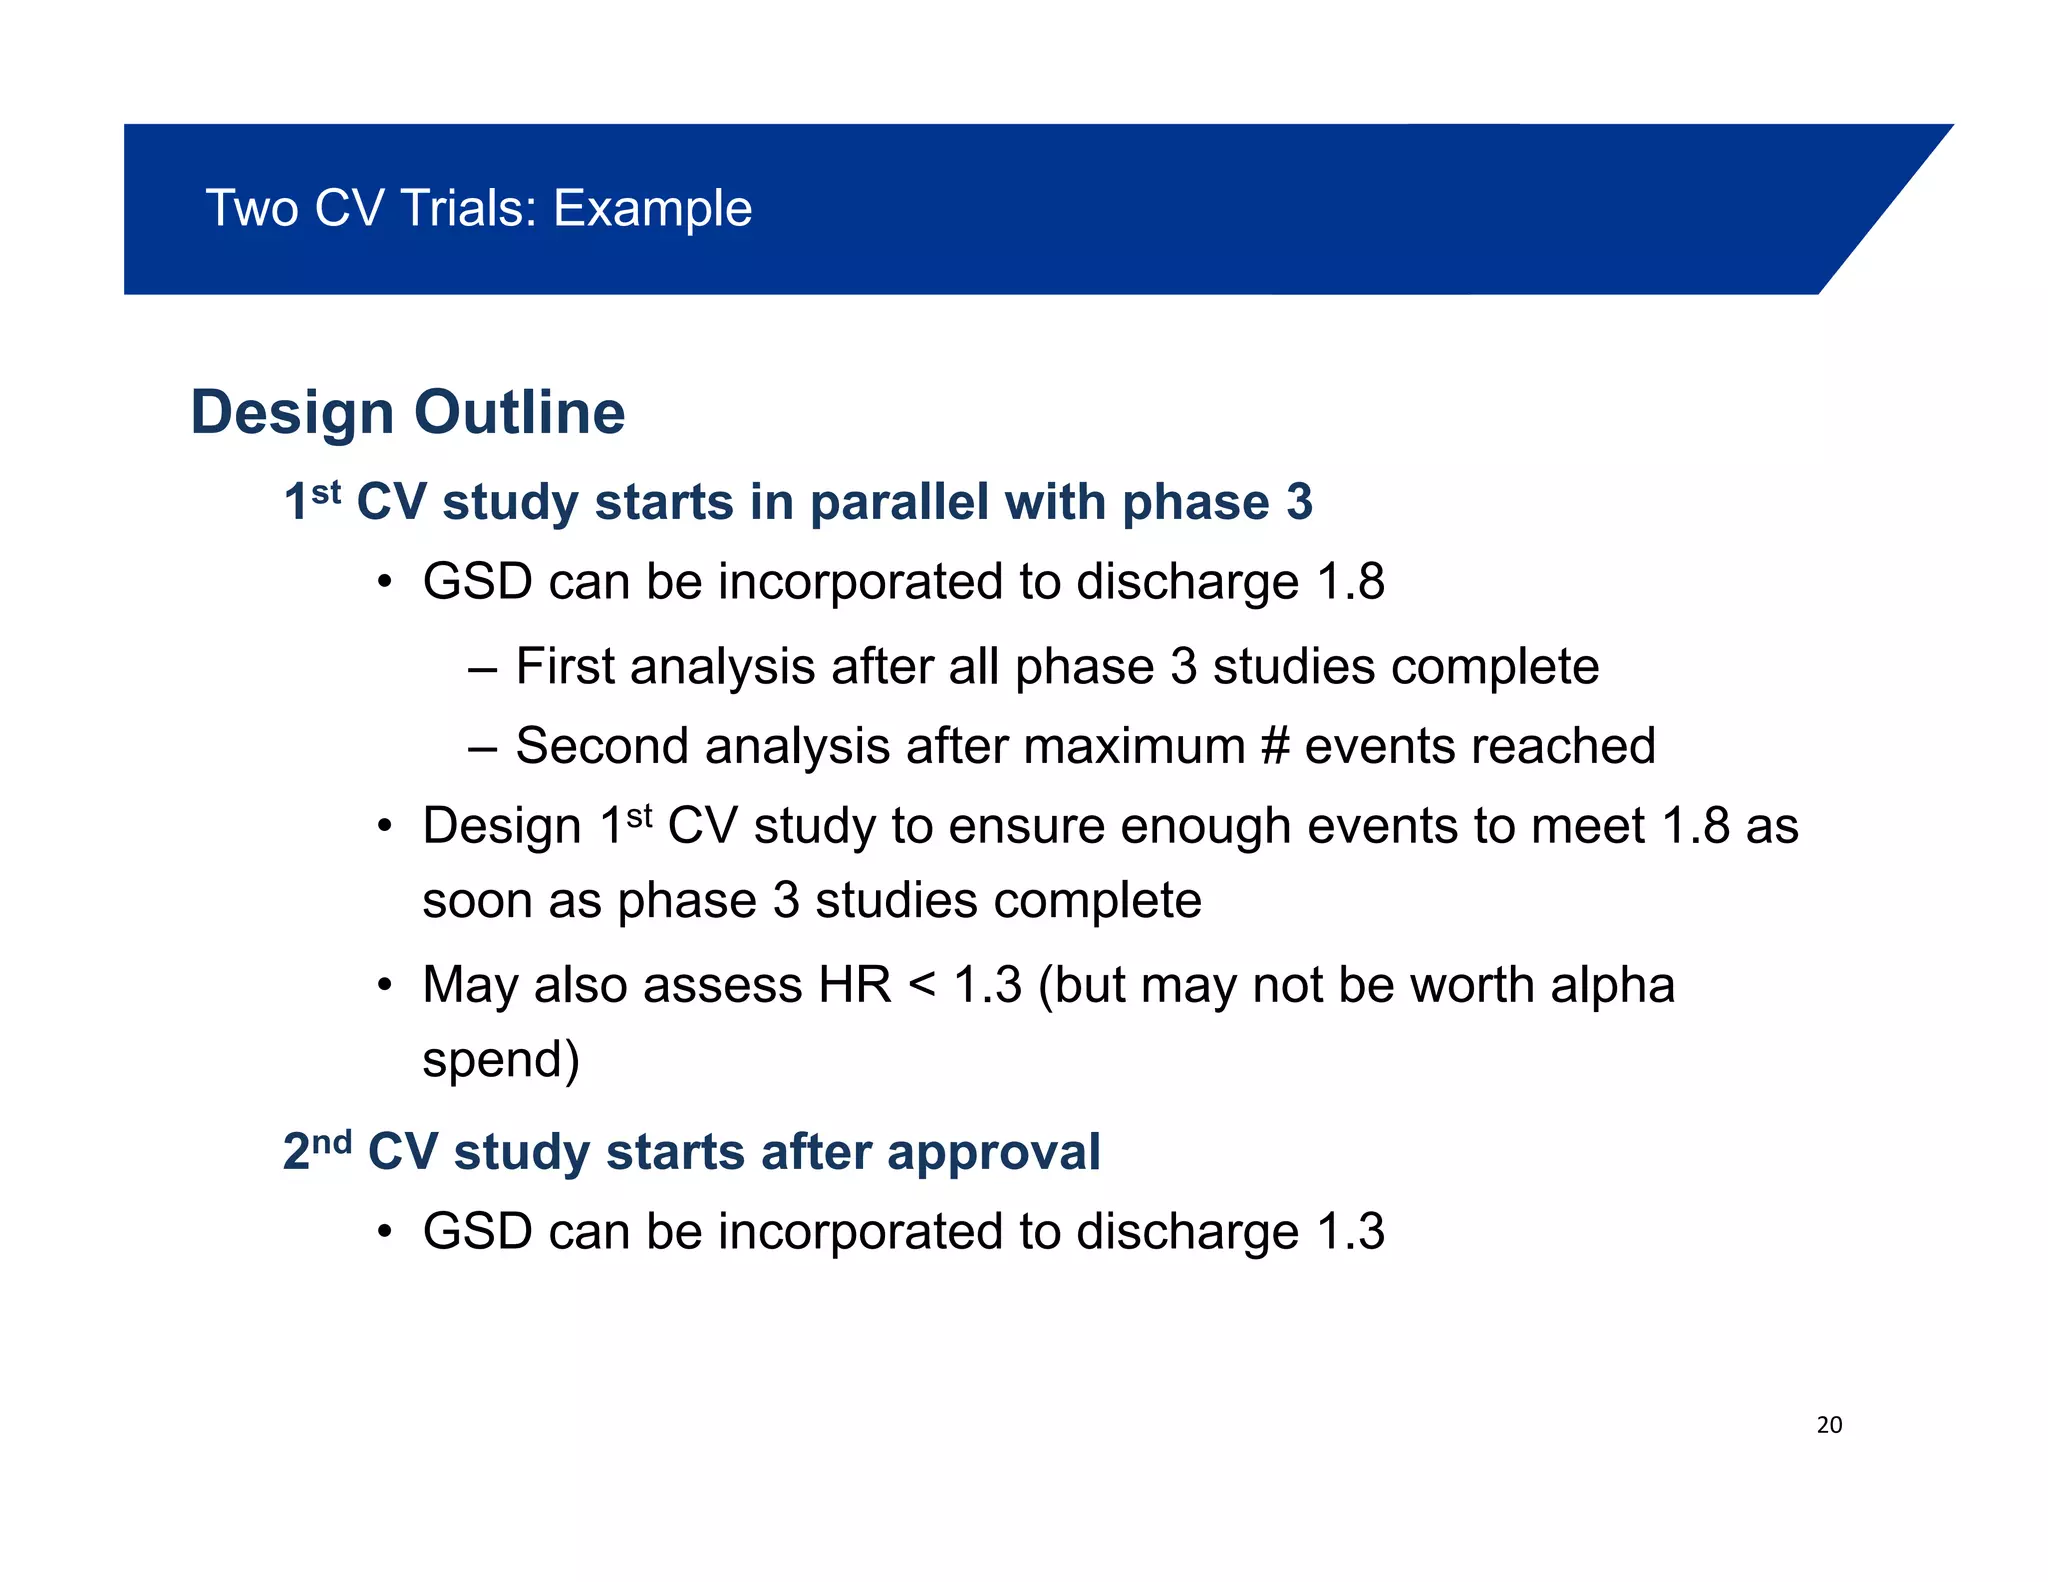
– Acceptable for 1.8 (phase 2,3 & possibly CV trial)p (p , p y )
– Acceptable for 1.3 (CV trials & possibly phase 2,3 trials)
– ? Acceptable for 1 (CV trials)
• Does superiority need to be demonstrate in a single CV Outcomes trial?• Does superiority need to be demonstrate in a single CV Outcomes trial?
• Typically seeing gated hypothesis testing within meta-analysis: 1st test HR <
1.3, then test HR < 1
• If an interim analysis is utilized for assessing 1.8:
– Need acceptable process to maintain blind of ongoing studies
– Completely blind the sponsor (CRO or some other body)
– Blind the study team, but not the sponsor (e.g. team internal to sponsor, but
firewalled from study team; internal steering committee with CRO)
• What will be published in SBA? [Transparency / Data Confidentiality]
10
11. Statistical Methods
Group Sequential Designs: Opportunity to stop early for success
(1.8, 1.3 or 1)(1.8, 1.3 or 1)
– Opportunity to answer the question sooner & reduce patient exposure
– Can be combined with meta-analysis to further reduce patient exposure
• Determine in advance the maximum number of events and alphaDetermine in advance the maximum number of events, and alpha
spend
– Allows for multiple interims to avoid looking too early or too late
– Need to establish minimum clinically meaningful exposure (notNeed to establish minimum clinically meaningful exposure (not
just about statistical significance on MACE)
Current recommendations:
Encouraging of group sequential designs
Determine a-priori alpha spend and number of events at each analysis
Alpha spend is sponsor’s choice (preference for O’Brien-Fleming)p p p (p g)
Report adjusted point estimator
11
12. Group Sequential Design (GSD) Approaches
Assume single CV study to demonstrate HR <1.3, non-inferiority
– O’Brien-Fleming spending function, 3 look design for early stopping, 90% power
– Fixed design requires 611 events if true HR = 1
True HR Average # Events
(400, 513, 626)
Average # Events
(500, 565, 629)
1.00 480 527
0.90 418 503
0.85 406 501
0.80 401 500
0.75 400 500
Design Pr Stop at Interim 1 Pr Stop By Interim 2 Pr Success By
Final Analysis
400, 513, 626 0.52 0.767 0.90
If the true HR is 1
12
500, 565, 629 0.75 0.838 0.90
13. Statistical Methods
Sample-size re-estimation (Duration): Right-size the study
– Sample-size drives study duration, NOT powerp y , p
– Opportunity to increase sample size if needed to maintain reasonable
study duration once more information is gathered on event rate
Analysis can be done using blinded data (observed event rate)– Analysis can be done using blinded data (observed event rate)
Re-estimating # Events (Power): Minimize patient years
– # events drive power– # events drive power
– Delay upfront investment to power for superiority given initial uncertainty
in true HR
Si i iti ll f i f i it ith th ti t i # t if– Size initially for non-inferiority with the option to increase # events if
superiority is likely (e.g. utilize estimate of HR at ~400 events)
– Analysis likely will require unblinded data
13
14. Click to edit Master title style
DEVELOPMENT OPTIONS
14
15. Single CV Trial: Approaches
A. Fixed Design: Assessing 1.3 only (or 1)
• 1.8 assessed only from phase 2 & 3 via meta-analysisy p y
Pro: No interim analysis needed
Con: Cannot be used to discharge 1.8 if insufficient events observed (even
if initiated prior to end of phase 3)
To utilize the CV trial as back-up to discharge 1.8
Group Sequential Design approach would be needed (alpha• Group Sequential Design approach would be needed (alpha
spending 1.8)
• Needs to be pre-specified in meta-analysis plan PRIOR to
unblinding Phase 3unblinding Phase 3
• CV Trial needs to incorporate an interim analysis based on timing
relative to the total #events needed for the meta-analysis
15
16. Single CV Trial: Approaches
B. GSD: Assessing both 1.8 and 1.3 (or 1)
• Must start prior to completion of Phase 3
• Incorporating separate alpha spending for 1.8 & 1.3
• May incorporate GSD for 1.8 and/or 1.3 for early stopping
• May also incorporate meta-analysis for 1.8
• Can incorporate blinded SSR on observed event rate to manage duration
Pre Submission
Period
Post Submission Period
Can incorporate blinded SSR on observed event rate to manage duration
Period
Group Sequential Design
Increase likelihood of meeting 1.8 as soon as Phase 3 trials complete
Group Sequential Designg p
Increase likelihood of meeting 1.8 without requiring additional study
Group Sequential Design
Possibility to stop earlier if objectives meet
Blinded SSR
to manage duration
Meta-Analysis
Event from Phase 2 & 3
16
17. Single CV Trial: Approaches
Group Sequential Design (at 400
events) Enable Early Stopping for
Superiority Only ( < 0.001)
C. Plan for non-inferiority with option to enlarge
study to demonstrate superiority (example)
Event Re-estimation (at 400 events)
Assess the Likelihood of Superiority,
Increase the #Events if superiority likely
Sample Size Re-estimation
Manage Post Submission Trial Duration
8000 (max of 9622)
Pre Submission
Period
Post Submission Period
Final Analysis
(750 or 1067
events)
Impact vs Superiority Design (N=9622, #Events 1067)
Approximately same power for superiorityGroup Sequential Design with Meta- pp y p p y
Earlier Submission: 3 months
Reduced Cost: (20%) 40M-50M
Reduced Trial Duration:
1 year if superiority is true
p q g
Analysis to discharge 1.8
100 & 130 events, Pocock spending
function, min 90% power (versus 122
single analysis)
6 months if non-inferiority is true
17
18. Operating Characteristics
Across Range of HRsFixed
Approximately the
same power for
superiority
Adaptive
p y
Adaptive design
reduces the number of
patient years
KEY
Lines: Power (scale on left)
Bars: Patient Yrs (scale on right)
18
19. Two CV Trials
Objective:
Non inferiority– Non-inferiority
– Meta-analysis approach to discharge 1.8 & 1.3
• 1.8: 1st CV study and Phase 2 & 3y
• 1.3: 2 CV studies only
Benefits:
– Flexibility to adjust to learning
– Stop or continue 1st CV study depending on results of Phase 3
Utilize design of 2nd CV study to add or remove doses if needed– Utilize design of 2nd CV study to add or remove doses if needed
19
20. Two CV Trials: Example
Design Outline
1st CV st d starts in parallel ith phase 31st CV study starts in parallel with phase 3
• GSD can be incorporated to discharge 1.8
– First analysis after all phase 3 studies completey p p
– Second analysis after maximum # events reached
• Design 1st CV study to ensure enough events to meet 1.8 as
soon as phase 3 st dies completesoon as phase 3 studies complete
• May also assess HR < 1.3 (but may not be worth alpha
spend)
2nd CV study starts after approval
• GSD can be incorporated to discharge 1.3
20
21. 2 CV Trials – The High Cost of Stopping 1st CV Study at Submission
Option 1 increases total cost by
6000 pts
$130 Million
Assumes: 2500 pts/yr recruited, 2% event rate
(cost: $30M fixed cost, $25k / patient, $2k / patient-year)
CV Study #1 – N=3500, Events=155, 3
Option #1: Stop at Submission
$
relative to option 2
CV Study #1 N 3500, Events 155, 3
years duration
CV Study #2 – N=8900, Events=545
CV Study #1 – N=3500, Events=460, 8 years duration
Option #2: Run CV #1 for 8 Years
5 Years Post Approval
CV Study #2 – N=2900, Events=240
Submission Approval
(trigger CV #2)
5 Years Post-Approval
(Complete CV #2)
700 Total Events CV #1 + CV #2
21
22. Variation: Sub-studies
Sub-studies within CV design
– Initiated at time of Phase 3Initiated at time of Phase 3
– Goal: an indication within a patient subset
– Need to fully analyze sub-study at time of submission
– Ideally: Follow all patients to assess CV risk
– Alternative: discontinue patients in sub-study
Need acceptable process to maintain blind of ongoing
studies
22
23. Single Large Development Study
(Core Phase 3 study)
End of Study
Analysis for
Submission
Dose A + SOC
Treatment Period FU
Run In Dose B + SOC
Population:
N=xxxx
80% high risk T2DM
20% std risk T2DM
Placebo + SOC
• No change in SOC for initial 6 months post randomization; modifications allowed thereafter
• Interim analysis conducted for HbA1c assessment after all patients followed for 6 months
All ti t ti i t i l th ft f MACE t ( d f t d )
Allowed Treatment Combinations
• add on to metformin
• add on to SU• All patients continue in trial thereafter for MACE assessment (end of study = x years) • add on to SU
• add on to Met + SU (EU)
• add on to TZDs
• add on to insulin
• add on to DPPIV
23
Adapted from A. Svensson Roche DIA EU CV Safety Conference 2011
• add on to GLP1
24. Concluding Remarks
Integrate CV evaluation with the clinical plan
– Plan should include both 1.8 and 1.3
Efficiencies gained by considering EARLY the totality of information needed– Efficiencies gained by considering EARLY the totality of information needed
Consider GSD
– Choice of spending function Sponsor’s decision
– Preference for O’Brien-FlemingPreference for O Brien Fleming
– Adjusted point estimator of HR should be reported
Need to establish operational approaches for interim analyses
– Important to maintain trial integrity AND cost/benefit of datag y
– Industry needs to put forwarded models
Other key considerations not discussed
– Only high-level concepts presented
– E.g. endpoint (MACE, MACE +), patient population, heterogeneity
Other (more novel) approaches not discussed
– Shared control designs
Leveraging historical information– Leveraging historical information
24