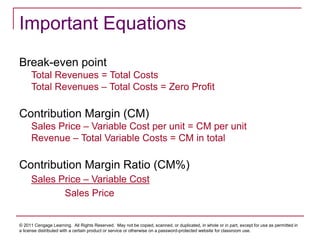
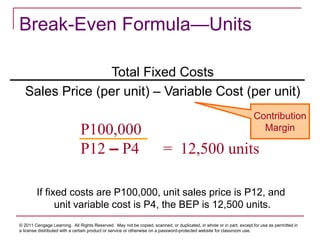
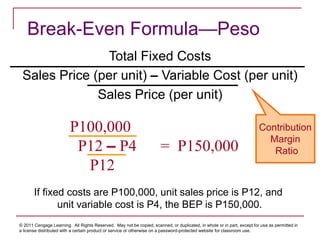
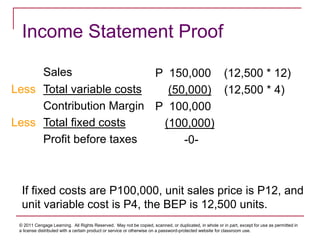
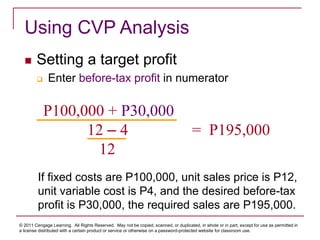
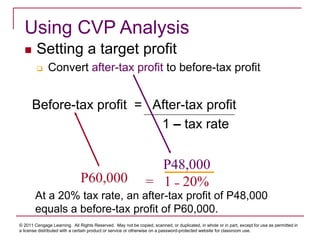
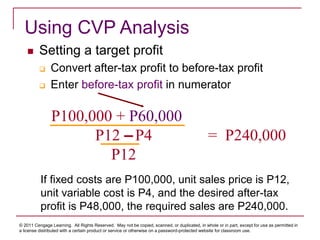
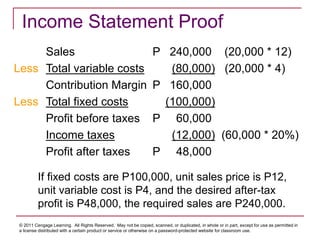
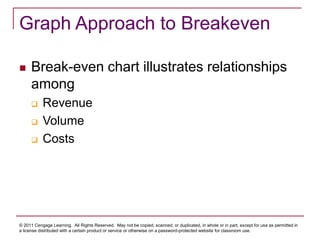
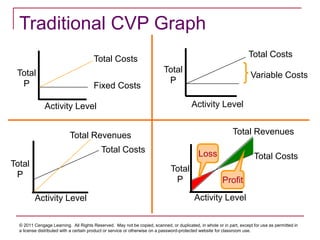
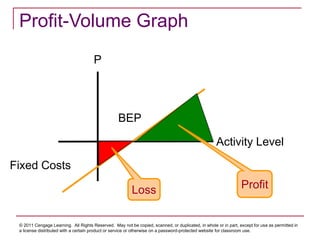
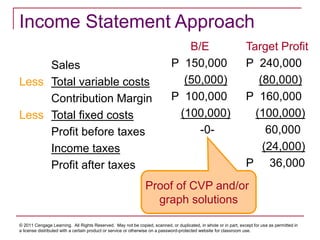
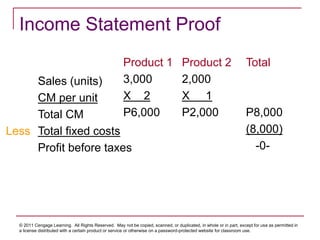
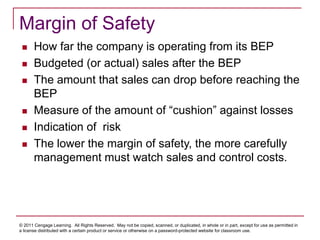
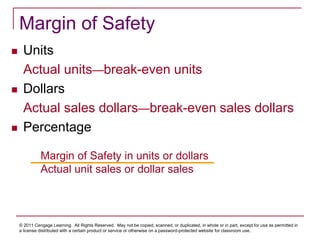
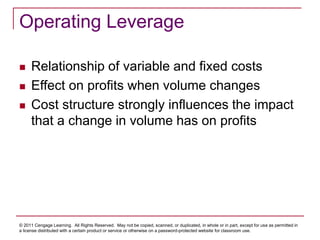
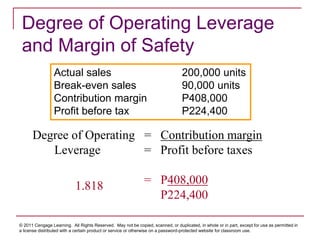
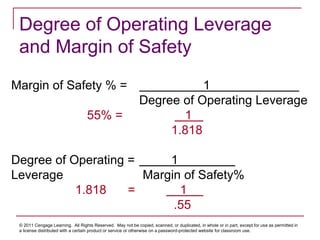
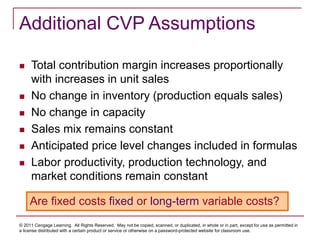
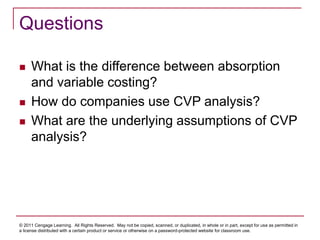
Kinney ● Raiborn
Cost Accounting:
Foundations and Evolutions, 8e
© 2011 Cengage Learning. All Rights Reserved. May not be copied, scanned, or duplicated, in whole or in part, except for use as permitted in a
license distributed with a certain product or service or otherwise on a password-protected website for classroom use.
Chapter 9:
Break-Even Point and Cost-
Volume-Profit Analysis
© 2011 Cengage Learning. All Rights Reserved. May not be copied, scanned, or duplicated, in whole or in part, except for use as permitted in
a license distributed with a certain product or service or otherwise on a password-protected website for classroom use.
Learning Objectives
 What is the break-even point (BEP) and why is it
important?
 How is the BEP determined and what methods are
used to determine BEP?
 What is cost-volume-profit (CVP) analysis and how do
companies use CVP information in decision making?
 How do BEP and CVP analyses differ for single-
product and multiproduct firms?
 How are margin of safety and operating leverage
concepts used in business?
 What are the underlying assumptions of CVP
analysis?
© 2011 Cengage Learning. All Rights Reserved. May not be copied, scanned, or duplicated, in whole or in part, except for use as permitted in
a license distributed with a certain product or service or otherwise on a password-protected website for classroom use.
Cost-Volume-Profit Analysis
 Relationship of
 Revenue
 Costs
 Volume changes
 Taxes
 Profits
 Applies to
 Manufacturers
 Wholesalers
 Retailers
 Service industries
© 2011 Cengage Learning. All Rights Reserved. May not be copied, scanned, or duplicated, in whole or in part, except for use as permitted in
a license distributed with a certain product or service or otherwise on a password-protected website for classroom use.
Variable Costing and CVP
 Variable costing
 Separates costs into fixed and variable
components
 Shows fixed costs in lump-sum amounts, not on a
per-unit basis
 Does not allow for deferral/release of fixed costs
from/to inventory when production and sales
volumes differ
© 2011 Cengage Learning. All Rights Reserved. May not be copied, scanned, or duplicated, in whole or in part, except for use as permitted in
a license distributed with a certain product or service or otherwise on a password-protected website for classroom use.
Use CVP Analysis to…
 Compute the BEP
 Study interrelationships
of
 Prices
 Volumes
 Fixed and variable costs
 Contribution margins
 Profits
 Calculate the level of
sales necessary to
achieve a target profit
 Set sales price
 Answer “what-if”
questions to influence
current operations and
predict future
operations
© 2011 Cengage Learning. All Rights Reserved. May not be copied, scanned, or duplicated, in whole or in part, except for use as permitted in
a license distributed with a certain product or service or otherwise on a password-protected website for classroom use.
CVP Assumptions
 Company is operating within the relevant
range
 Revenue per unit remains constant
 Variable costs per unit remain constant
 Total fixed costs remain constant
 Mixed costs are separated into variable and
fixed elements
© 2011 Cengage Learning. All Rights Reserved. May not be copied, scanned, or duplicated, in whole or in part, except for use as permitted in
a license distributed with a certain product or service or otherwise on a password-protected website for classroom use.
Important Equations
Break-even point
Total Revenues = Total Costs
Total Revenues – Total Costs = Zero Profit
Contribution Margin (CM)
Sales Price – Variable Cost per unit = CM per unit
Revenue – Total Variable Costs = CM in total
Contribution Margin Ratio (CM%)
Sales Price – Variable Cost
Sales Price
© 2011 Cengage Learning. All Rights Reserved. May not be copied, scanned, or duplicated, in whole or in part, except for use as permitted in
a license distributed with a certain product or service or otherwise on a password-protected website for classroom use.
Break-Even Formula—Units
Total Fixed Costs
Sales Price (per unit) – Variable Cost (per unit)
P100,000
P12 – P4 = 12,500 units
If fixed costs are P100,000, unit sales price is P12, and
unit variable cost is P4, the BEP is 12,500 units.
Contribution
Margin
© 2011 Cengage Learning. All Rights Reserved. May not be copied, scanned, or duplicated, in whole or in part, except for use as permitted in
a license distributed with a certain product or service or otherwise on a password-protected website for classroom use.
Break-Even Formula—Peso
Total Fixed Costs
Sales Price (per unit) – Variable Cost (per unit)
Sales Price (per unit)
If fixed costs are P100,000, unit sales price is P12, and
unit variable cost is P4, the BEP is P150,000.
P100,000
P12 – P4 = P150,000
P12
Contribution
Margin
Ratio
© 2011 Cengage Learning. All Rights Reserved. May not be copied, scanned, or duplicated, in whole or in part, except for use as permitted in
a license distributed with a certain product or service or otherwise on a password-protected website for classroom use.
Income Statement Proof
Sales
Less Total variable costs
Contribution Margin
Less Total fixed costs
Profit before taxes
P 150,000 (12,500 * 12)
(50,000) (12,500 * 4)
P 100,000
(100,000)
-0-
If fixed costs are P100,000, unit sales price is P12, and
unit variable cost is P4, the BEP is 12,500 units.
© 2011 Cengage Learning. All Rights Reserved. May not be copied, scanned, or duplicated, in whole or in part, except for use as permitted in
a license distributed with a certain product or service or otherwise on a password-protected website for classroom use.
Using CVP Analysis
 Setting a target profit
 Enter before-tax profit in numerator
P100,000 + P30,000
12 – 4 = P195,000
12
If fixed costs are P100,000, unit sales price is P12,
unit variable cost is P4, and the desired before-tax
profit is P30,000, the required sales are P195,000.
© 2011 Cengage Learning. All Rights Reserved. May not be copied, scanned, or duplicated, in whole or in part, except for use as permitted in
a license distributed with a certain product or service or otherwise on a password-protected website for classroom use.
 Setting a target profit
 Convert after-tax profit to before-tax profit
Before-tax profit = After-tax profit
1 – tax rate
P48,000
= 1 – 20%
P60,000
At a 20% tax rate, an after-tax profit of P48,000
equals a before-tax profit of P60,000.
Using CVP Analysis
© 2011 Cengage Learning. All Rights Reserved. May not be copied, scanned, or duplicated, in whole or in part, except for use as permitted in
a license distributed with a certain product or service or otherwise on a password-protected website for classroom use.
 Setting a target profit
 Convert after-tax profit to before-tax profit
 Enter before-tax profit in numerator
If fixed costs are P100,000, unit sales price is P12,
unit variable cost is P4, and the desired after-tax
profit is P48,000, the required sales are P240,000.
P100,000 + P60,000
P12 –P4 = P240,000
P12
Using CVP Analysis
© 2011 Cengage Learning. All Rights Reserved. May not be copied, scanned, or duplicated, in whole or in part, except for use as permitted in
a license distributed with a certain product or service or otherwise on a password-protected website for classroom use.
Income Statement Proof
Sales
Less Total variable costs
Contribution Margin
Less Total fixed costs
Profit before taxes
Income taxes
Profit after taxes
P 240,000 (20,000 * 12)
(80,000) (20,000 * 4)
P 160,000
(100,000)
P 60,000
(12,000) (60,000 * 20%)
P 48,000
If fixed costs are P100,000, unit sales price is P12,
unit variable cost is P4, and the desired after-tax
profit is P48,000, the required sales are P240,000.
© 2011 Cengage Learning. All Rights Reserved. May not be copied, scanned, or duplicated, in whole or in part, except for use as permitted in
a license distributed with a certain product or service or otherwise on a password-protected website for classroom use.
Using CVP Analysis
Set profit per unit
X = FC/(CMu - PuBT)
Sales
Volume Total
Fixed
Cost
Contribution
Margin
Profit
per Unit
Before Tax
© 2011 Cengage Learning. All Rights Reserved. May not be copied, scanned, or duplicated, in whole or in part, except for use as permitted in
a license distributed with a certain product or service or otherwise on a password-protected website for classroom use.
Graph Approach to Breakeven
 Break-even chart illustrates relationships
among
 Revenue
 Volume
 Costs
© 2011 Cengage Learning. All Rights Reserved. May not be copied, scanned, or duplicated, in whole or in part, except for use as permitted in
a license distributed with a certain product or service or otherwise on a password-protected website for classroom use.
Traditional CVP Graph
Total
P
Activity Level
Fixed Costs
Total Costs
Total
P
Activity Level
Total Costs
Variable Costs
Total
P
Activity Level
Total Costs
Total Revenues
Loss
Total
P
Activity Level
Total Costs
Total Revenues
Profit
© 2011 Cengage Learning. All Rights Reserved. May not be copied, scanned, or duplicated, in whole or in part, except for use as permitted in
a license distributed with a certain product or service or otherwise on a password-protected website for classroom use.
Profit-Volume Graph
P
Activity Level
Fixed Costs
BEP
Profit
Loss
© 2011 Cengage Learning. All Rights Reserved. May not be copied, scanned, or duplicated, in whole or in part, except for use as permitted in
a license distributed with a certain product or service or otherwise on a password-protected website for classroom use.
Income Statement Approach
Sales
Less Total variable costs
Contribution Margin
Less Total fixed costs
Profit before taxes
Income taxes
Profit after taxes
B/E
P 150,000
(50,000)
P 100,000
(100,000)
-0-
Target Profit
P 240,000
(80,000)
P 160,000
(100,000)
60,000
(24,000)
P 36,000
Proof of CVP and/or
graph solutions
© 2011 Cengage Learning. All Rights Reserved. May not be copied, scanned, or duplicated, in whole or in part, except for use as permitted in
a license distributed with a certain product or service or otherwise on a password-protected website for classroom use.
Incremental Analysis
 Focuses only on factors that change from
one option to another
 Changes in revenues, costs, and/or volume
 BEP increases when
 Fixed costs increase
 Sales price decreases
 Variable costs increase
© 2011 Cengage Learning. All Rights Reserved. May not be copied, scanned, or duplicated, in whole or in part, except for use as permitted in
a license distributed with a certain product or service or otherwise on a password-protected website for classroom use.
Multiproduct CVP Analysis
 Assumes a constant product sales mix
 Contribution margin is weighted on the
quantities of each product included in the
“bag” of products
 Contribution margin of the product making up
the largest proportion of the bag has the
greatest impact on the average contribution
margin of the product mix
© 2011 Cengage Learning. All Rights Reserved. May not be copied, scanned, or duplicated, in whole or in part, except for use as permitted in
a license distributed with a certain product or service or otherwise on a password-protected website for classroom use.
Sales mix
Contribution
margin per unit
3 2
P2 P1
FC = P8,000
“Bag”—three units of first product for every two units second product.
Multiproduct CVP Analysis
P8000
3(P2) + 2(P1) = 1,000 “bags”
Breakeven
© 2011 Cengage Learning. All Rights Reserved. May not be copied, scanned, or duplicated, in whole or in part, except for use as permitted in
a license distributed with a certain product or service or otherwise on a password-protected website for classroom use.
3 2
Sales mix
x 1,000
3,000
x 1,000
2,000
Breakeven “bag”
Breakeven units
To break even, sell 3,000 of first product
and 2,000 of second product.
Multiproduct CVP Analysis
© 2011 Cengage Learning. All Rights Reserved. May not be copied, scanned, or duplicated, in whole or in part, except for use as permitted in
a license distributed with a certain product or service or otherwise on a password-protected website for classroom use.
Income Statement Proof
Sales (units)
CM per unit
Total CM
Less Total fixed costs
Profit before taxes
Product 1
3,000
X 2
P6,000
Product 2
2,000
X 1
P2,000
Total
P8,000
(8,000)
-0-
© 2011 Cengage Learning. All Rights Reserved. May not be copied, scanned, or duplicated, in whole or in part, except for use as permitted in
a license distributed with a certain product or service or otherwise on a password-protected website for classroom use.
Margin of Safety
 How far the company is operating from its BEP
 Budgeted (or actual) sales after the BEP
 The amount that sales can drop before reaching the
BEP
 Measure of the amount of “cushion” against losses
 Indication of risk
 The lower the margin of safety, the more carefully
management must watch sales and control costs.
© 2011 Cengage Learning. All Rights Reserved. May not be copied, scanned, or duplicated, in whole or in part, except for use as permitted in
a license distributed with a certain product or service or otherwise on a password-protected website for classroom use.
Margin of Safety
 Units
Actual units—break-even units
 Dollars
Actual sales dollars—break-even sales dollars
 Percentage
Margin of Safety in units or dollars
Actual unit sales or dollar sales
© 2011 Cengage Learning. All Rights Reserved. May not be copied, scanned, or duplicated, in whole or in part, except for use as permitted in
a license distributed with a certain product or service or otherwise on a password-protected website for classroom use.
Operating Leverage
 Relationship of variable and fixed costs
 Effect on profits when volume changes
 Cost structure strongly influences the impact
that a change in volume has on profits
© 2011 Cengage Learning. All Rights Reserved. May not be copied, scanned, or duplicated, in whole or in part, except for use as permitted in
a license distributed with a certain product or service or otherwise on a password-protected website for classroom use.
Operating Leverage
High Operating Leverage
 Low variable costs
 High fixed costs
 High contribution margin
 High BEP
 Sales after break-even
have greater impact on
profits
Low Operating Leverage
 High variable costs
 Low fixed costs
 Low contribution margin
 Low BEP
 Sales after break-even
have lesser impact on
profits
© 2011 Cengage Learning. All Rights Reserved. May not be copied, scanned, or duplicated, in whole or in part, except for use as permitted in
a license distributed with a certain product or service or otherwise on a password-protected website for classroom use.
Degree of Operating Leverage
 Measures how a percentage change in sales
will affect profits
 Degree of Operating Leverage
Contribution Margin
Profit Before Taxes
© 2011 Cengage Learning. All Rights Reserved. May not be copied, scanned, or duplicated, in whole or in part, except for use as permitted in
a license distributed with a certain product or service or otherwise on a password-protected website for classroom use.
Degree of Operating Leverage
and Margin of Safety
 When margin of safety is small, the degree
of operating leverage is large
Margin of Safety % = 1/Degree of Operating Leverage
Degree of Operating Leverage = 1/Margin of Safety %
© 2011 Cengage Learning. All Rights Reserved. May not be copied, scanned, or duplicated, in whole or in part, except for use as permitted in
a license distributed with a certain product or service or otherwise on a password-protected website for classroom use.
Degree of Operating Leverage
and Margin of Safety
Actual sales 200,000 units
Break-even sales 90,000 units
Contribution margin P408,000
Profit before tax P224,400
Margin of Safety % = Actual sales – Break-even sales
Actual sales
= 200,000 – 90,000
200,000
55%
© 2011 Cengage Learning. All Rights Reserved. May not be copied, scanned, or duplicated, in whole or in part, except for use as permitted in
a license distributed with a certain product or service or otherwise on a password-protected website for classroom use.
Degree of Operating Leverage
and Margin of Safety
Degree of Operating = Contribution margin
Leverage = Profit before taxes
= P408,000
P224,400
1.818
Actual sales 200,000 units
Break-even sales 90,000 units
Contribution margin P408,000
Profit before tax P224,400
© 2011 Cengage Learning. All Rights Reserved. May not be copied, scanned, or duplicated, in whole or in part, except for use as permitted in
a license distributed with a certain product or service or otherwise on a password-protected website for classroom use.
Margin of Safety % = 1
Degree of Operating Leverage
55% = 1
1.818
Degree of Operating = 1
Leverage Margin of Safety%
1.818 = 1
.55
Degree of Operating Leverage
and Margin of Safety
© 2011 Cengage Learning. All Rights Reserved. May not be copied, scanned, or duplicated, in whole or in part, except for use as permitted in
a license distributed with a certain product or service or otherwise on a password-protected website for classroom use.
Additional CVP Assumptions
 Total contribution margin increases proportionally
with increases in unit sales
 No change in inventory (production equals sales)
 No change in capacity
 Sales mix remains constant
 Anticipated price level changes included in formulas
 Labor productivity, production technology, and
market conditions remain constant
Are fixed costs fixed or long-term variable costs?
© 2011 Cengage Learning. All Rights Reserved. May not be copied, scanned, or duplicated, in whole or in part, except for use as permitted in
a license distributed with a certain product or service or otherwise on a password-protected website for classroom use.
Questions
 What is the difference between absorption
and variable costing?
 How do companies use CVP analysis?
 What are the underlying assumptions of CVP
analysis?
© 2011 Cengage Learning. All Rights Reserved. May not be copied, scanned, or duplicated, in whole or in part, except for use as permitted in
a license distributed with a certain product or service or otherwise on a password-protected website for classroom use.
Potential Ethical Issues
 Ignoring relevant range in setting assumptions about
cost behavior
 Using absorption (fixed manufacturing) costs as part
of variable costs for CVP analysis
 Using improper assumptions about cost and volume
relationships to manipulate results
 Assuming constant sales mix while ignoring demand
for individual products
 Using CVP analysis to improperly support long-term
cost management strategies
 Visually distorting break-even graphs
 Using irrelevant information in incremental analysis

CVP.ppt

  • 1.
    Kinney ● Raiborn CostAccounting: Foundations and Evolutions, 8e © 2011 Cengage Learning. All Rights Reserved. May not be copied, scanned, or duplicated, in whole or in part, except for use as permitted in a license distributed with a certain product or service or otherwise on a password-protected website for classroom use. Chapter 9: Break-Even Point and Cost- Volume-Profit Analysis
  • 2.
    © 2011 CengageLearning. All Rights Reserved. May not be copied, scanned, or duplicated, in whole or in part, except for use as permitted in a license distributed with a certain product or service or otherwise on a password-protected website for classroom use. Learning Objectives  What is the break-even point (BEP) and why is it important?  How is the BEP determined and what methods are used to determine BEP?  What is cost-volume-profit (CVP) analysis and how do companies use CVP information in decision making?  How do BEP and CVP analyses differ for single- product and multiproduct firms?  How are margin of safety and operating leverage concepts used in business?  What are the underlying assumptions of CVP analysis?
  • 3.
    © 2011 CengageLearning. All Rights Reserved. May not be copied, scanned, or duplicated, in whole or in part, except for use as permitted in a license distributed with a certain product or service or otherwise on a password-protected website for classroom use. Cost-Volume-Profit Analysis  Relationship of  Revenue  Costs  Volume changes  Taxes  Profits  Applies to  Manufacturers  Wholesalers  Retailers  Service industries
  • 4.
    © 2011 CengageLearning. All Rights Reserved. May not be copied, scanned, or duplicated, in whole or in part, except for use as permitted in a license distributed with a certain product or service or otherwise on a password-protected website for classroom use. Variable Costing and CVP  Variable costing  Separates costs into fixed and variable components  Shows fixed costs in lump-sum amounts, not on a per-unit basis  Does not allow for deferral/release of fixed costs from/to inventory when production and sales volumes differ
  • 5.
    © 2011 CengageLearning. All Rights Reserved. May not be copied, scanned, or duplicated, in whole or in part, except for use as permitted in a license distributed with a certain product or service or otherwise on a password-protected website for classroom use. Use CVP Analysis to…  Compute the BEP  Study interrelationships of  Prices  Volumes  Fixed and variable costs  Contribution margins  Profits  Calculate the level of sales necessary to achieve a target profit  Set sales price  Answer “what-if” questions to influence current operations and predict future operations
  • 6.
    © 2011 CengageLearning. All Rights Reserved. May not be copied, scanned, or duplicated, in whole or in part, except for use as permitted in a license distributed with a certain product or service or otherwise on a password-protected website for classroom use. CVP Assumptions  Company is operating within the relevant range  Revenue per unit remains constant  Variable costs per unit remain constant  Total fixed costs remain constant  Mixed costs are separated into variable and fixed elements
  • 7.
    © 2011 CengageLearning. All Rights Reserved. May not be copied, scanned, or duplicated, in whole or in part, except for use as permitted in a license distributed with a certain product or service or otherwise on a password-protected website for classroom use. Important Equations Break-even point Total Revenues = Total Costs Total Revenues – Total Costs = Zero Profit Contribution Margin (CM) Sales Price – Variable Cost per unit = CM per unit Revenue – Total Variable Costs = CM in total Contribution Margin Ratio (CM%) Sales Price – Variable Cost Sales Price
  • 8.
    © 2011 CengageLearning. All Rights Reserved. May not be copied, scanned, or duplicated, in whole or in part, except for use as permitted in a license distributed with a certain product or service or otherwise on a password-protected website for classroom use. Break-Even Formula—Units Total Fixed Costs Sales Price (per unit) – Variable Cost (per unit) P100,000 P12 – P4 = 12,500 units If fixed costs are P100,000, unit sales price is P12, and unit variable cost is P4, the BEP is 12,500 units. Contribution Margin
  • 9.
    © 2011 CengageLearning. All Rights Reserved. May not be copied, scanned, or duplicated, in whole or in part, except for use as permitted in a license distributed with a certain product or service or otherwise on a password-protected website for classroom use. Break-Even Formula—Peso Total Fixed Costs Sales Price (per unit) – Variable Cost (per unit) Sales Price (per unit) If fixed costs are P100,000, unit sales price is P12, and unit variable cost is P4, the BEP is P150,000. P100,000 P12 – P4 = P150,000 P12 Contribution Margin Ratio
  • 10.
    © 2011 CengageLearning. All Rights Reserved. May not be copied, scanned, or duplicated, in whole or in part, except for use as permitted in a license distributed with a certain product or service or otherwise on a password-protected website for classroom use. Income Statement Proof Sales Less Total variable costs Contribution Margin Less Total fixed costs Profit before taxes P 150,000 (12,500 * 12) (50,000) (12,500 * 4) P 100,000 (100,000) -0- If fixed costs are P100,000, unit sales price is P12, and unit variable cost is P4, the BEP is 12,500 units.
  • 11.
    © 2011 CengageLearning. All Rights Reserved. May not be copied, scanned, or duplicated, in whole or in part, except for use as permitted in a license distributed with a certain product or service or otherwise on a password-protected website for classroom use. Using CVP Analysis  Setting a target profit  Enter before-tax profit in numerator P100,000 + P30,000 12 – 4 = P195,000 12 If fixed costs are P100,000, unit sales price is P12, unit variable cost is P4, and the desired before-tax profit is P30,000, the required sales are P195,000.
  • 12.
    © 2011 CengageLearning. All Rights Reserved. May not be copied, scanned, or duplicated, in whole or in part, except for use as permitted in a license distributed with a certain product or service or otherwise on a password-protected website for classroom use.  Setting a target profit  Convert after-tax profit to before-tax profit Before-tax profit = After-tax profit 1 – tax rate P48,000 = 1 – 20% P60,000 At a 20% tax rate, an after-tax profit of P48,000 equals a before-tax profit of P60,000. Using CVP Analysis
  • 13.
    © 2011 CengageLearning. All Rights Reserved. May not be copied, scanned, or duplicated, in whole or in part, except for use as permitted in a license distributed with a certain product or service or otherwise on a password-protected website for classroom use.  Setting a target profit  Convert after-tax profit to before-tax profit  Enter before-tax profit in numerator If fixed costs are P100,000, unit sales price is P12, unit variable cost is P4, and the desired after-tax profit is P48,000, the required sales are P240,000. P100,000 + P60,000 P12 –P4 = P240,000 P12 Using CVP Analysis
  • 14.
    © 2011 CengageLearning. All Rights Reserved. May not be copied, scanned, or duplicated, in whole or in part, except for use as permitted in a license distributed with a certain product or service or otherwise on a password-protected website for classroom use. Income Statement Proof Sales Less Total variable costs Contribution Margin Less Total fixed costs Profit before taxes Income taxes Profit after taxes P 240,000 (20,000 * 12) (80,000) (20,000 * 4) P 160,000 (100,000) P 60,000 (12,000) (60,000 * 20%) P 48,000 If fixed costs are P100,000, unit sales price is P12, unit variable cost is P4, and the desired after-tax profit is P48,000, the required sales are P240,000.
  • 15.
    © 2011 CengageLearning. All Rights Reserved. May not be copied, scanned, or duplicated, in whole or in part, except for use as permitted in a license distributed with a certain product or service or otherwise on a password-protected website for classroom use. Using CVP Analysis Set profit per unit X = FC/(CMu - PuBT) Sales Volume Total Fixed Cost Contribution Margin Profit per Unit Before Tax
  • 16.
    © 2011 CengageLearning. All Rights Reserved. May not be copied, scanned, or duplicated, in whole or in part, except for use as permitted in a license distributed with a certain product or service or otherwise on a password-protected website for classroom use. Graph Approach to Breakeven  Break-even chart illustrates relationships among  Revenue  Volume  Costs
  • 17.
    © 2011 CengageLearning. All Rights Reserved. May not be copied, scanned, or duplicated, in whole or in part, except for use as permitted in a license distributed with a certain product or service or otherwise on a password-protected website for classroom use. Traditional CVP Graph Total P Activity Level Fixed Costs Total Costs Total P Activity Level Total Costs Variable Costs Total P Activity Level Total Costs Total Revenues Loss Total P Activity Level Total Costs Total Revenues Profit
  • 18.
    © 2011 CengageLearning. All Rights Reserved. May not be copied, scanned, or duplicated, in whole or in part, except for use as permitted in a license distributed with a certain product or service or otherwise on a password-protected website for classroom use. Profit-Volume Graph P Activity Level Fixed Costs BEP Profit Loss
  • 19.
    © 2011 CengageLearning. All Rights Reserved. May not be copied, scanned, or duplicated, in whole or in part, except for use as permitted in a license distributed with a certain product or service or otherwise on a password-protected website for classroom use. Income Statement Approach Sales Less Total variable costs Contribution Margin Less Total fixed costs Profit before taxes Income taxes Profit after taxes B/E P 150,000 (50,000) P 100,000 (100,000) -0- Target Profit P 240,000 (80,000) P 160,000 (100,000) 60,000 (24,000) P 36,000 Proof of CVP and/or graph solutions
  • 20.
    © 2011 CengageLearning. All Rights Reserved. May not be copied, scanned, or duplicated, in whole or in part, except for use as permitted in a license distributed with a certain product or service or otherwise on a password-protected website for classroom use. Incremental Analysis  Focuses only on factors that change from one option to another  Changes in revenues, costs, and/or volume  BEP increases when  Fixed costs increase  Sales price decreases  Variable costs increase
  • 21.
    © 2011 CengageLearning. All Rights Reserved. May not be copied, scanned, or duplicated, in whole or in part, except for use as permitted in a license distributed with a certain product or service or otherwise on a password-protected website for classroom use. Multiproduct CVP Analysis  Assumes a constant product sales mix  Contribution margin is weighted on the quantities of each product included in the “bag” of products  Contribution margin of the product making up the largest proportion of the bag has the greatest impact on the average contribution margin of the product mix
  • 22.
    © 2011 CengageLearning. All Rights Reserved. May not be copied, scanned, or duplicated, in whole or in part, except for use as permitted in a license distributed with a certain product or service or otherwise on a password-protected website for classroom use. Sales mix Contribution margin per unit 3 2 P2 P1 FC = P8,000 “Bag”—three units of first product for every two units second product. Multiproduct CVP Analysis P8000 3(P2) + 2(P1) = 1,000 “bags” Breakeven
  • 23.
    © 2011 CengageLearning. All Rights Reserved. May not be copied, scanned, or duplicated, in whole or in part, except for use as permitted in a license distributed with a certain product or service or otherwise on a password-protected website for classroom use. 3 2 Sales mix x 1,000 3,000 x 1,000 2,000 Breakeven “bag” Breakeven units To break even, sell 3,000 of first product and 2,000 of second product. Multiproduct CVP Analysis
  • 24.
    © 2011 CengageLearning. All Rights Reserved. May not be copied, scanned, or duplicated, in whole or in part, except for use as permitted in a license distributed with a certain product or service or otherwise on a password-protected website for classroom use. Income Statement Proof Sales (units) CM per unit Total CM Less Total fixed costs Profit before taxes Product 1 3,000 X 2 P6,000 Product 2 2,000 X 1 P2,000 Total P8,000 (8,000) -0-
  • 25.
    © 2011 CengageLearning. All Rights Reserved. May not be copied, scanned, or duplicated, in whole or in part, except for use as permitted in a license distributed with a certain product or service or otherwise on a password-protected website for classroom use. Margin of Safety  How far the company is operating from its BEP  Budgeted (or actual) sales after the BEP  The amount that sales can drop before reaching the BEP  Measure of the amount of “cushion” against losses  Indication of risk  The lower the margin of safety, the more carefully management must watch sales and control costs.
  • 26.
    © 2011 CengageLearning. All Rights Reserved. May not be copied, scanned, or duplicated, in whole or in part, except for use as permitted in a license distributed with a certain product or service or otherwise on a password-protected website for classroom use. Margin of Safety  Units Actual units—break-even units  Dollars Actual sales dollars—break-even sales dollars  Percentage Margin of Safety in units or dollars Actual unit sales or dollar sales
  • 27.
    © 2011 CengageLearning. All Rights Reserved. May not be copied, scanned, or duplicated, in whole or in part, except for use as permitted in a license distributed with a certain product or service or otherwise on a password-protected website for classroom use. Operating Leverage  Relationship of variable and fixed costs  Effect on profits when volume changes  Cost structure strongly influences the impact that a change in volume has on profits
  • 28.
    © 2011 CengageLearning. All Rights Reserved. May not be copied, scanned, or duplicated, in whole or in part, except for use as permitted in a license distributed with a certain product or service or otherwise on a password-protected website for classroom use. Operating Leverage High Operating Leverage  Low variable costs  High fixed costs  High contribution margin  High BEP  Sales after break-even have greater impact on profits Low Operating Leverage  High variable costs  Low fixed costs  Low contribution margin  Low BEP  Sales after break-even have lesser impact on profits
  • 29.
    © 2011 CengageLearning. All Rights Reserved. May not be copied, scanned, or duplicated, in whole or in part, except for use as permitted in a license distributed with a certain product or service or otherwise on a password-protected website for classroom use. Degree of Operating Leverage  Measures how a percentage change in sales will affect profits  Degree of Operating Leverage Contribution Margin Profit Before Taxes
  • 30.
    © 2011 CengageLearning. All Rights Reserved. May not be copied, scanned, or duplicated, in whole or in part, except for use as permitted in a license distributed with a certain product or service or otherwise on a password-protected website for classroom use. Degree of Operating Leverage and Margin of Safety  When margin of safety is small, the degree of operating leverage is large Margin of Safety % = 1/Degree of Operating Leverage Degree of Operating Leverage = 1/Margin of Safety %
  • 31.
    © 2011 CengageLearning. All Rights Reserved. May not be copied, scanned, or duplicated, in whole or in part, except for use as permitted in a license distributed with a certain product or service or otherwise on a password-protected website for classroom use. Degree of Operating Leverage and Margin of Safety Actual sales 200,000 units Break-even sales 90,000 units Contribution margin P408,000 Profit before tax P224,400 Margin of Safety % = Actual sales – Break-even sales Actual sales = 200,000 – 90,000 200,000 55%
  • 32.
    © 2011 CengageLearning. All Rights Reserved. May not be copied, scanned, or duplicated, in whole or in part, except for use as permitted in a license distributed with a certain product or service or otherwise on a password-protected website for classroom use. Degree of Operating Leverage and Margin of Safety Degree of Operating = Contribution margin Leverage = Profit before taxes = P408,000 P224,400 1.818 Actual sales 200,000 units Break-even sales 90,000 units Contribution margin P408,000 Profit before tax P224,400
  • 33.
    © 2011 CengageLearning. All Rights Reserved. May not be copied, scanned, or duplicated, in whole or in part, except for use as permitted in a license distributed with a certain product or service or otherwise on a password-protected website for classroom use. Margin of Safety % = 1 Degree of Operating Leverage 55% = 1 1.818 Degree of Operating = 1 Leverage Margin of Safety% 1.818 = 1 .55 Degree of Operating Leverage and Margin of Safety
  • 34.
    © 2011 CengageLearning. All Rights Reserved. May not be copied, scanned, or duplicated, in whole or in part, except for use as permitted in a license distributed with a certain product or service or otherwise on a password-protected website for classroom use. Additional CVP Assumptions  Total contribution margin increases proportionally with increases in unit sales  No change in inventory (production equals sales)  No change in capacity  Sales mix remains constant  Anticipated price level changes included in formulas  Labor productivity, production technology, and market conditions remain constant Are fixed costs fixed or long-term variable costs?
  • 35.
    © 2011 CengageLearning. All Rights Reserved. May not be copied, scanned, or duplicated, in whole or in part, except for use as permitted in a license distributed with a certain product or service or otherwise on a password-protected website for classroom use. Questions  What is the difference between absorption and variable costing?  How do companies use CVP analysis?  What are the underlying assumptions of CVP analysis?
  • 36.
    © 2011 CengageLearning. All Rights Reserved. May not be copied, scanned, or duplicated, in whole or in part, except for use as permitted in a license distributed with a certain product or service or otherwise on a password-protected website for classroom use. Potential Ethical Issues  Ignoring relevant range in setting assumptions about cost behavior  Using absorption (fixed manufacturing) costs as part of variable costs for CVP analysis  Using improper assumptions about cost and volume relationships to manipulate results  Assuming constant sales mix while ignoring demand for individual products  Using CVP analysis to improperly support long-term cost management strategies  Visually distorting break-even graphs  Using irrelevant information in incremental analysis