Lecture IM-7 for the managment system in any organaysation
1.
IPE4
1
0
1 IndustrialManagement
Cost andmanagerial accounting
Mohammad Shafiul Alam
Asst. Prof.
Department of Electrical and Electronics Engineering
Northern University Bangladesh
2.
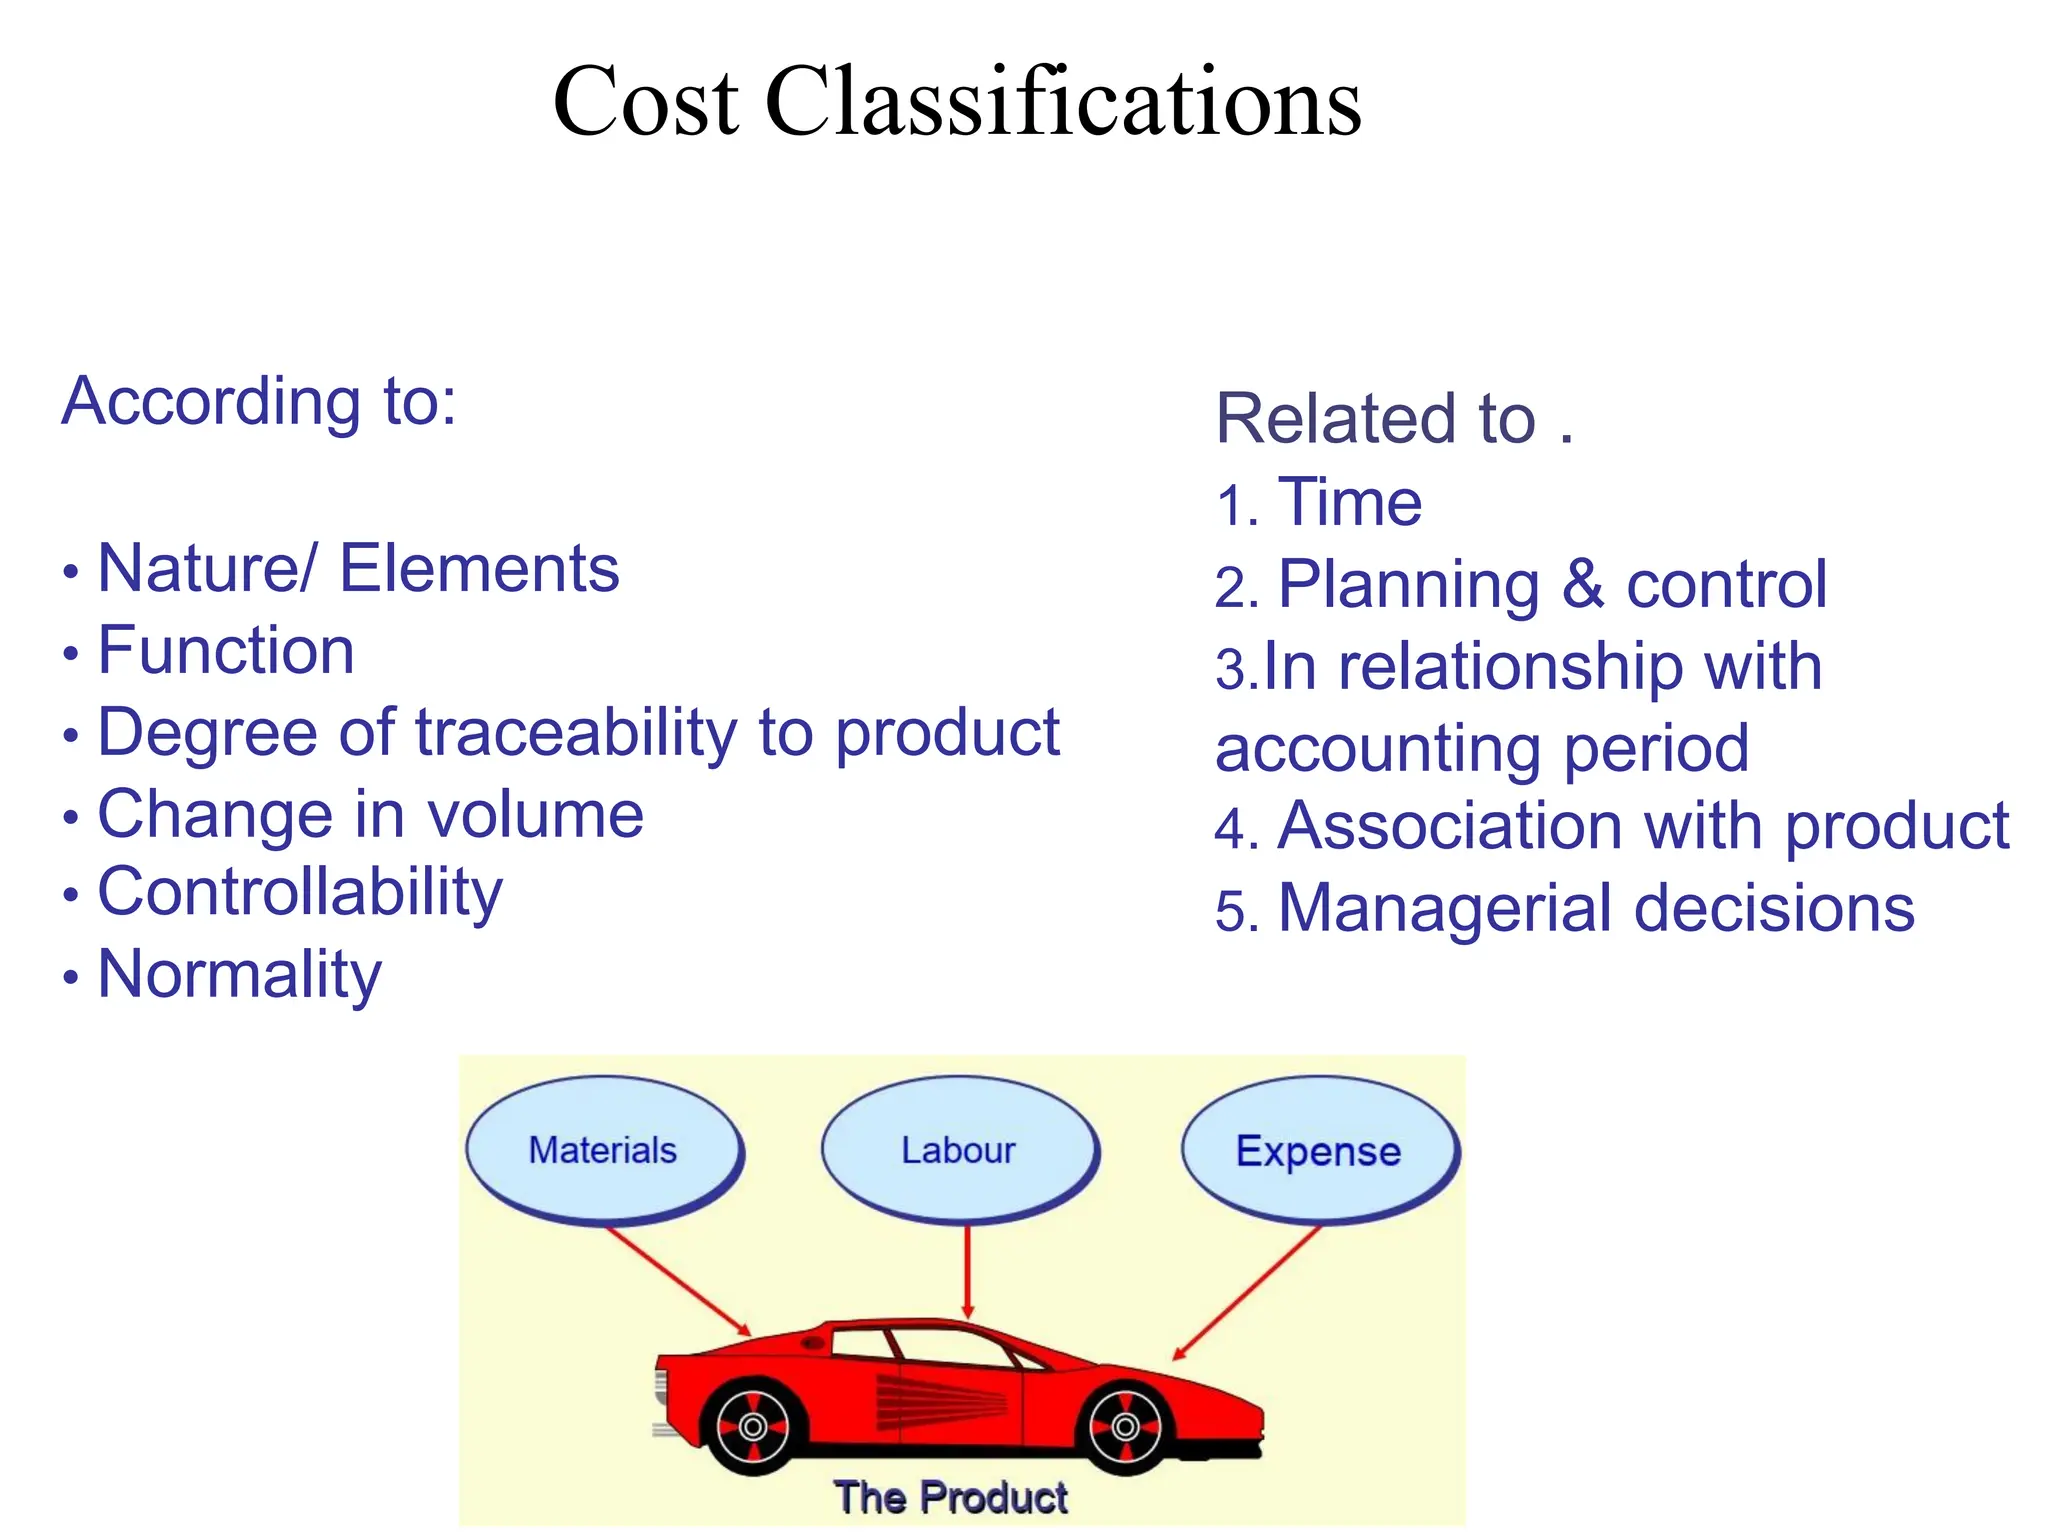
Cost Classifications
According to:
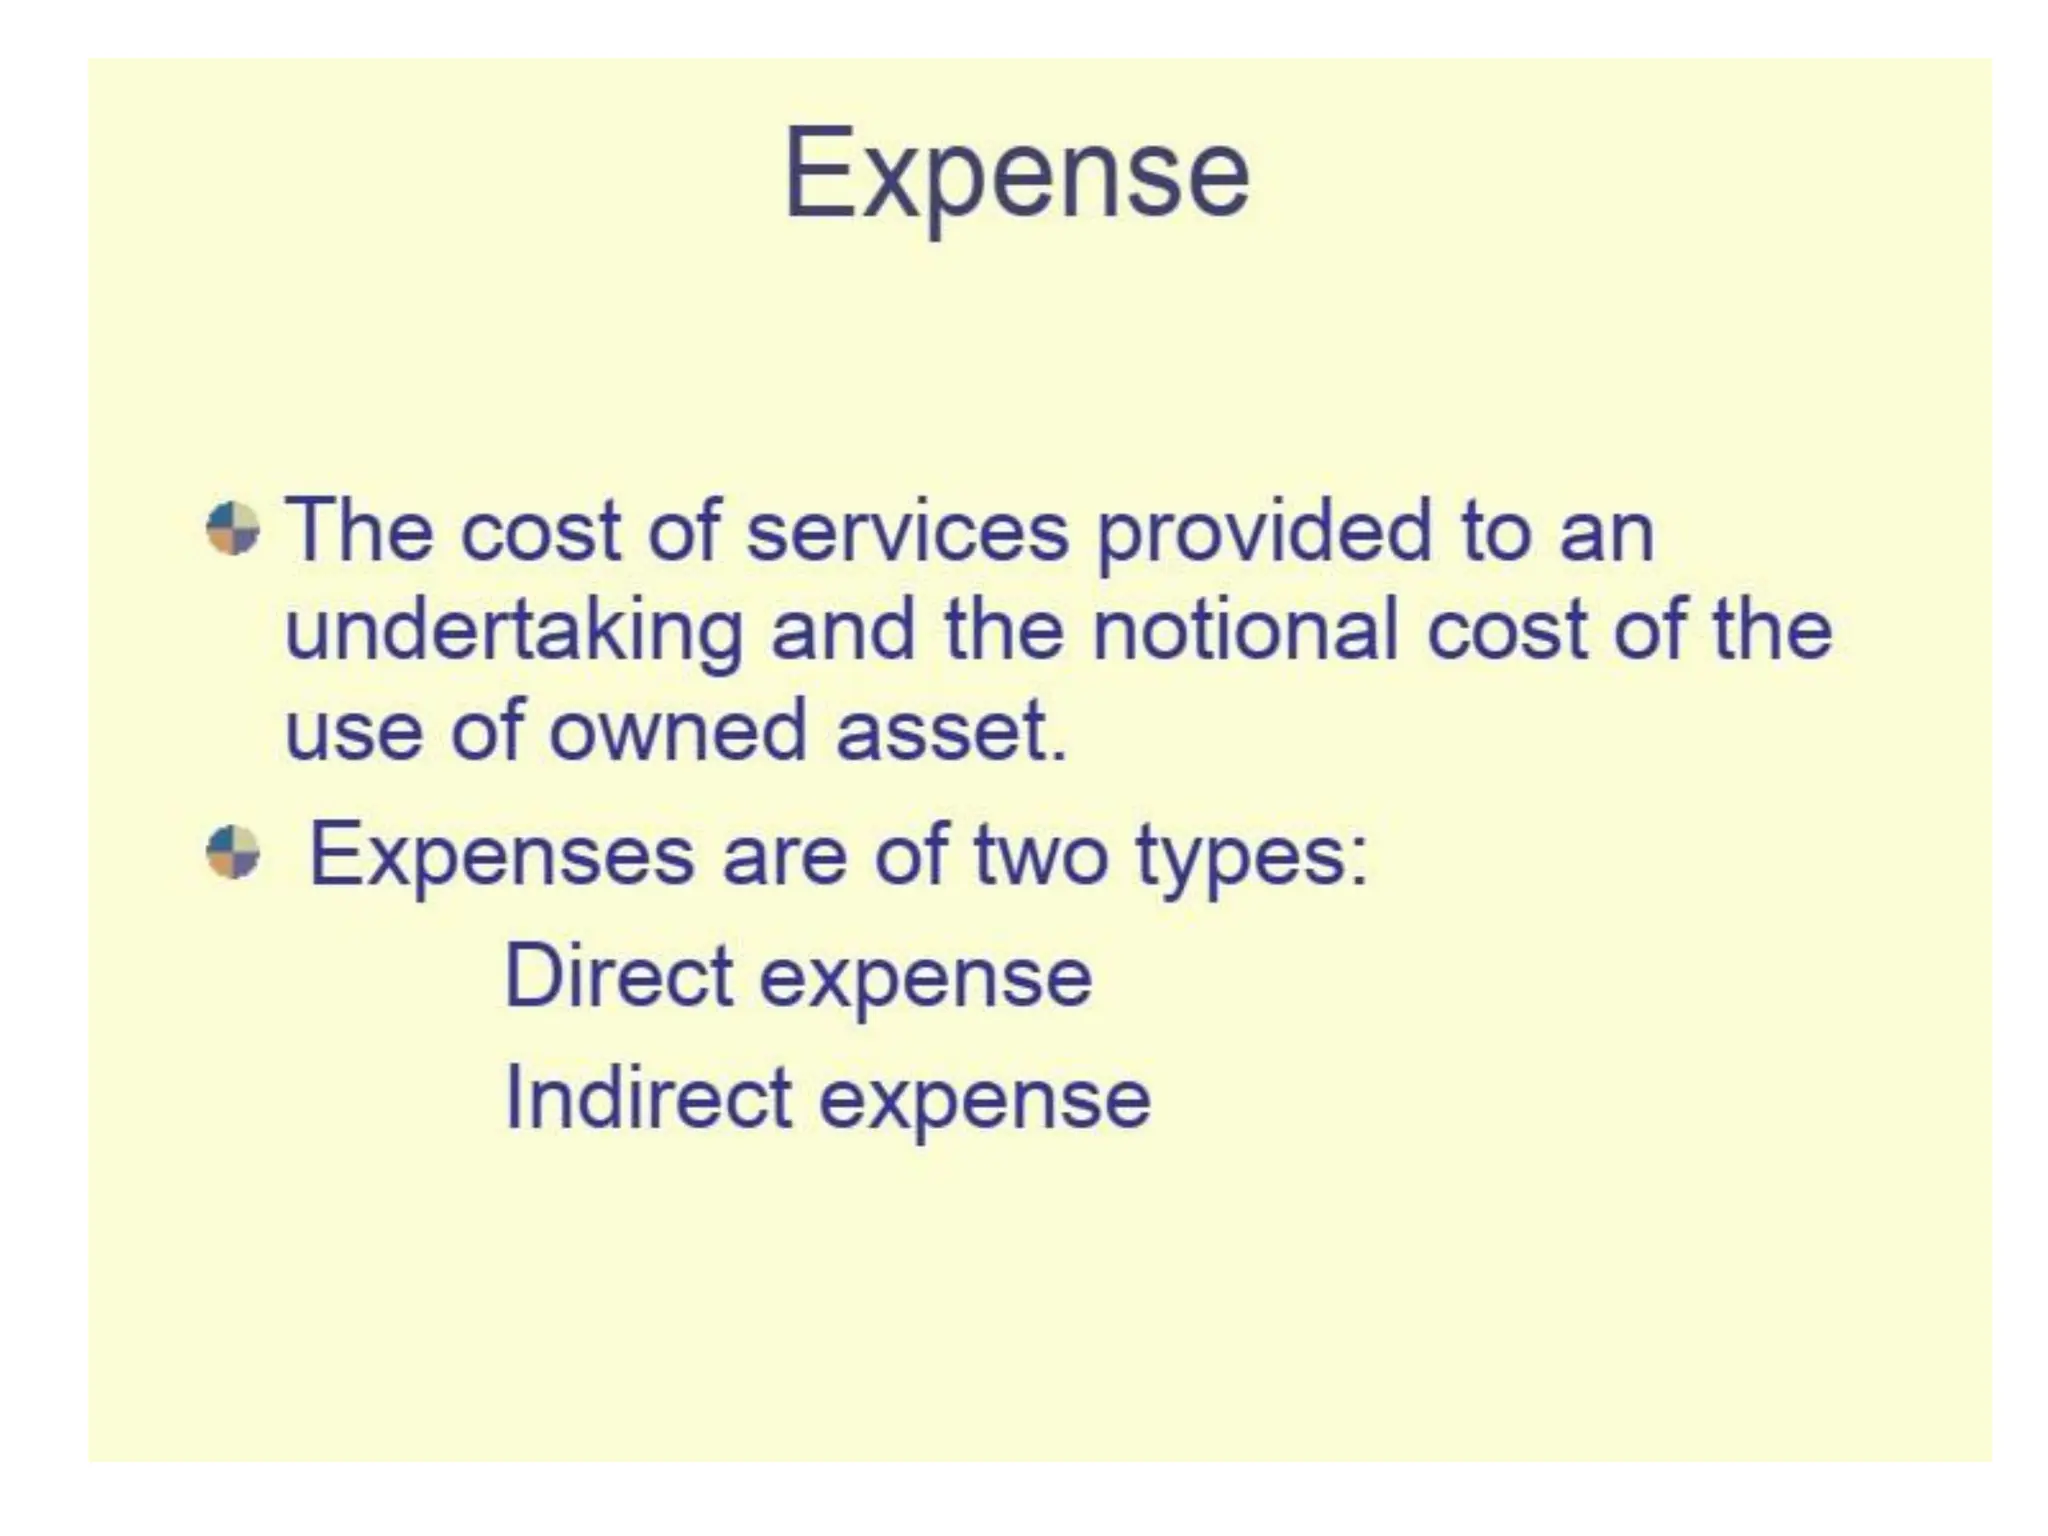
•Nature/ Elements
• Function
• Degree of traceability to product
• Change in volume
• Controllability
• Normality
Related to .
1. Time
2. Planning & control
3.In relationship with
accounting period
4. Association with product
5. Managerial decisions
9.
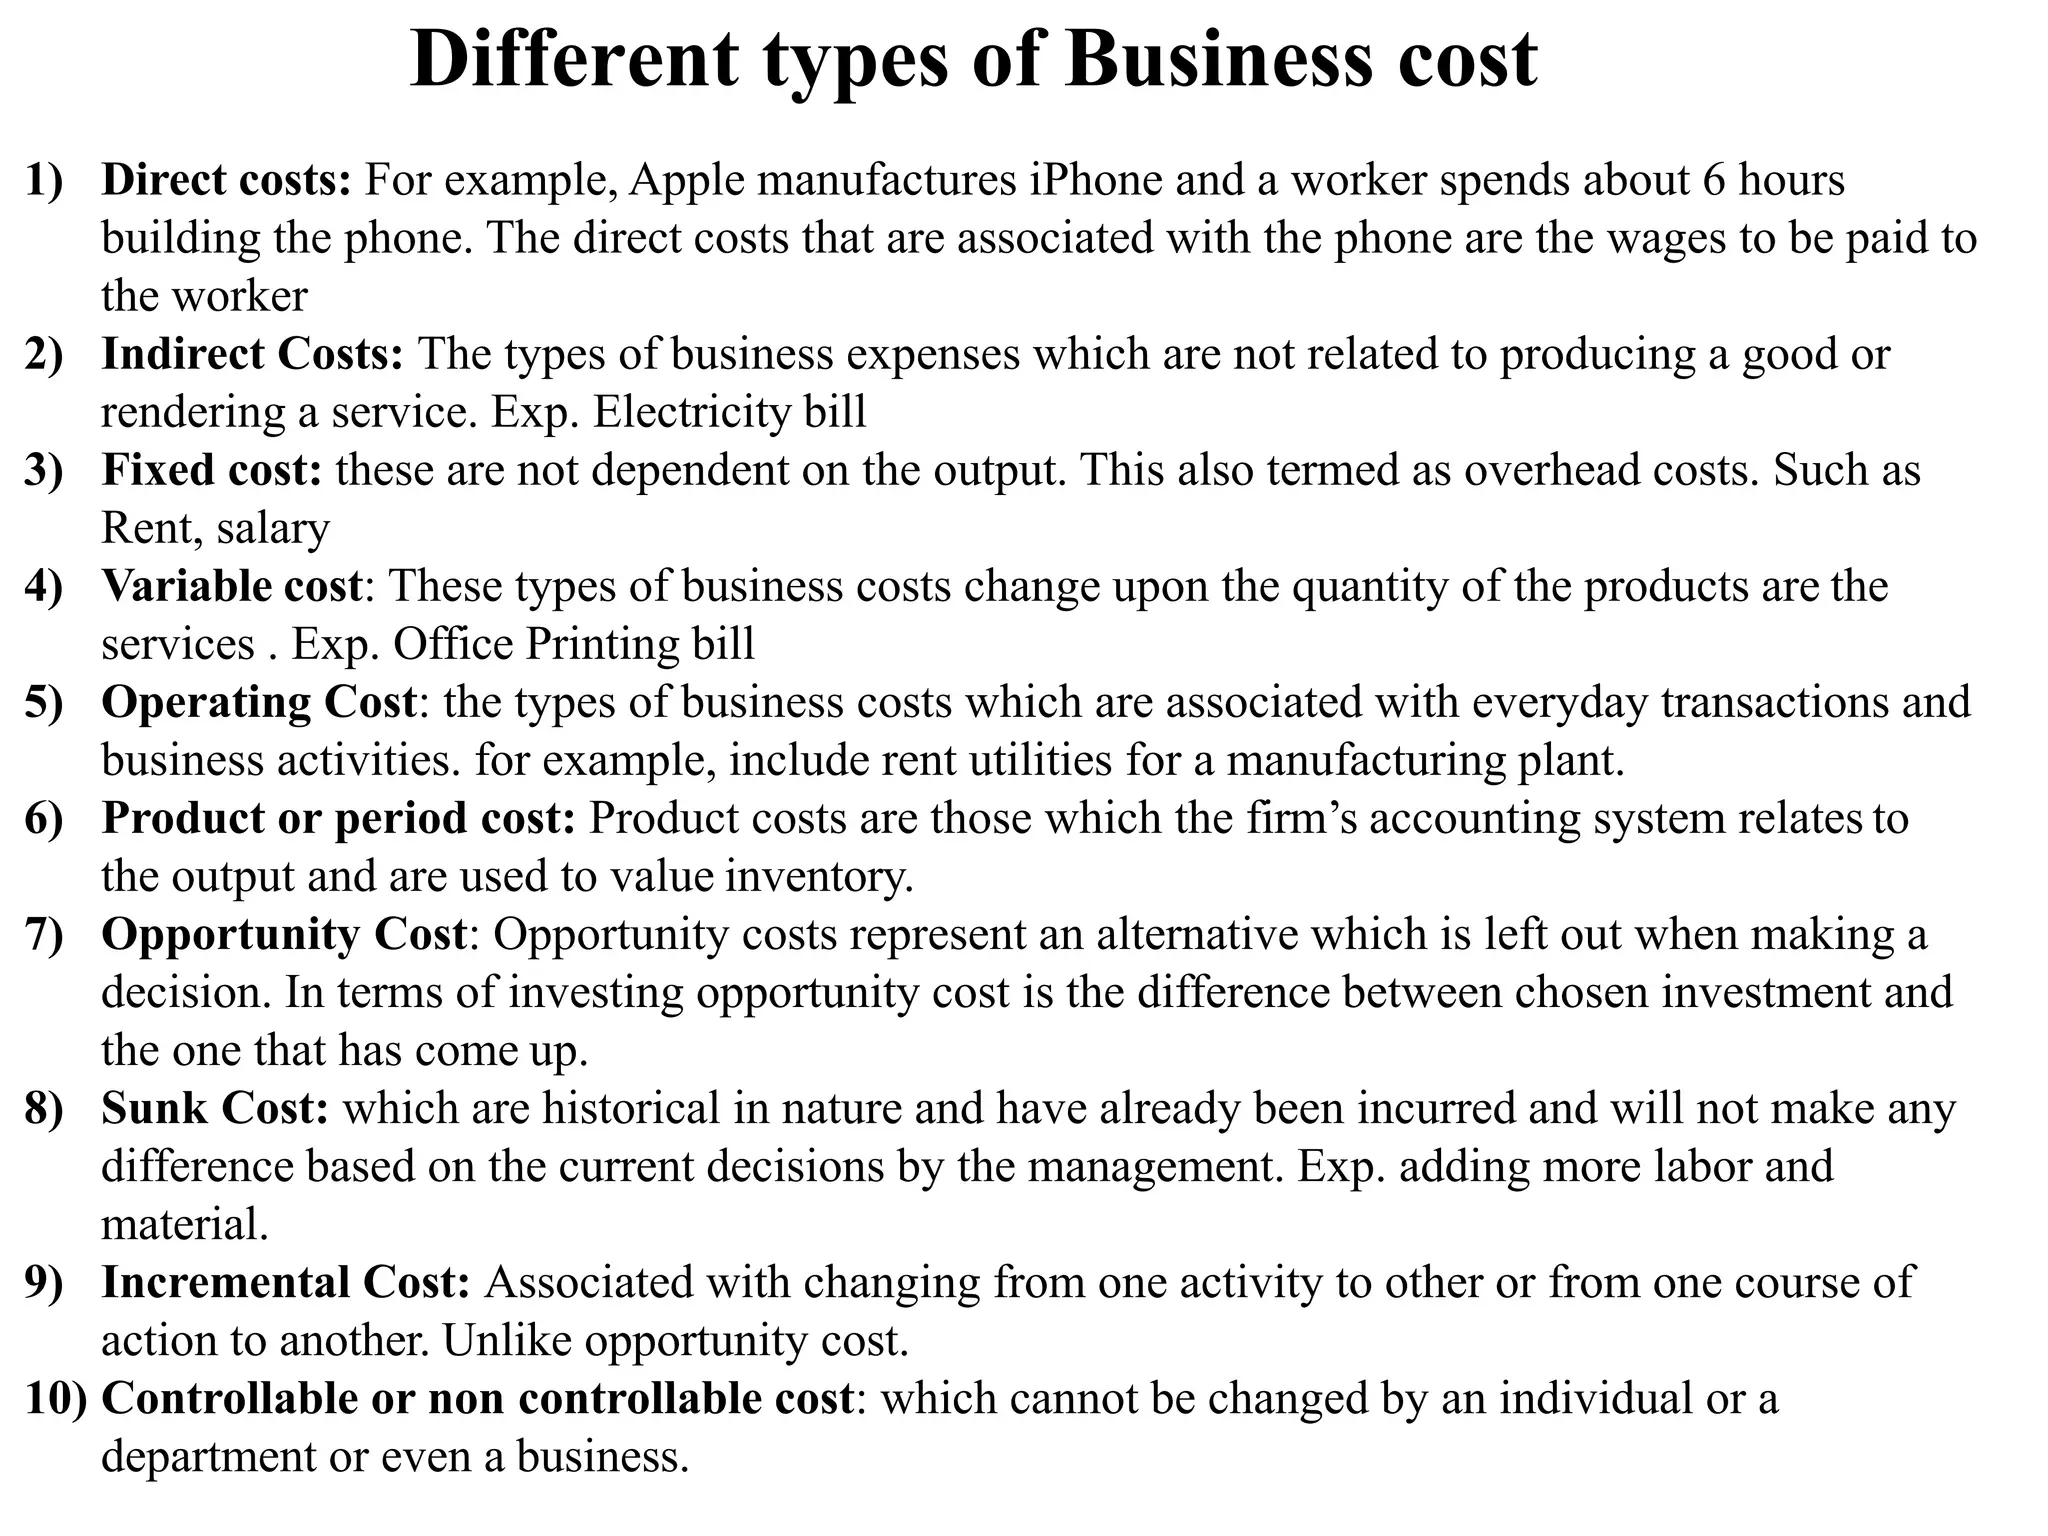
Different types ofBusiness cost
1) Direct costs: For example, Apple manufactures iPhone and a worker spends about 6 hours
building the phone. The direct costs that are associated with the phone are the wages to be paid to
the worker
2) Indirect Costs: The types of business expenses which are not related to producing a good or
rendering a service. Exp. Electricity bill
3) Fixed cost: these are not dependent on the output. This also termed as overhead costs. Such as
Rent, salary
4) Variable cost: These types of business costs change upon the quantity of the products are the
services . Exp. Office Printing bill
5) Operating Cost: the types of business costs which are associated with everyday transactions and
business activities. for example, include rent utilities for a manufacturing plant.
6) Product or period cost: Product costs are those which the firm’s accounting system relates to
the output and are used to value inventory.
7) Opportunity Cost: Opportunity costs represent an alternative which is left out when making a
decision. In terms of investing opportunity cost is the difference between chosen investment and
the one that has come up.
8) Sunk Cost: which are historical in nature and have already been incurred and will not make any
difference based on the current decisions by the management. Exp. adding more labor and
material.
9) Incremental Cost: Associated with changing from one activity to other or from one course of
action to another. Unlike opportunity cost.
10) Controllable or non controllable cost: which cannot be changed by an individual or a
department or even a business.
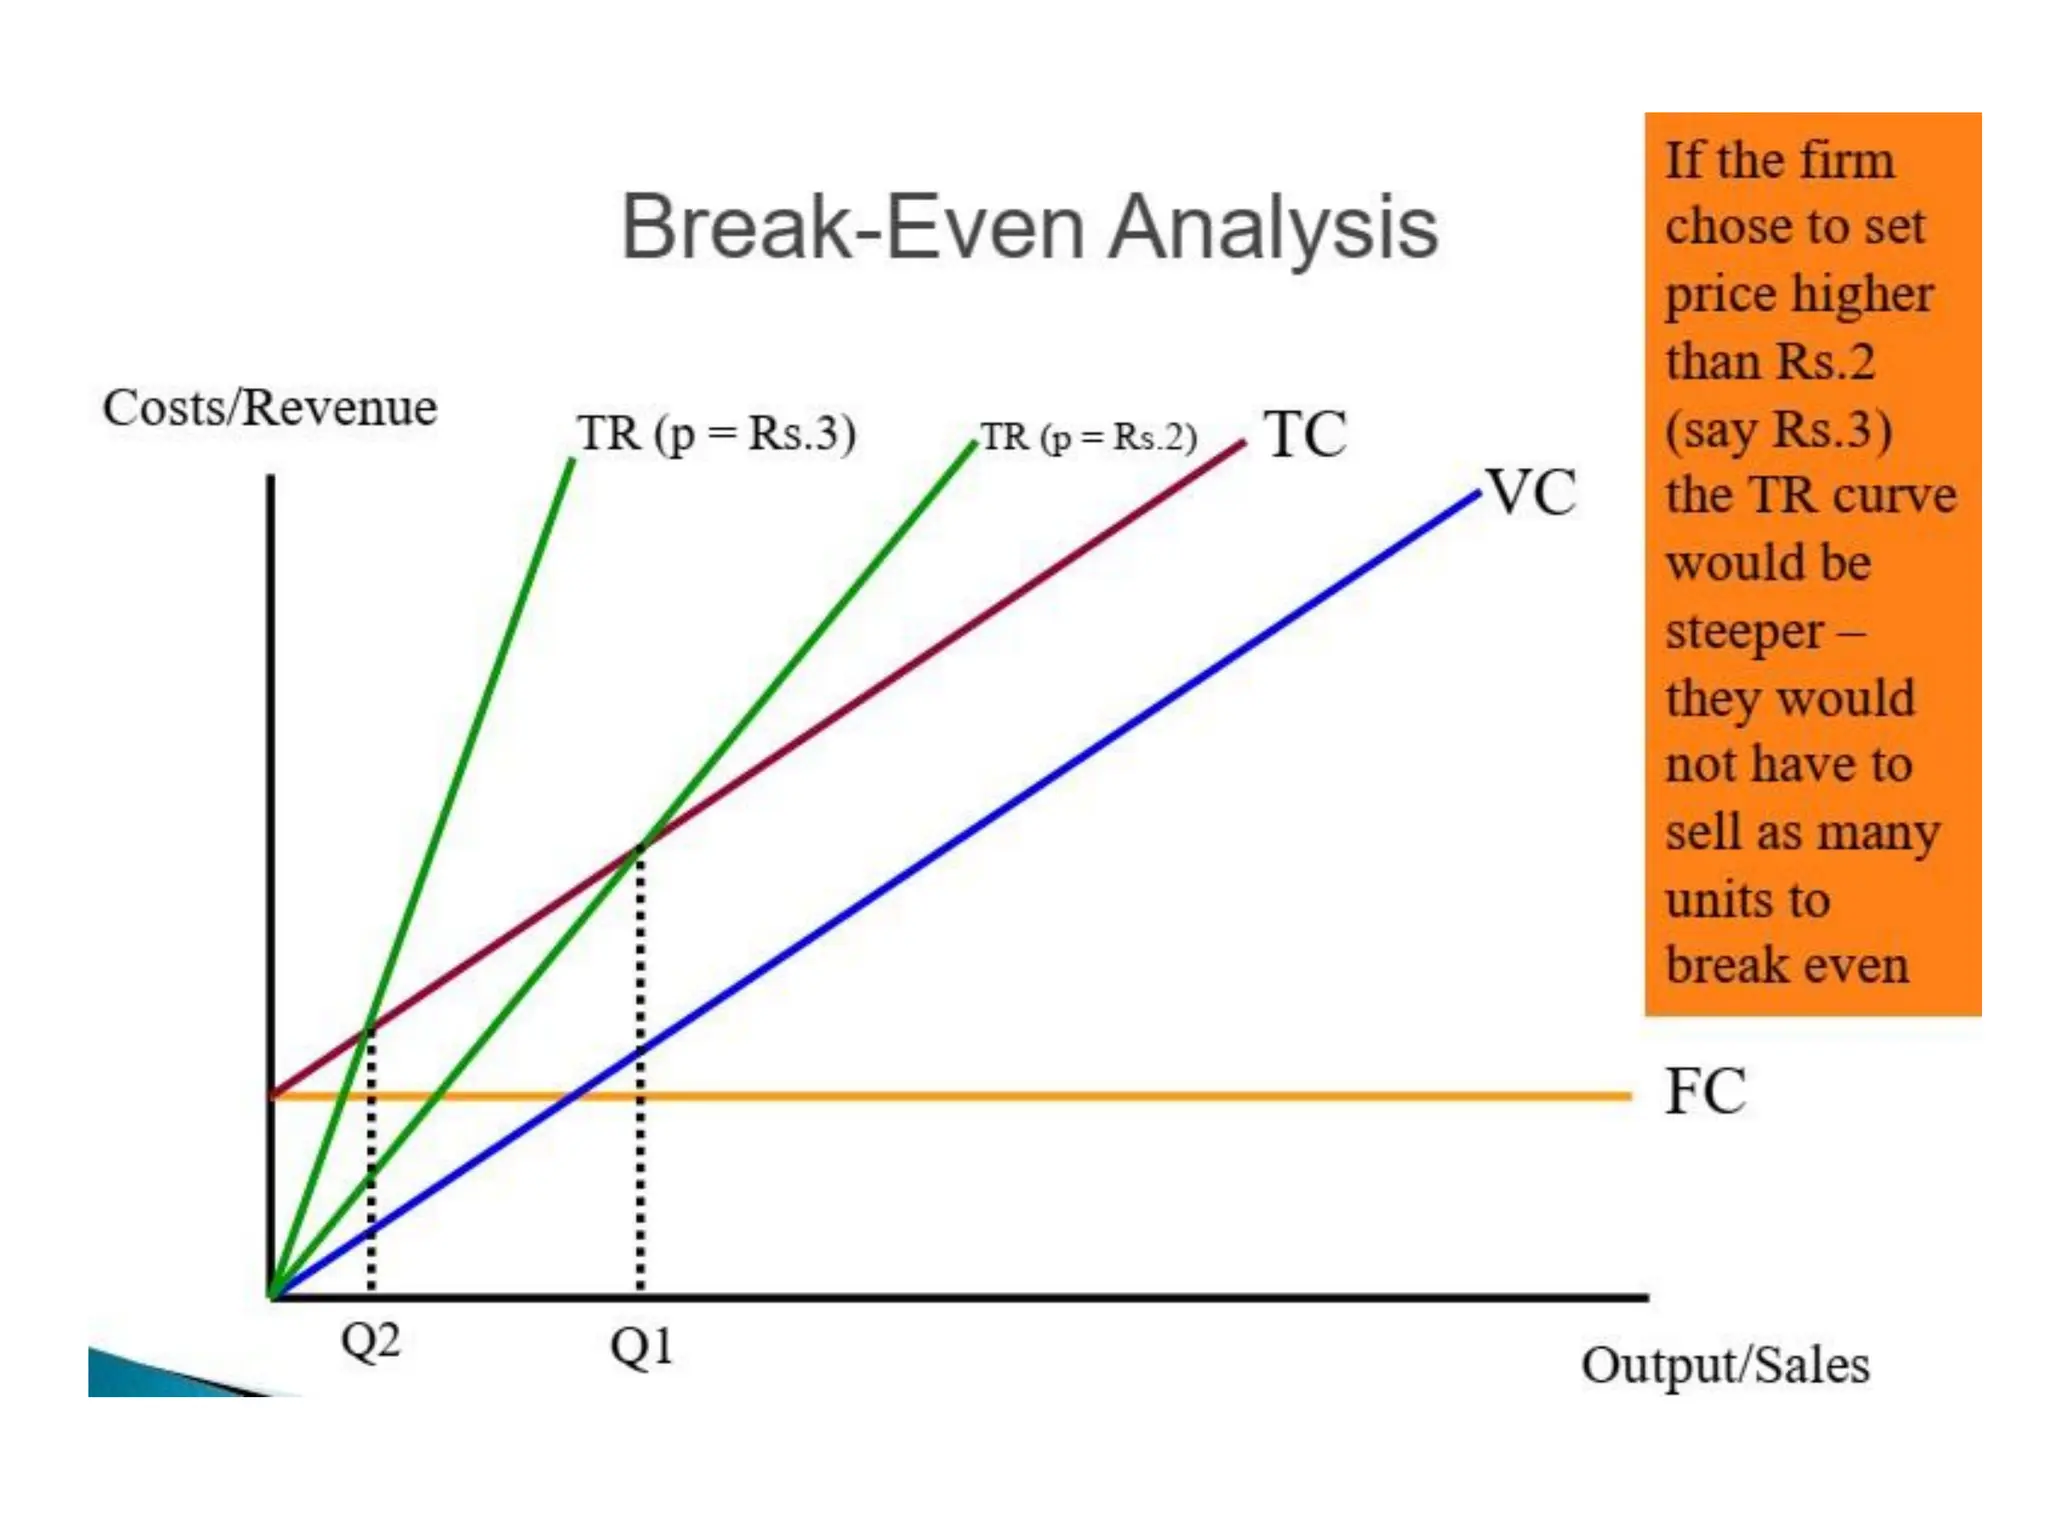
Break-even (BE) Analysis
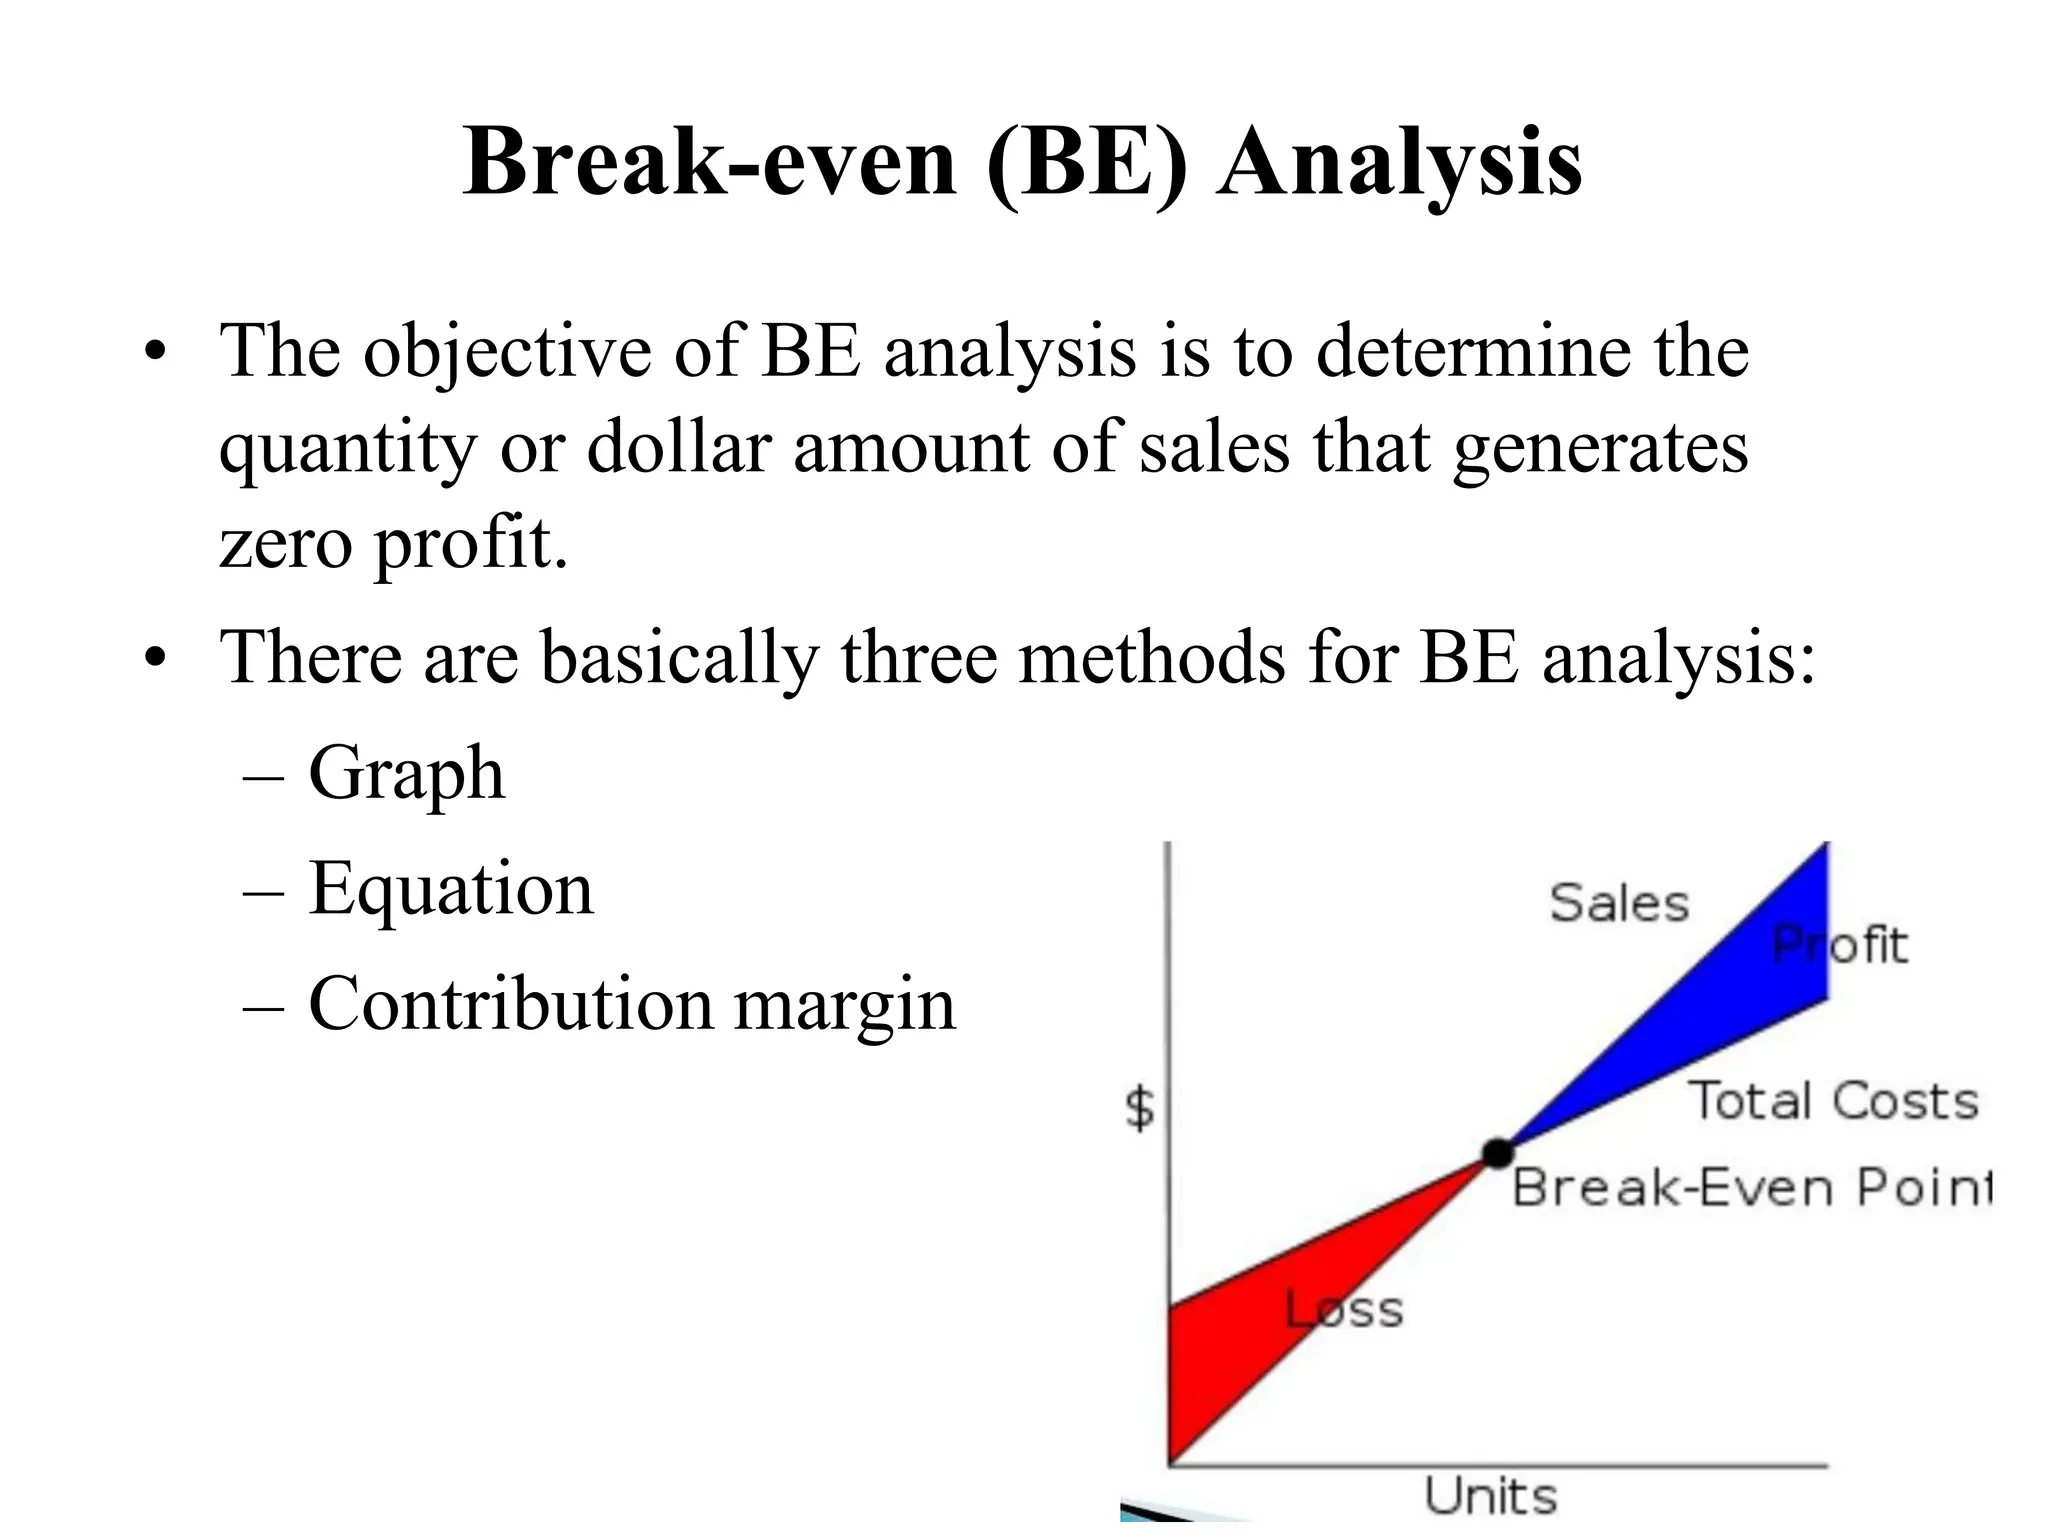
•The objective of BE analysis is to determine the
quantity or dollar amount of sales that generates
zero profit.
• There are basically three methods for BE analysis:
– Graph
– Equation
– Contribution margin
Cont..
In order tocalculate how profitable a product will be, we must
look at the Costs Price and Revenue involved.
There are two basic types of costs a company incurs.
• Variable Costs
• Fixed Costs
Variable costs are costs that change with changes in
production levels or sales. Examples include: Costs of
materials used in the production of the goods.
Fixed costs remain roughly the same regardless of
sales/output levels. Examples include: Rent, Insurance and
Wages
14.
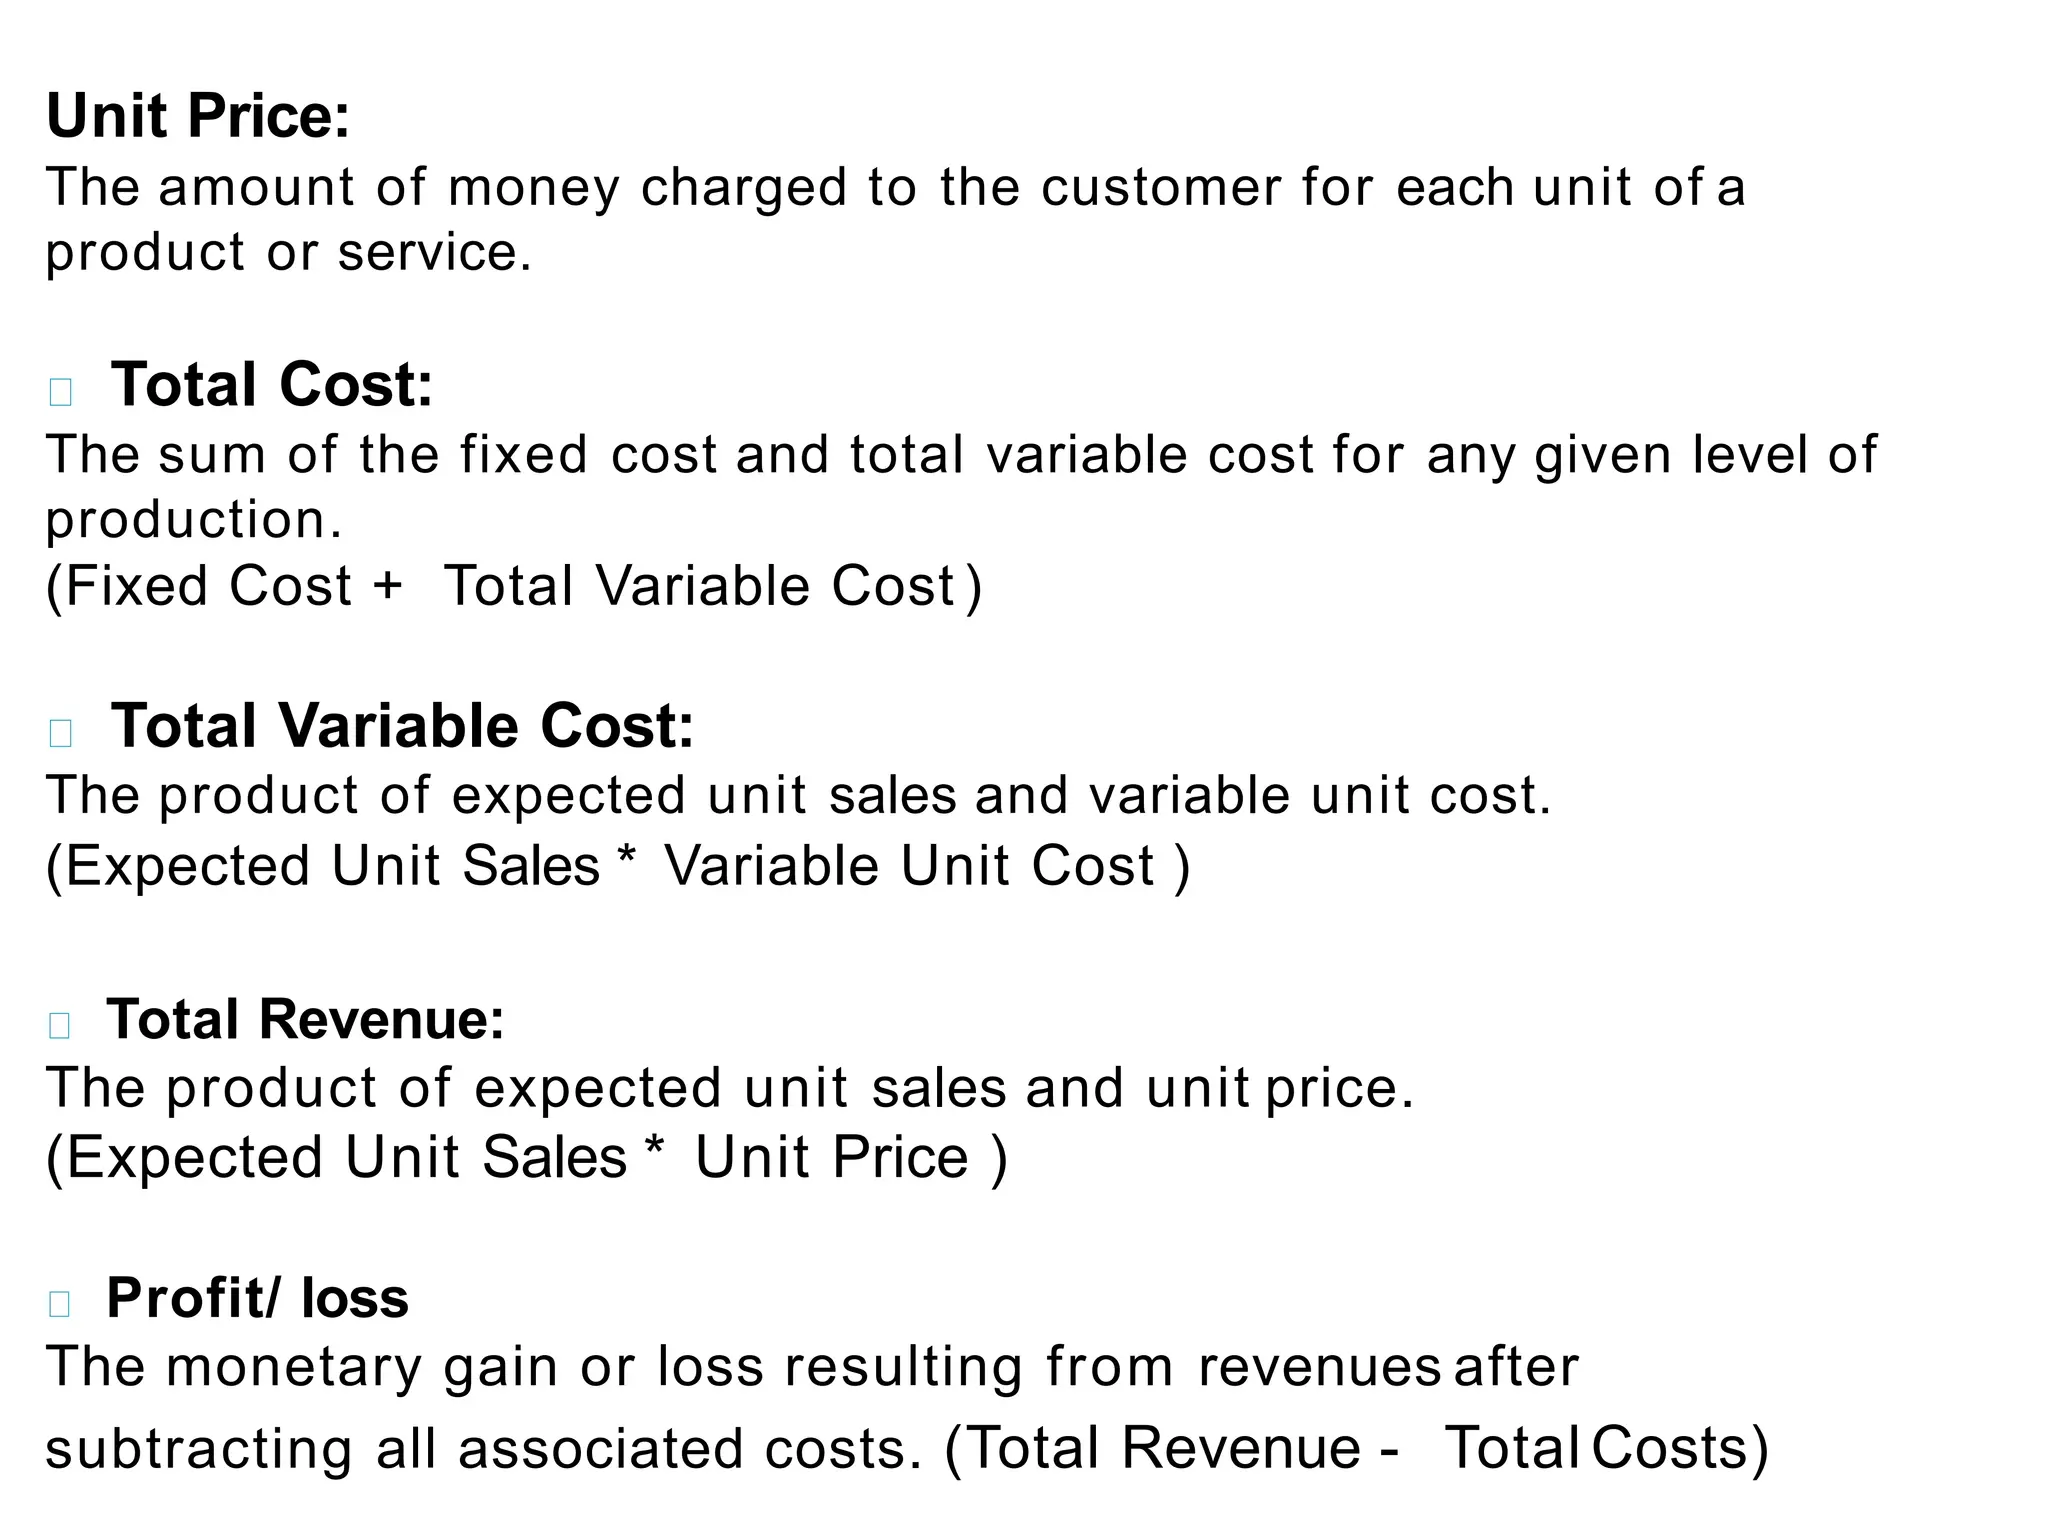
Unit Price:
The amountof money charged to the customer for each unit of a
product or service.
Total Cost:
The sum of the fixed cost and total variable cost for any given level of
production.
(Fixed Cost + Total Variable Cost )
Total Variable Cost:
The product of expected unit sales and variable unit cost.
(Expected Unit Sales * Variable Unit Cost )
Total Revenue:
The product of expected unit sales and unit price.
(Expected Unit Sales * Unit Price )
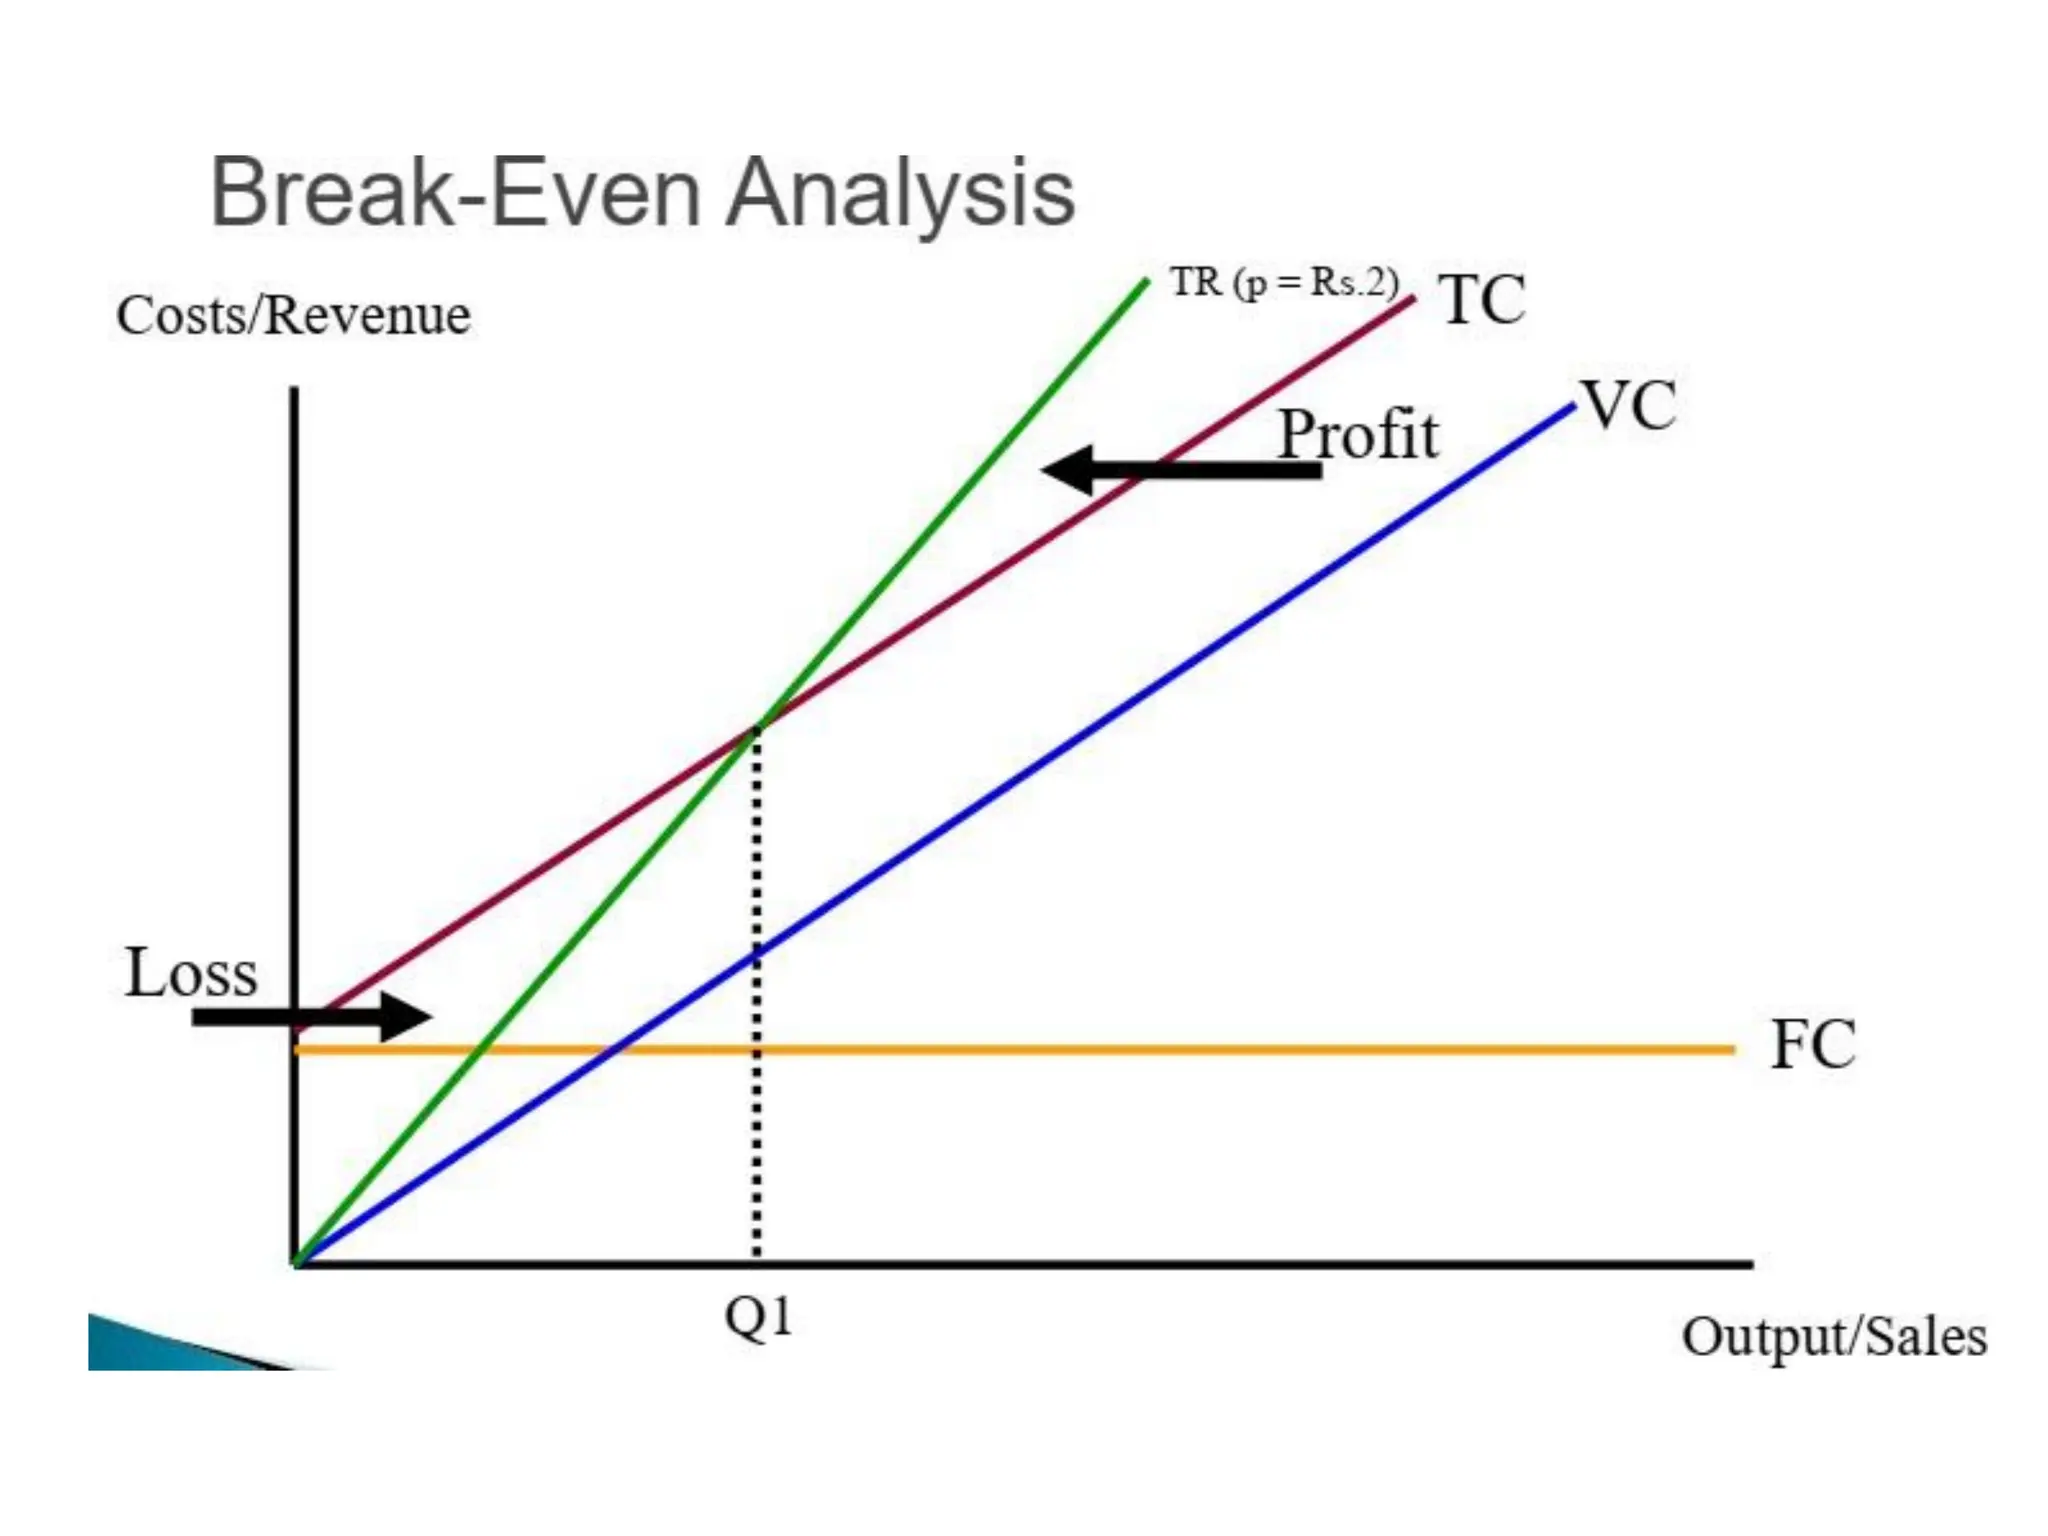
Profit/ loss
The monetary gain or loss resulting from revenues after
subtracting all associated costs. (Total Revenue - Total Costs)
15.
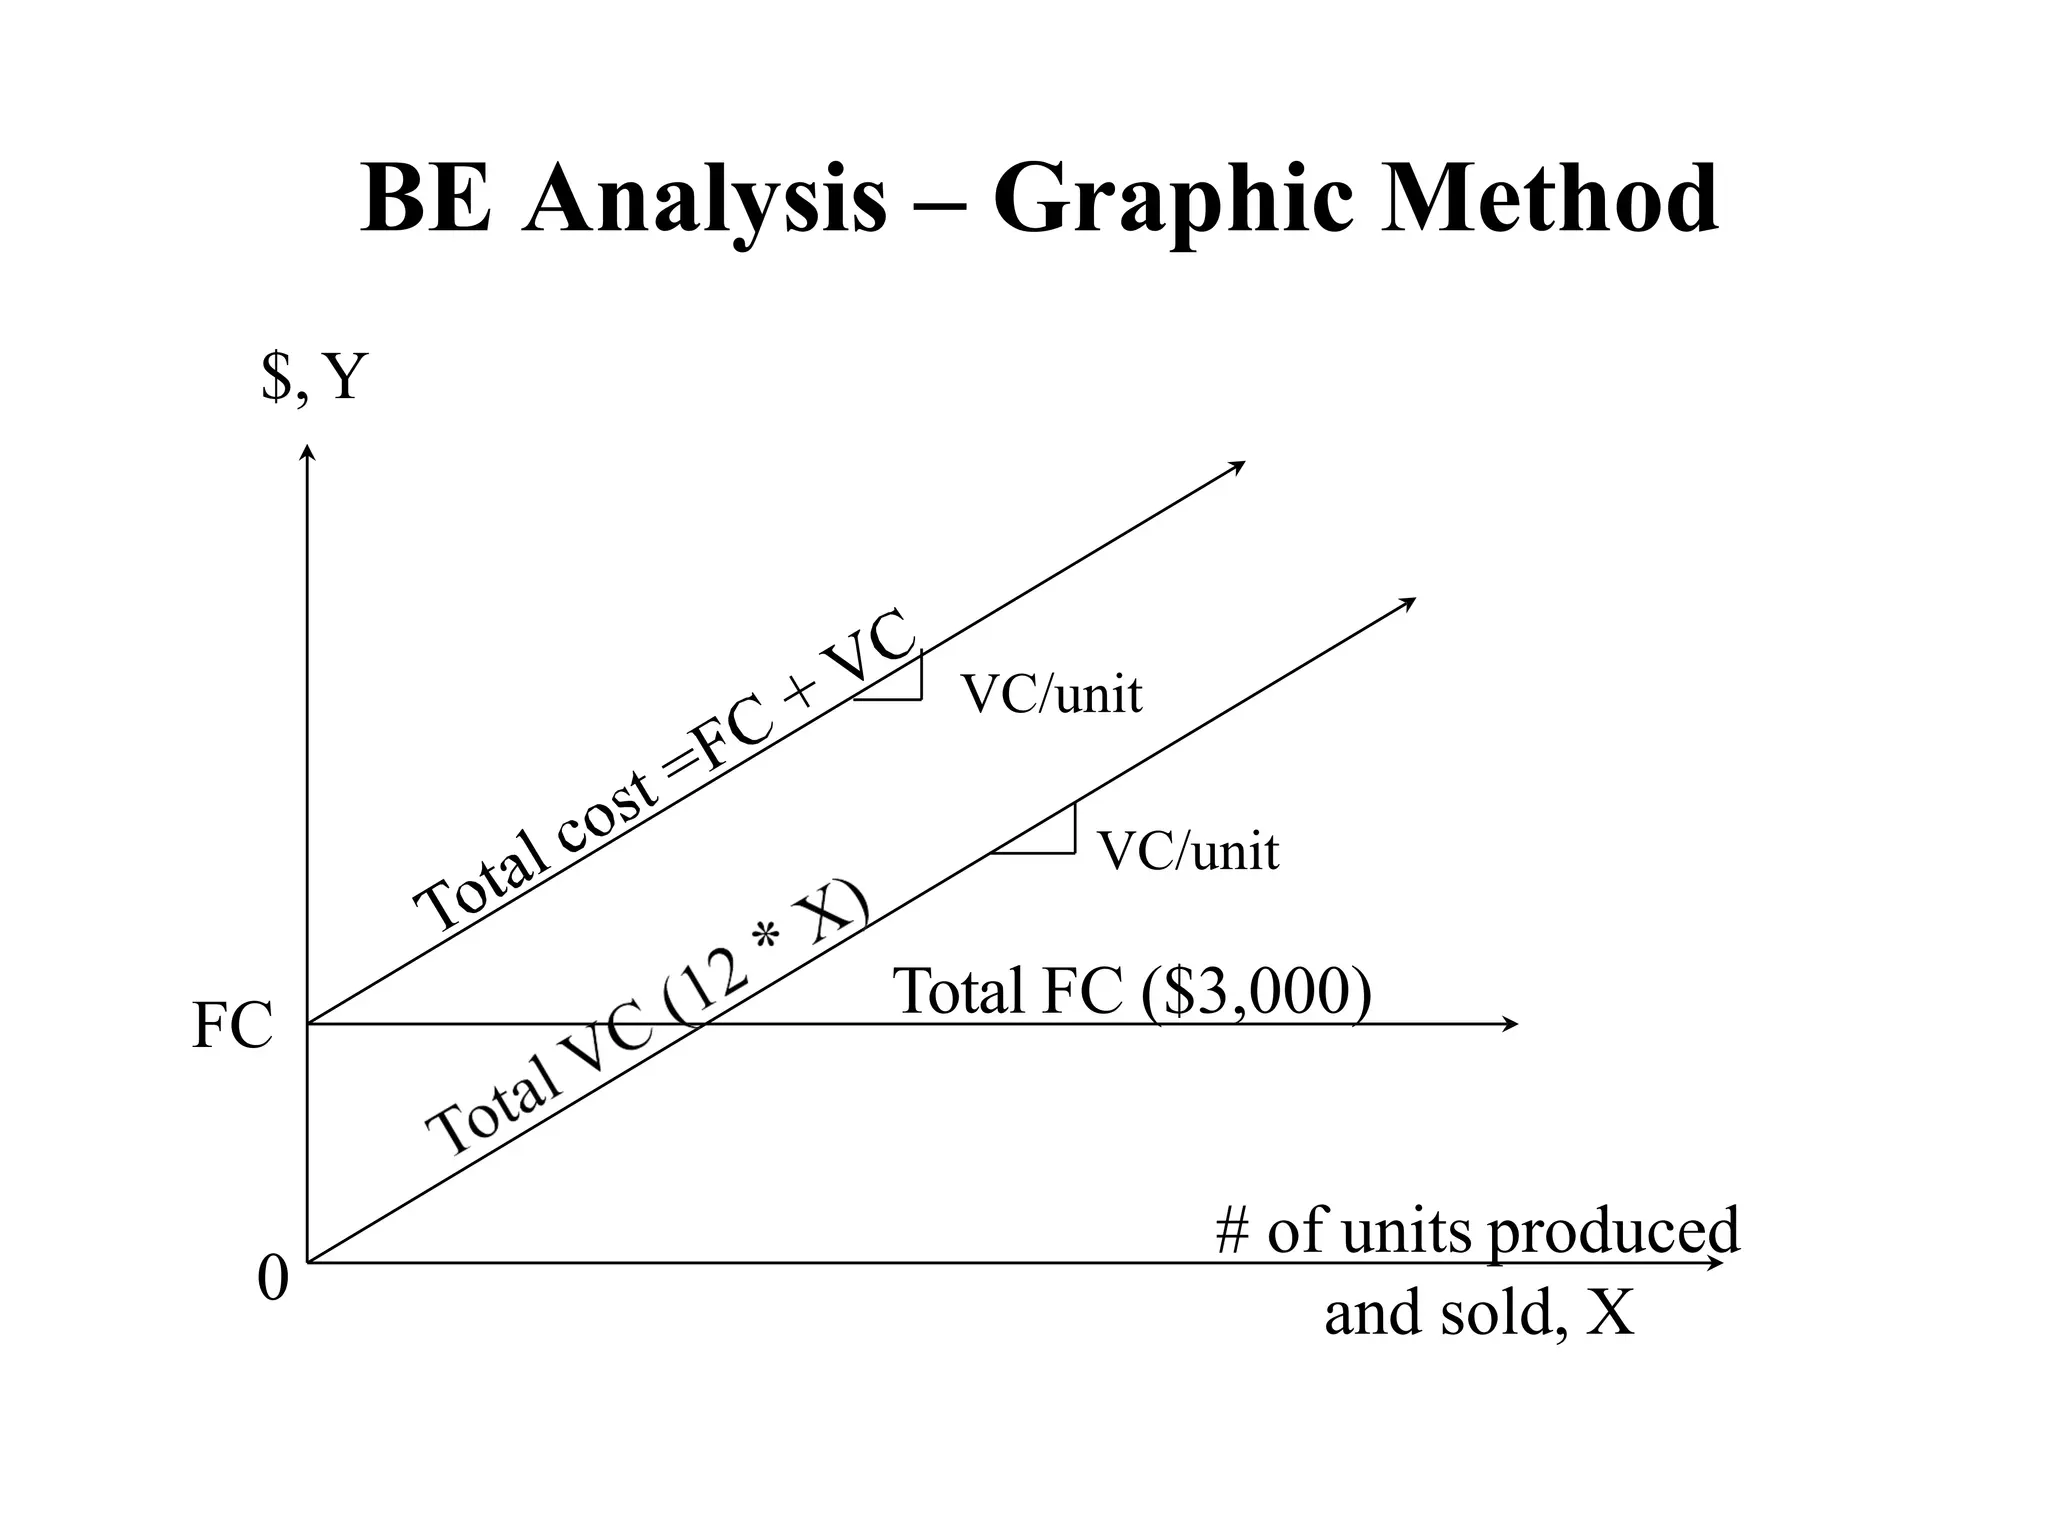
BE Analysis –Graphic Method
# of units produced
and sold, X
$,Y
0
Total FC ($3,000)
FC
VC/unit
VC/unit
16.
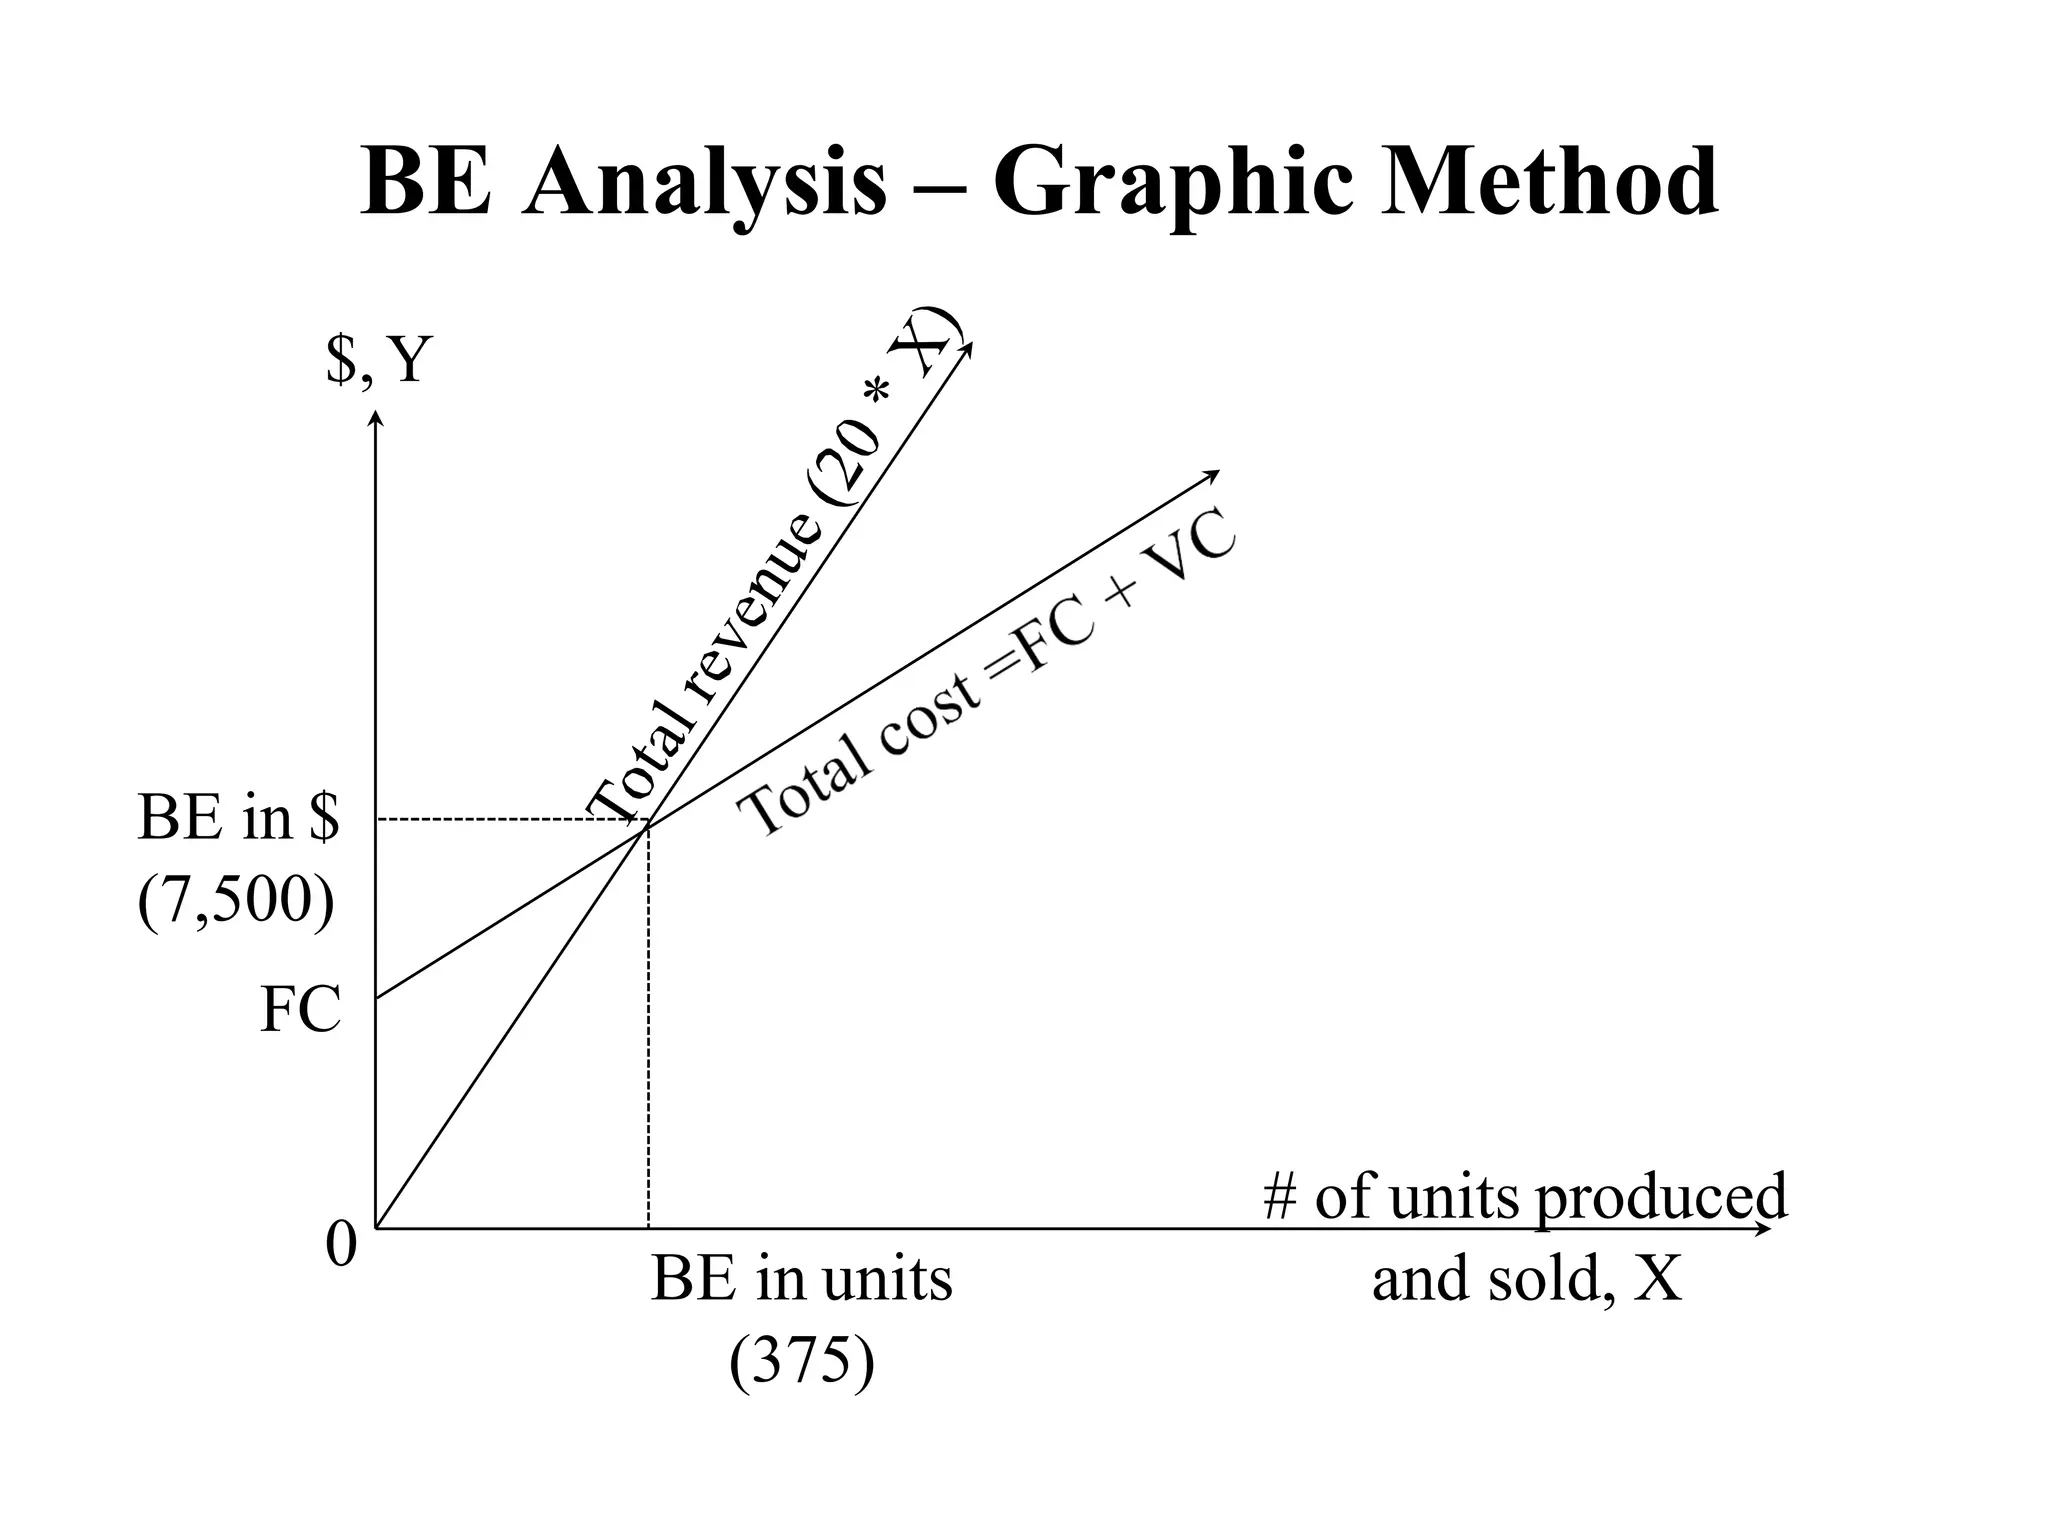
# of unitsproduced
and sold, X
$,Y
0
BE in $
(7,500)
FC
BE in units
(375)
BE Analysis – Graphic Method
17.
Examples
For example, supposethat your fixed costs for producing
100,000 product were 30,000 Rs a year.
Your variable costs are 2.20 R.s materials, 4.00 R.s labor, and
0.80 Rs overhead, for a total of 7.00 R.s per unit.
If you choose a selling price of 12.00 Rs for each product, then:
BEP= TFC/P-V
30,000(TFC) divided by [12.00(P) - 7.00(V)] equals 6000 units.
This is the number of products that have to be sold at a selling
price of 12.00 Rs before your business will start to make a profit.
For example, if it costs R.s. 50 to produce a pen, and there
are fixed costs of R.s.1,000, the break-even point for selling
the widgets would be:
If selling for R.s. 100: 20 Widgets
(Calculated as 1000/(100-50)=20)
If selling for $200: 20 Widgets
(Calculated as 1000/(200-50)=6.7)
From this we can make out that the company should sell
products at higher price to reach BEPfaster.
19.
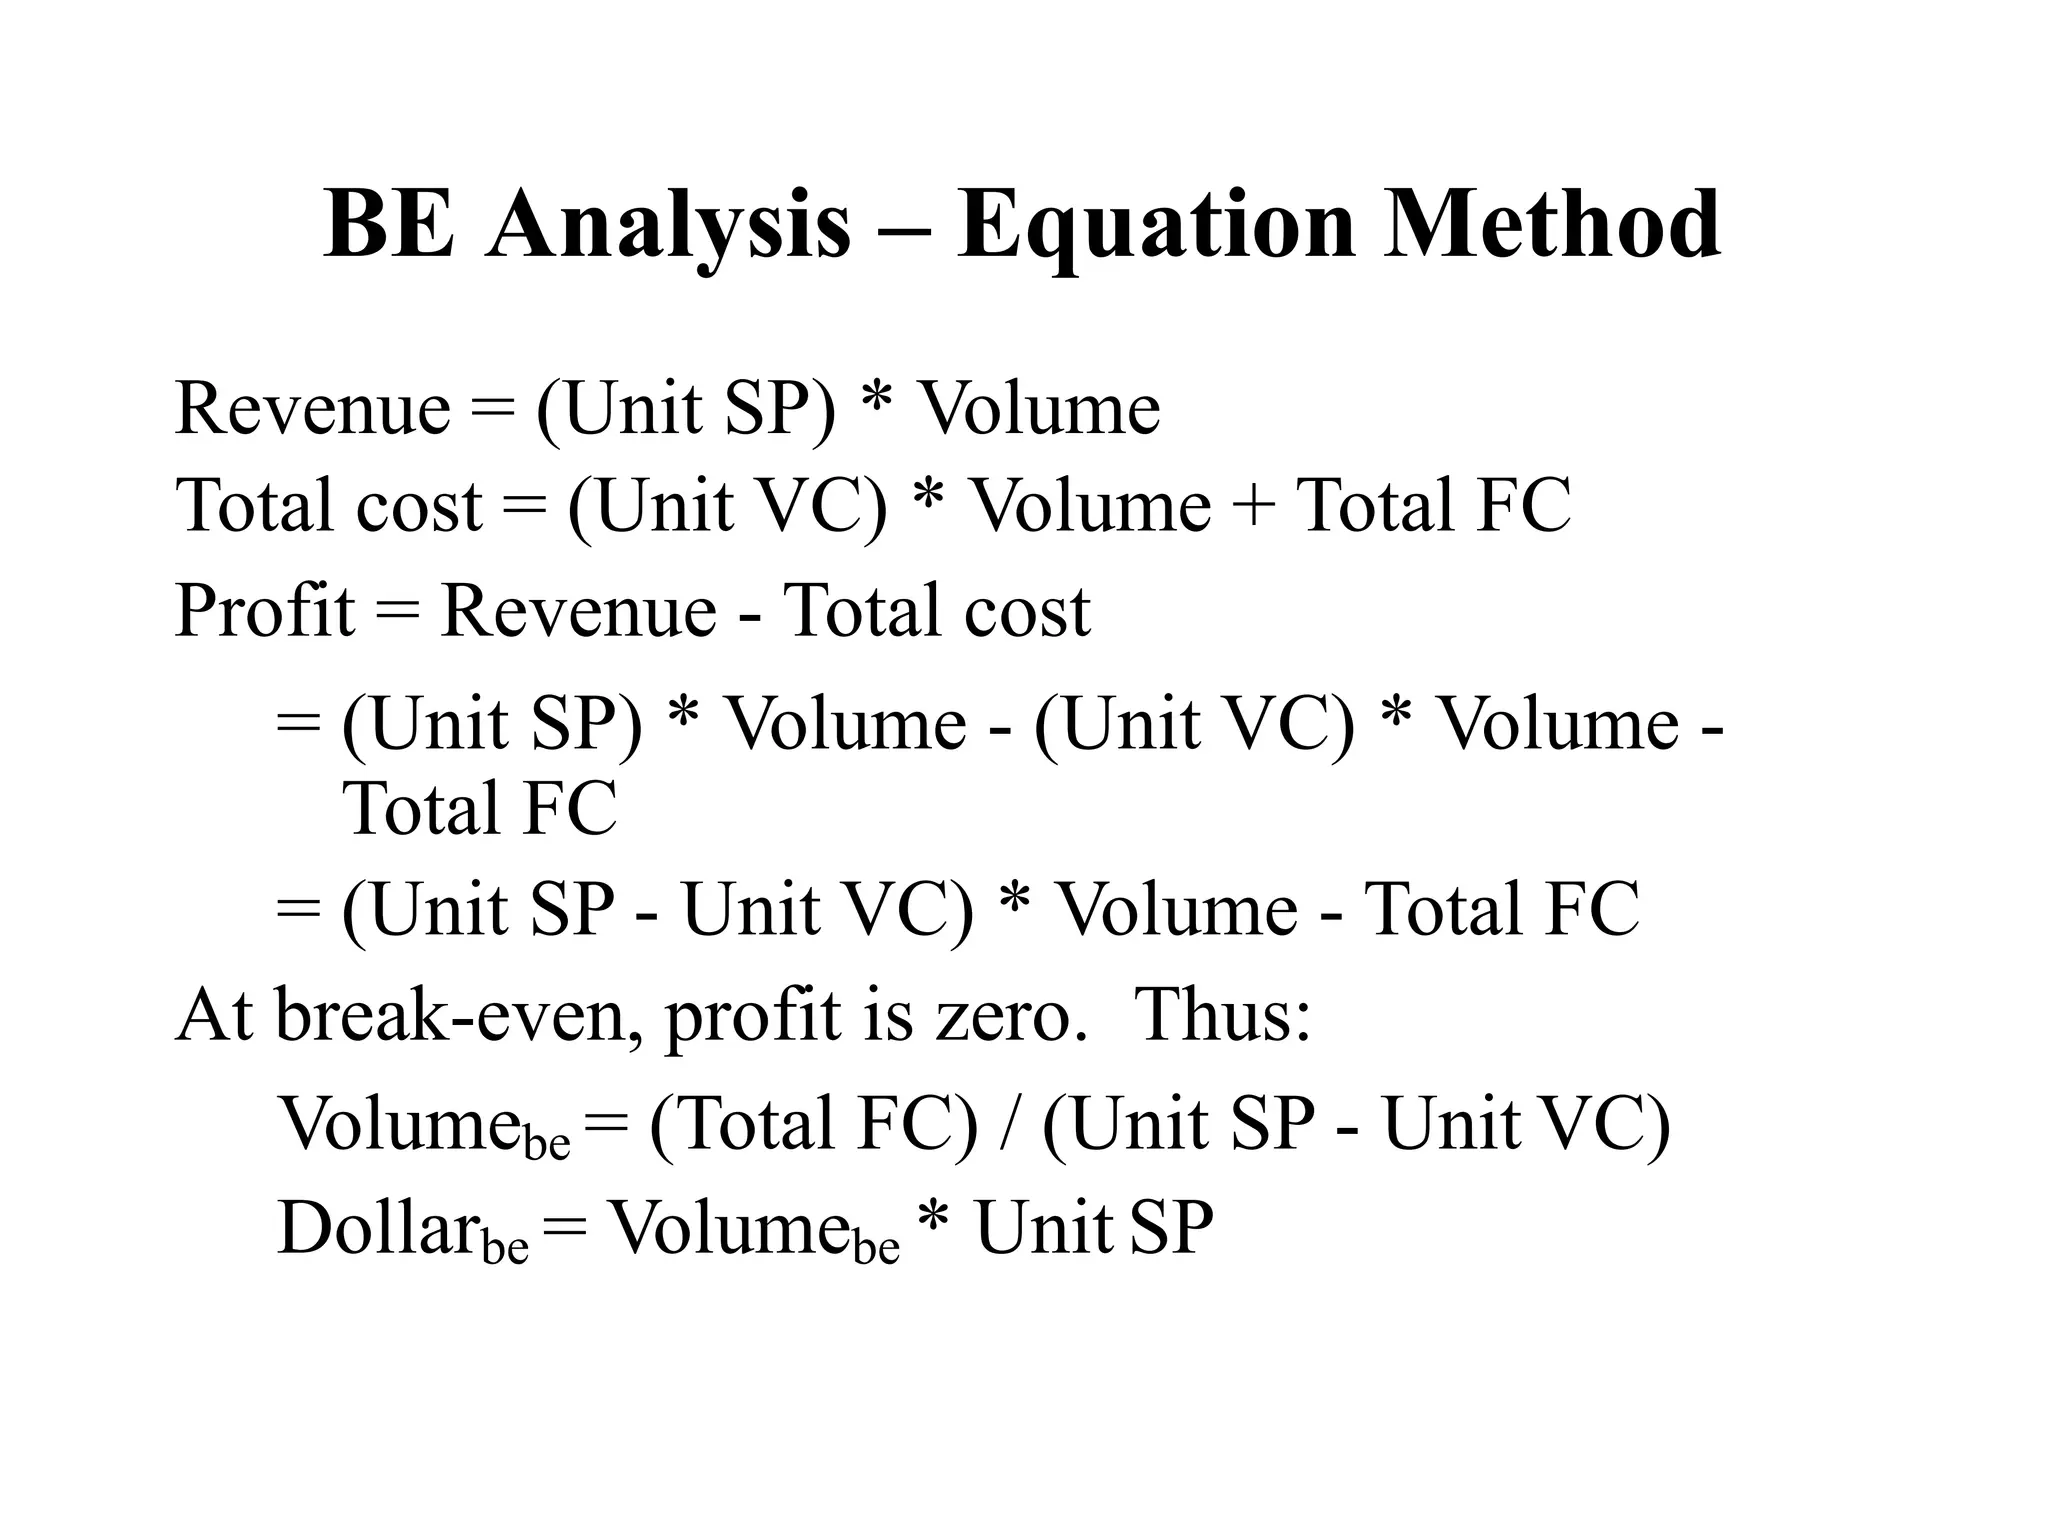
BE Analysis –Equation Method
Revenue = (Unit SP) * Volume
Total cost = (Unit VC) * Volume + Total FC
Profit = Revenue - Total cost
= (Unit SP) * Volume - (Unit VC) * Volume -
Total FC
= (Unit SP - Unit VC) * Volume - Total FC
At break-even, profit is zero. Thus:
Volumebe = (Total FC) / (Unit SP - Unit VC)
Dollarbe = Volumebe * Unit SP
20.
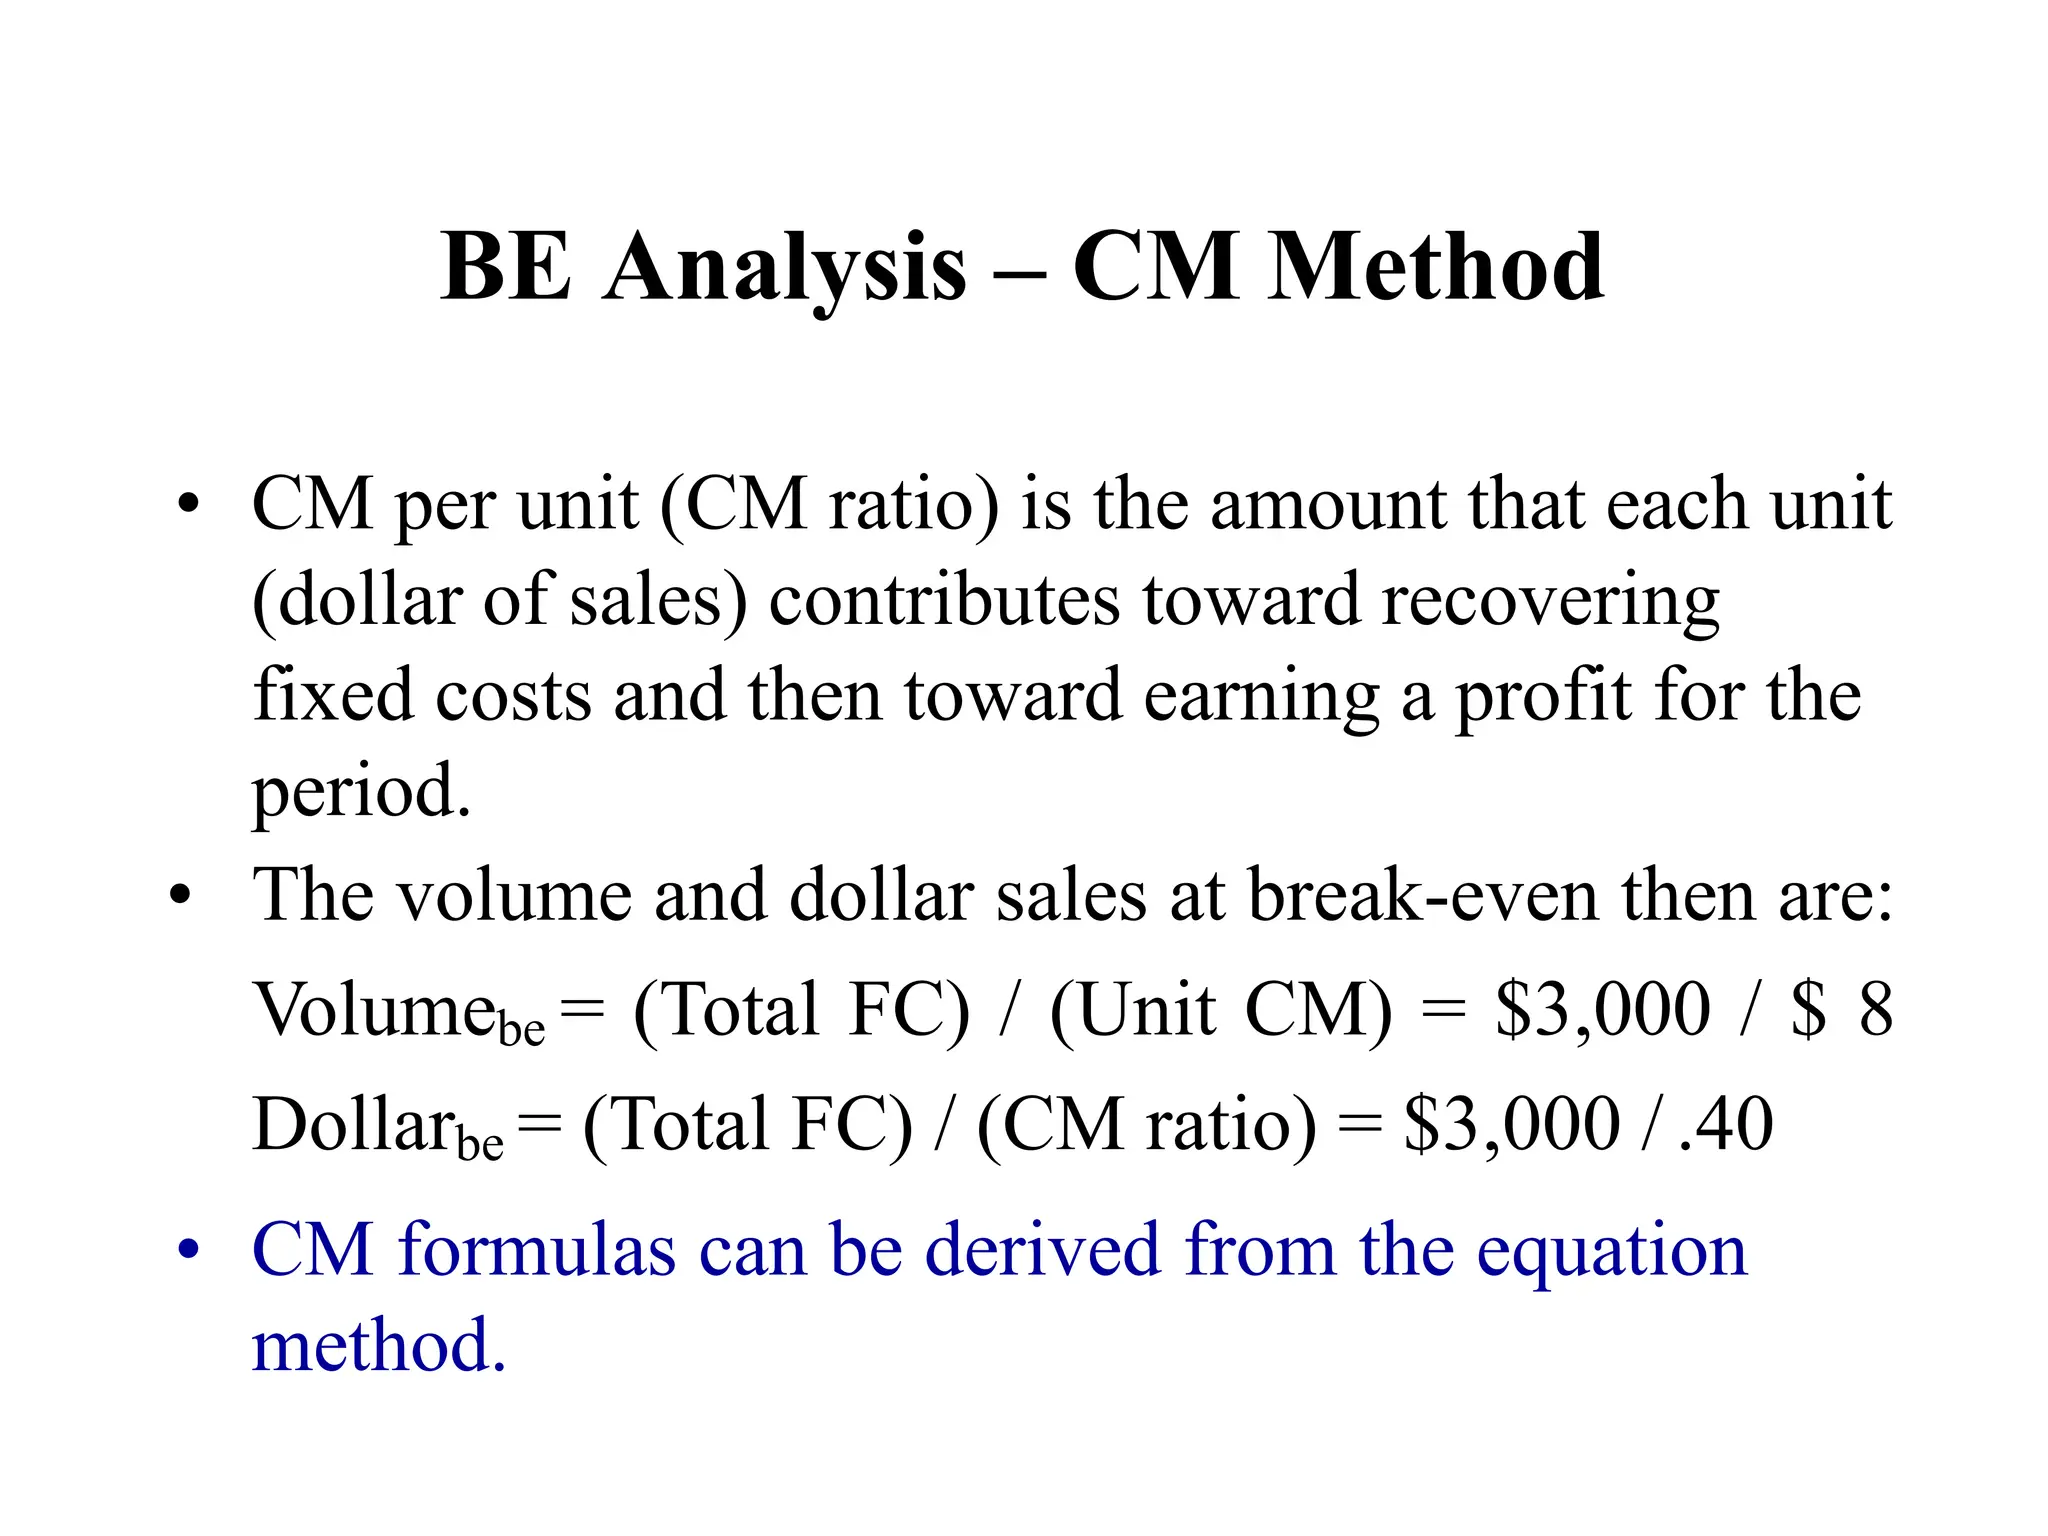
BE Analysis –CM Method
• CM per unit (CM ratio) is the amount that each unit
(dollar of sales) contributes toward recovering
fixed costs and then toward earning a profit for the
period.
• The volume and dollar sales at break-even then are:
Volumebe = (Total FC) / (Unit CM) = $3,000 / $ 8
Dollarbe = (Total FC) / (CM ratio) = $3,000 / .40
• CM formulas can be derived from the equation
method.
Cost-Volume-Profit (CVP) Analysis
•CVP analysis is an analysis of the relationships
among activity level, revenue, costs and profit.
• Classification of cost items into fixed and variable
is paramount in CVP analysis.
• Contribution margin (CM) concept facilitates CVP
analysis.
24.
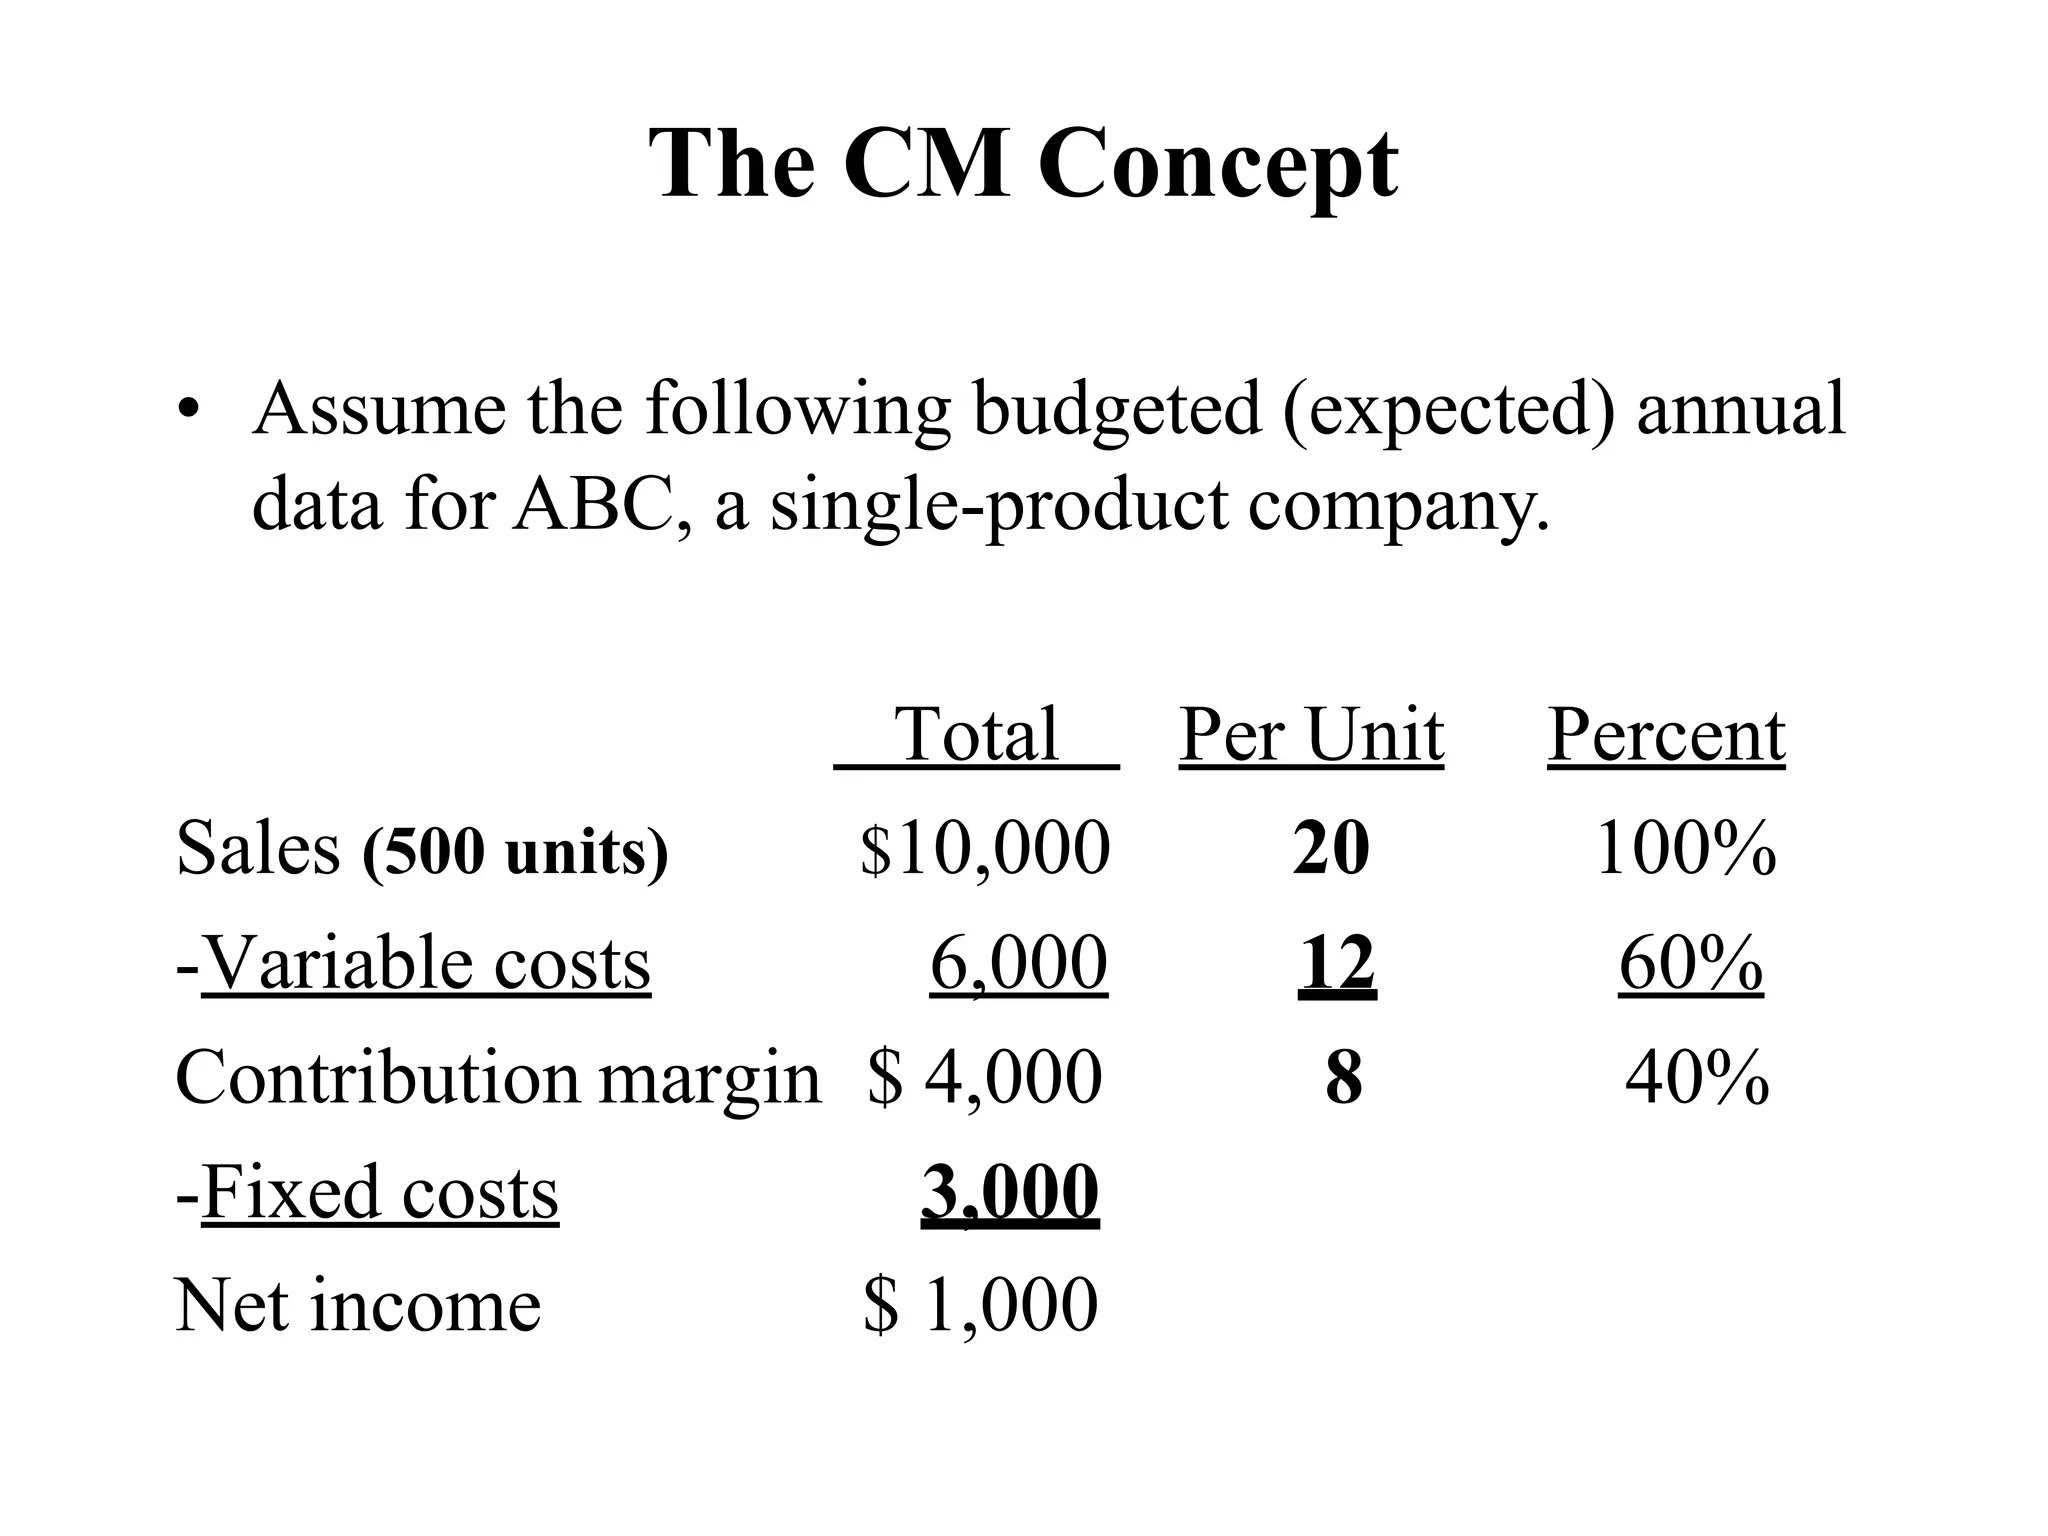
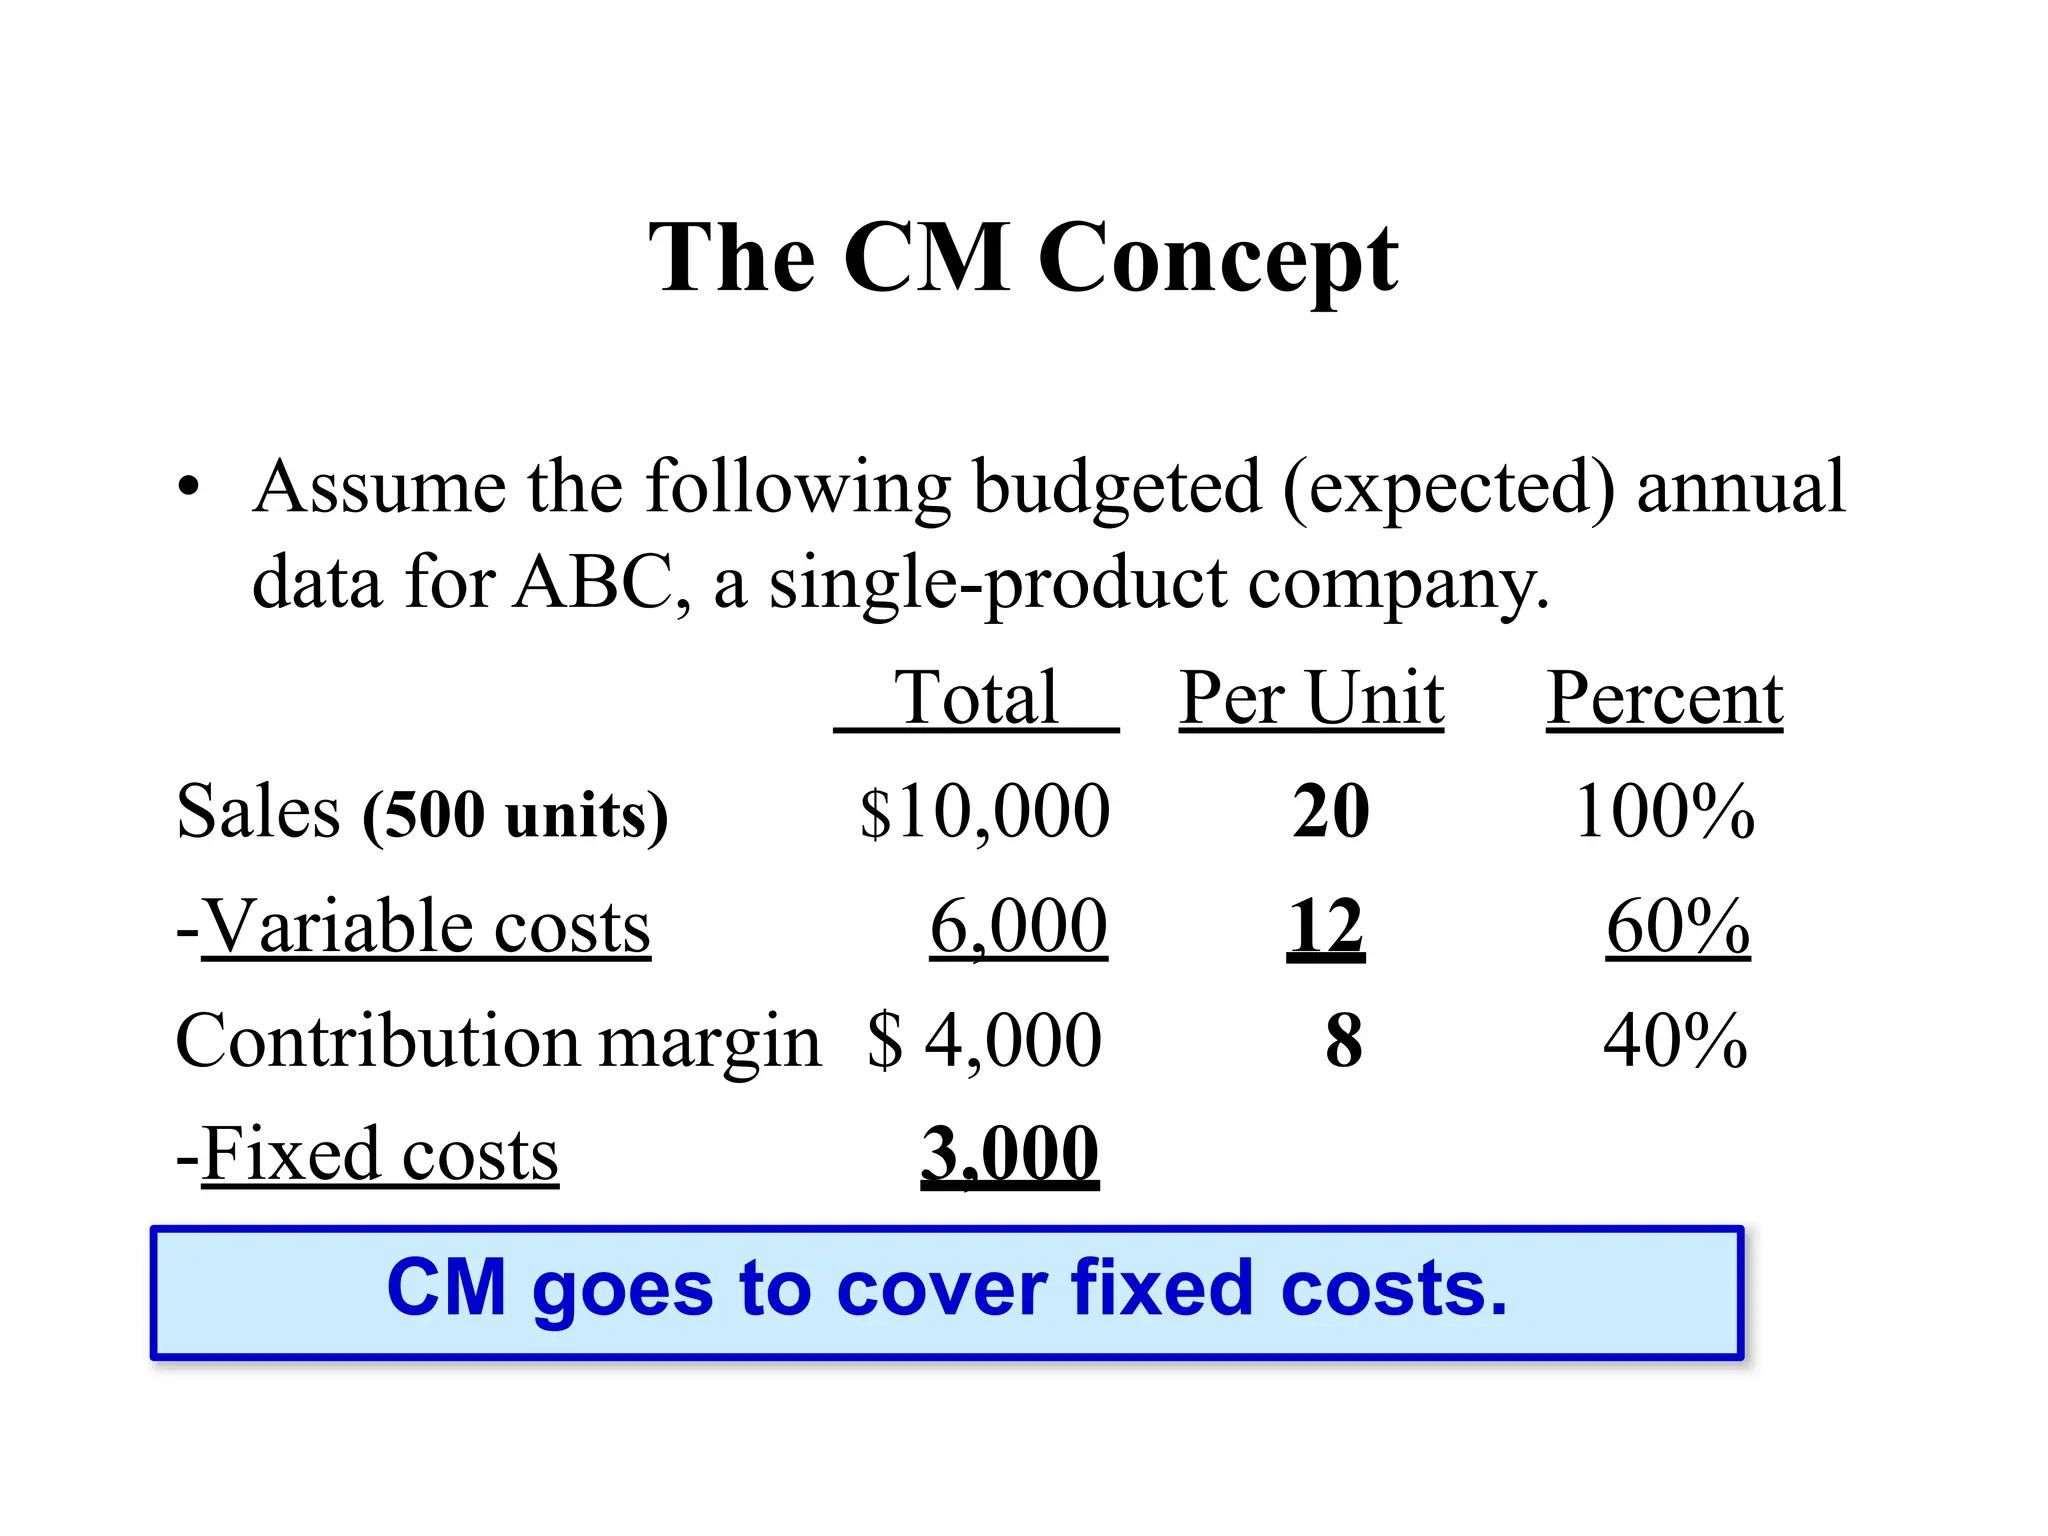
The CM Concept
•Assume the following budgeted (expected) annual
data for ABC, a single-product company.
Total Per Unit Percent
Sales (500 units) $10,000 20 100%
-Variable costs 6,000 12 60%
Contribution margin $ 4,000 8 40%
-Fixed costs 3,000
Net income $ 1,000
25.
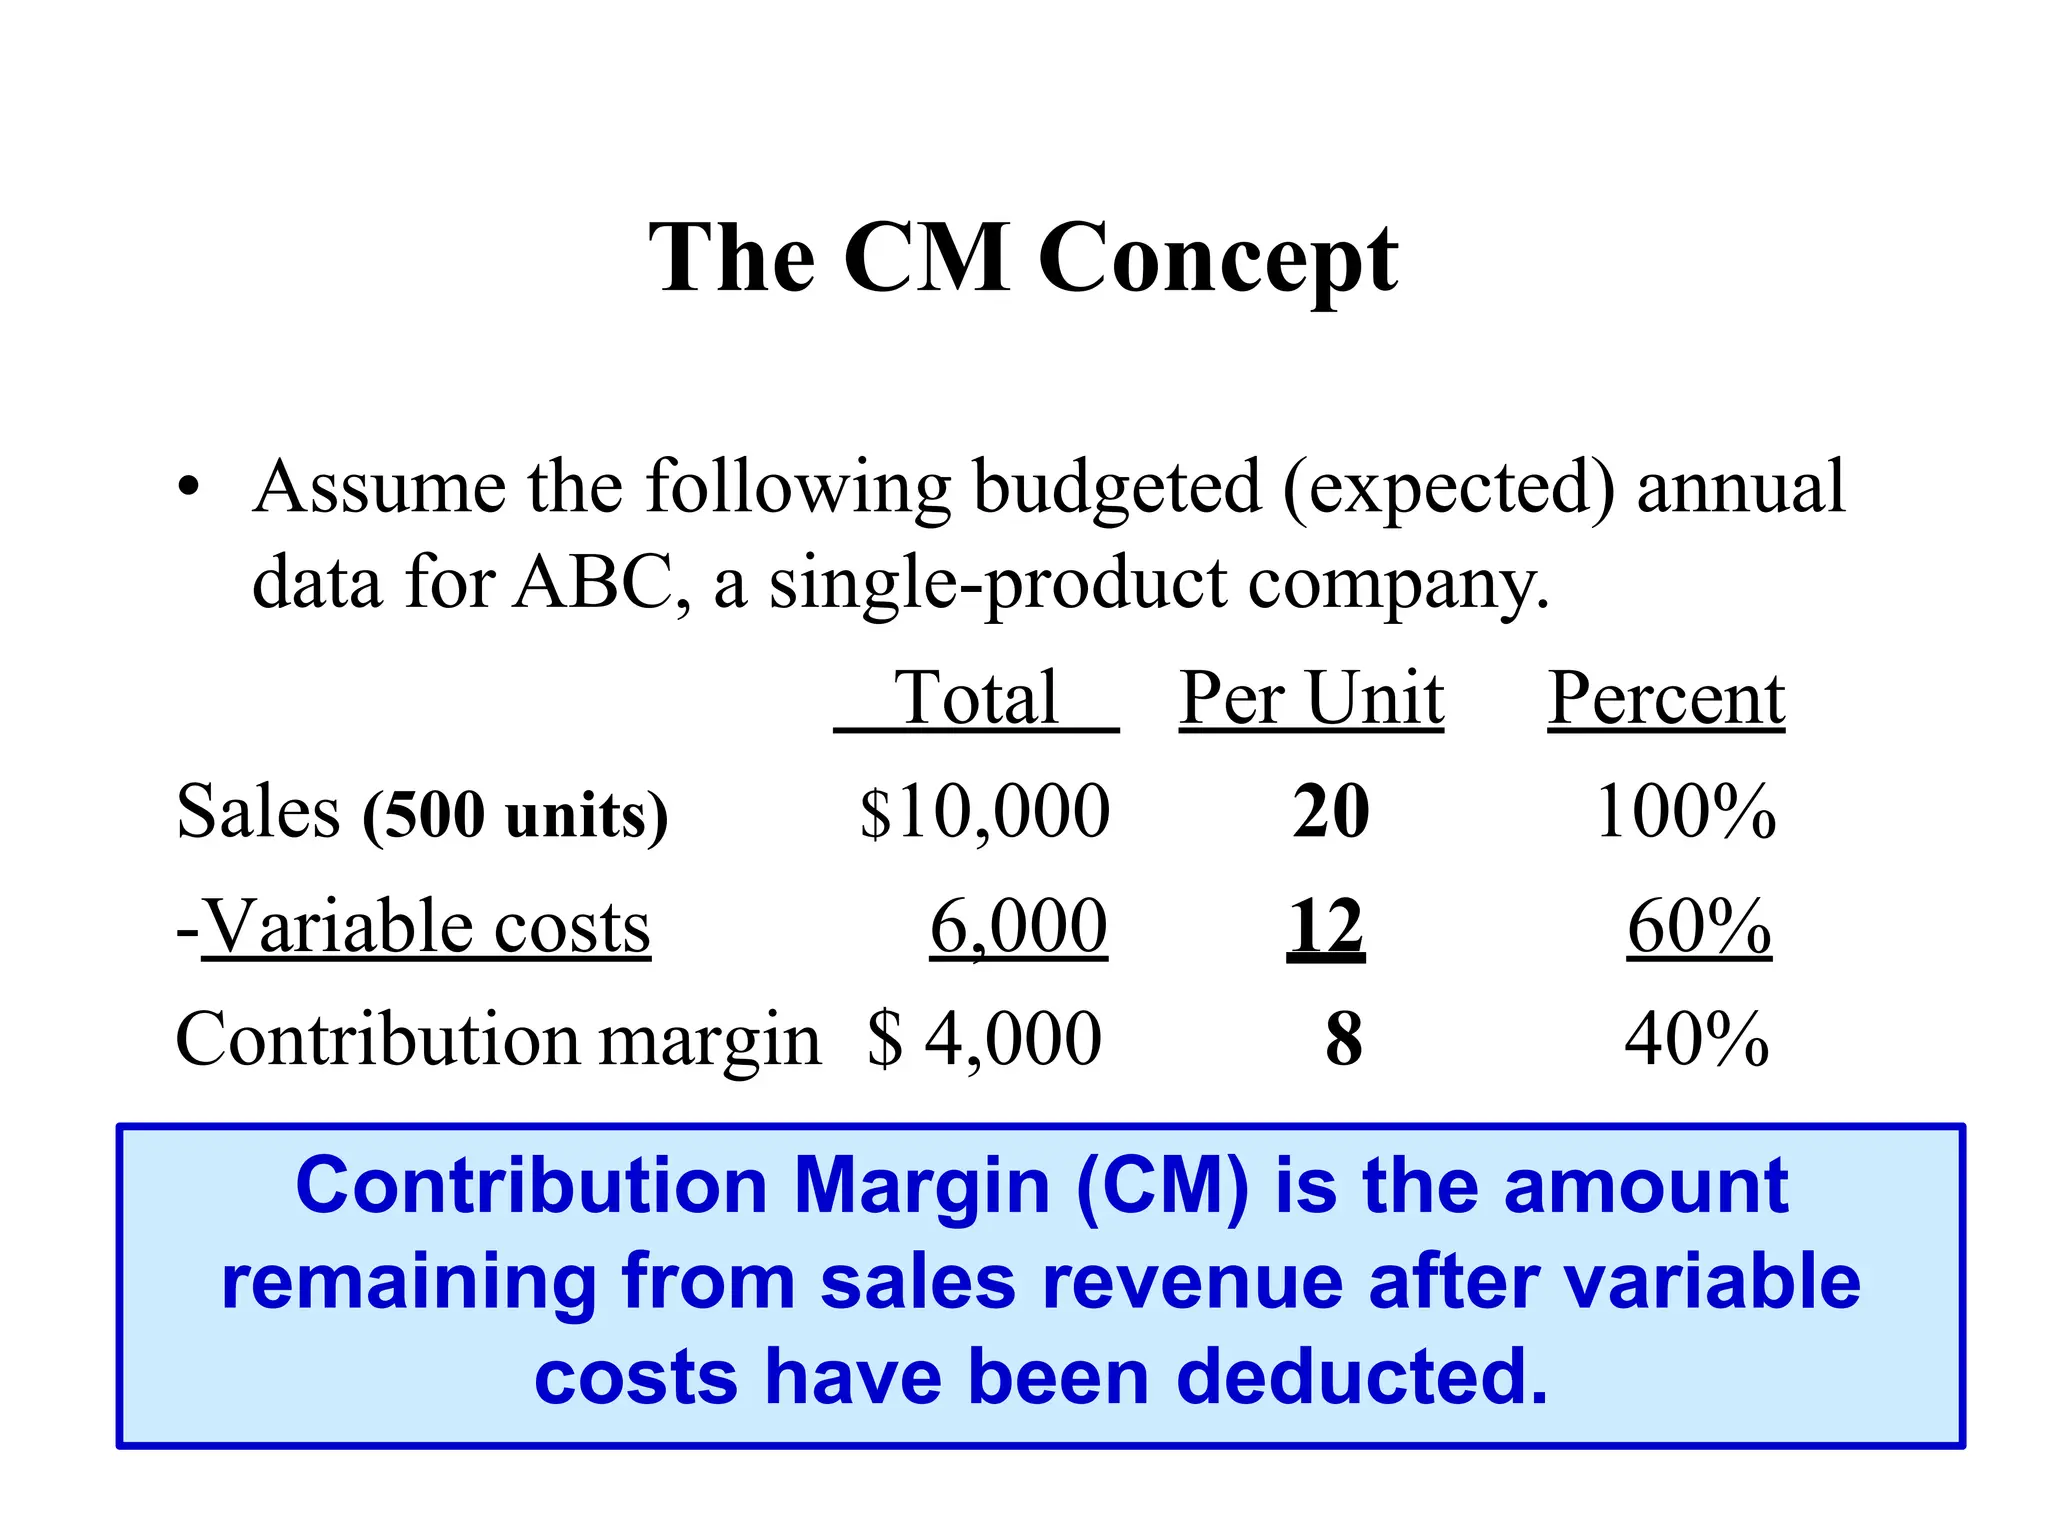
The CM Concept
•Assume the following budgeted (expected) annual
data for ABC, a single-product company.
Total Per Unit Percent
Sales (500 units) $10,000 20 100%
-Variable costs 6,000 12 60%
Contribution margin $ 4,000 8 40%
-Fixed costs 3,000
Net income $ 1,000
Contribution Margin (CM) is the amount
remaining from sales revenue after variable
costs have been deducted.
26.
The CM Concept
•Assume the following budgeted (expected) annual
data for ABC, a single-product company.
Total Per Unit Percent
Sales (500 units) $10,000 20 100%
-Variable costs 6,000 12 60%
Contribution margin $ 4,000 8 40%
-Fixed costs 3,000
Net income $ 1,000
CM goes to cover fixed costs.
27.
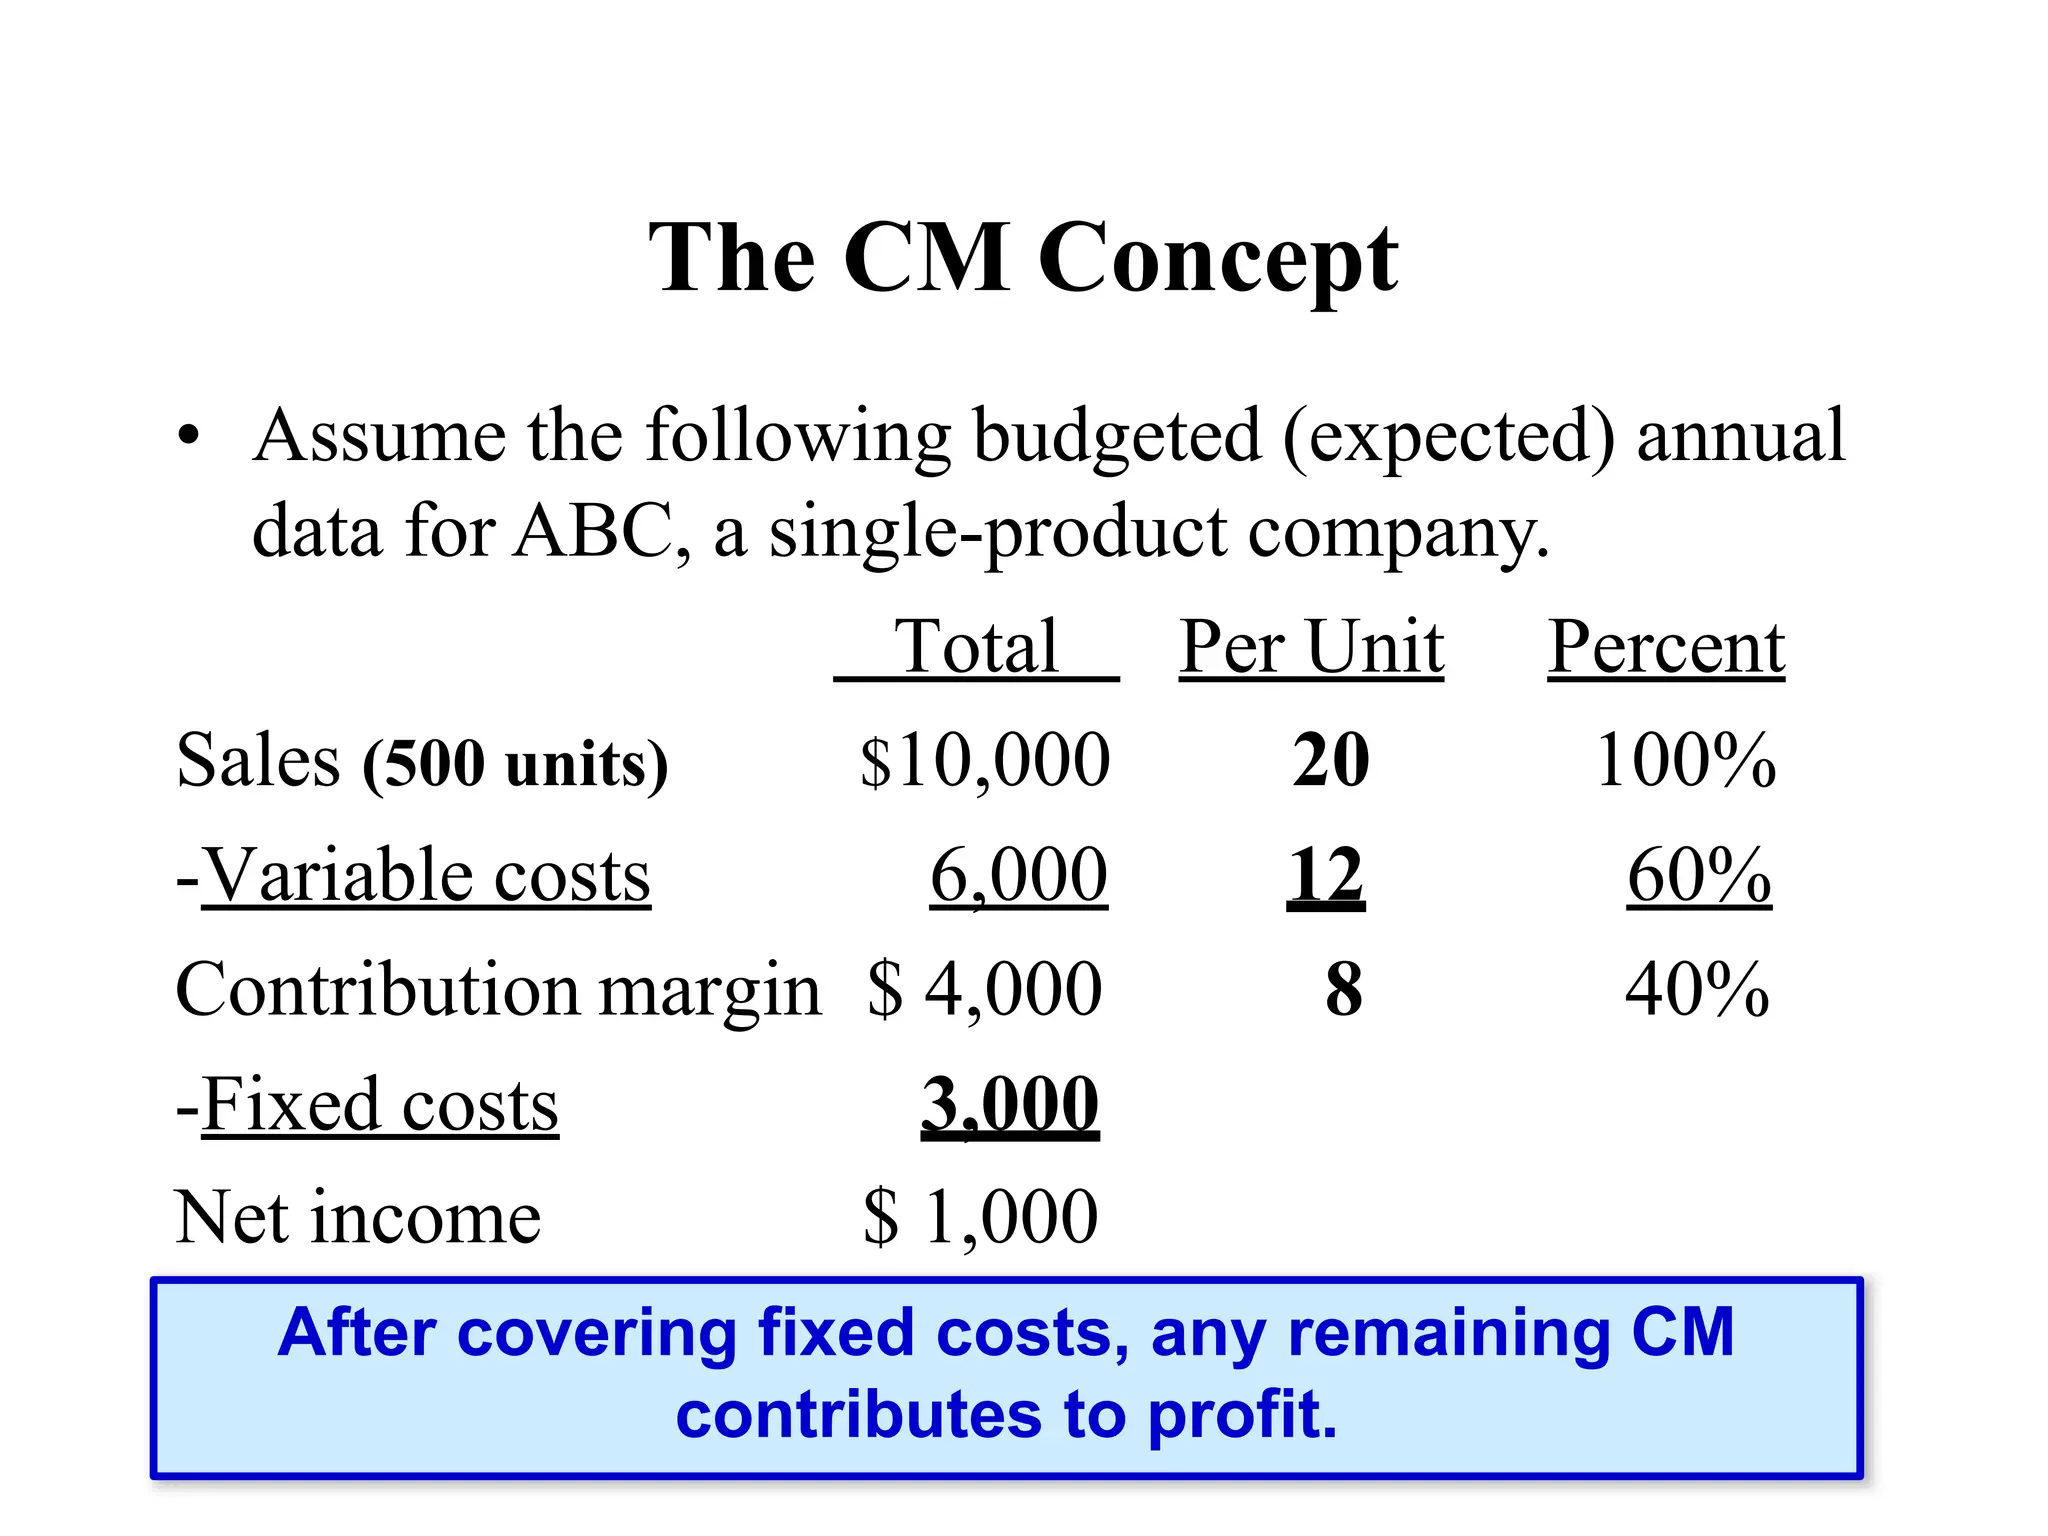
The CM Concept
•Assume the following budgeted (expected) annual
data for ABC, a single-product company.
Total Per Unit Percent
Sales (500 units) $10,000 20 100%
-Variable costs 6,000 12 60%
Contribution margin $ 4,000 8 40%
-Fixed costs 3,000
Net income $ 1,000
After covering fixed costs, any remaining CM
contributes to profit.
28.
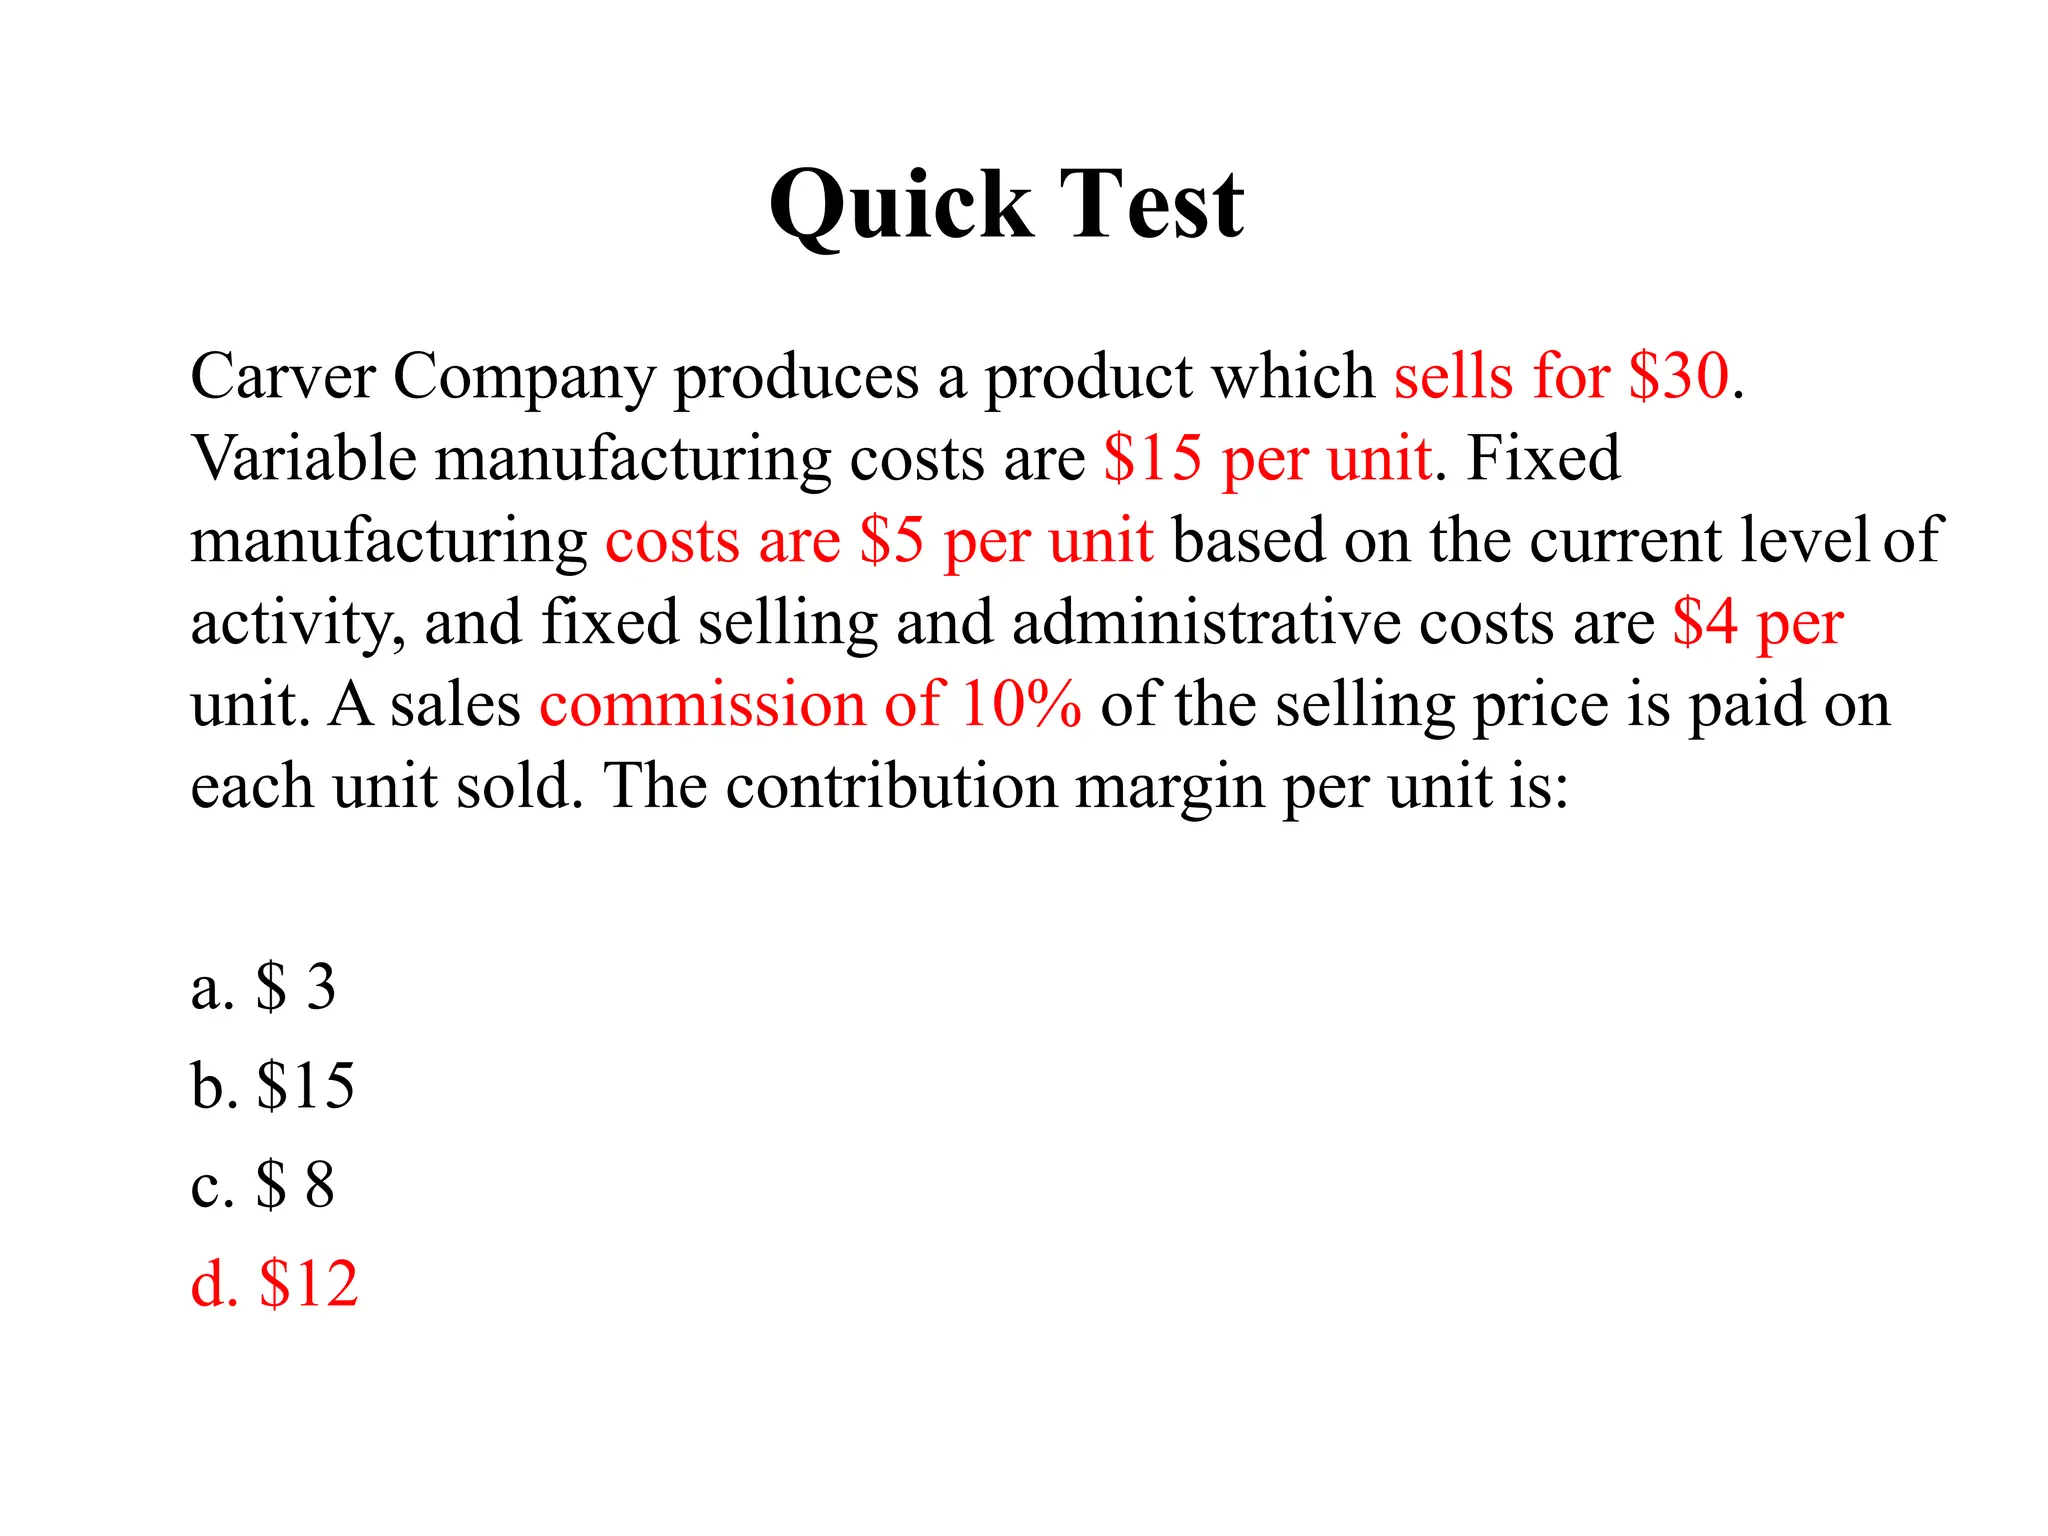
Quick Test
Carver Companyproduces a product which sells for $30.
Variable manufacturing costs are $15 per unit. Fixed
manufacturing costs are $5 per unit based on the current level of
activity, and fixed selling and administrative costs are $4 per
unit. A sales commission of 10% of the selling price is paid on
each unit sold. The contribution margin per unit is:
a. $ 3
b. $15
c. $ 8
d. $12
29.
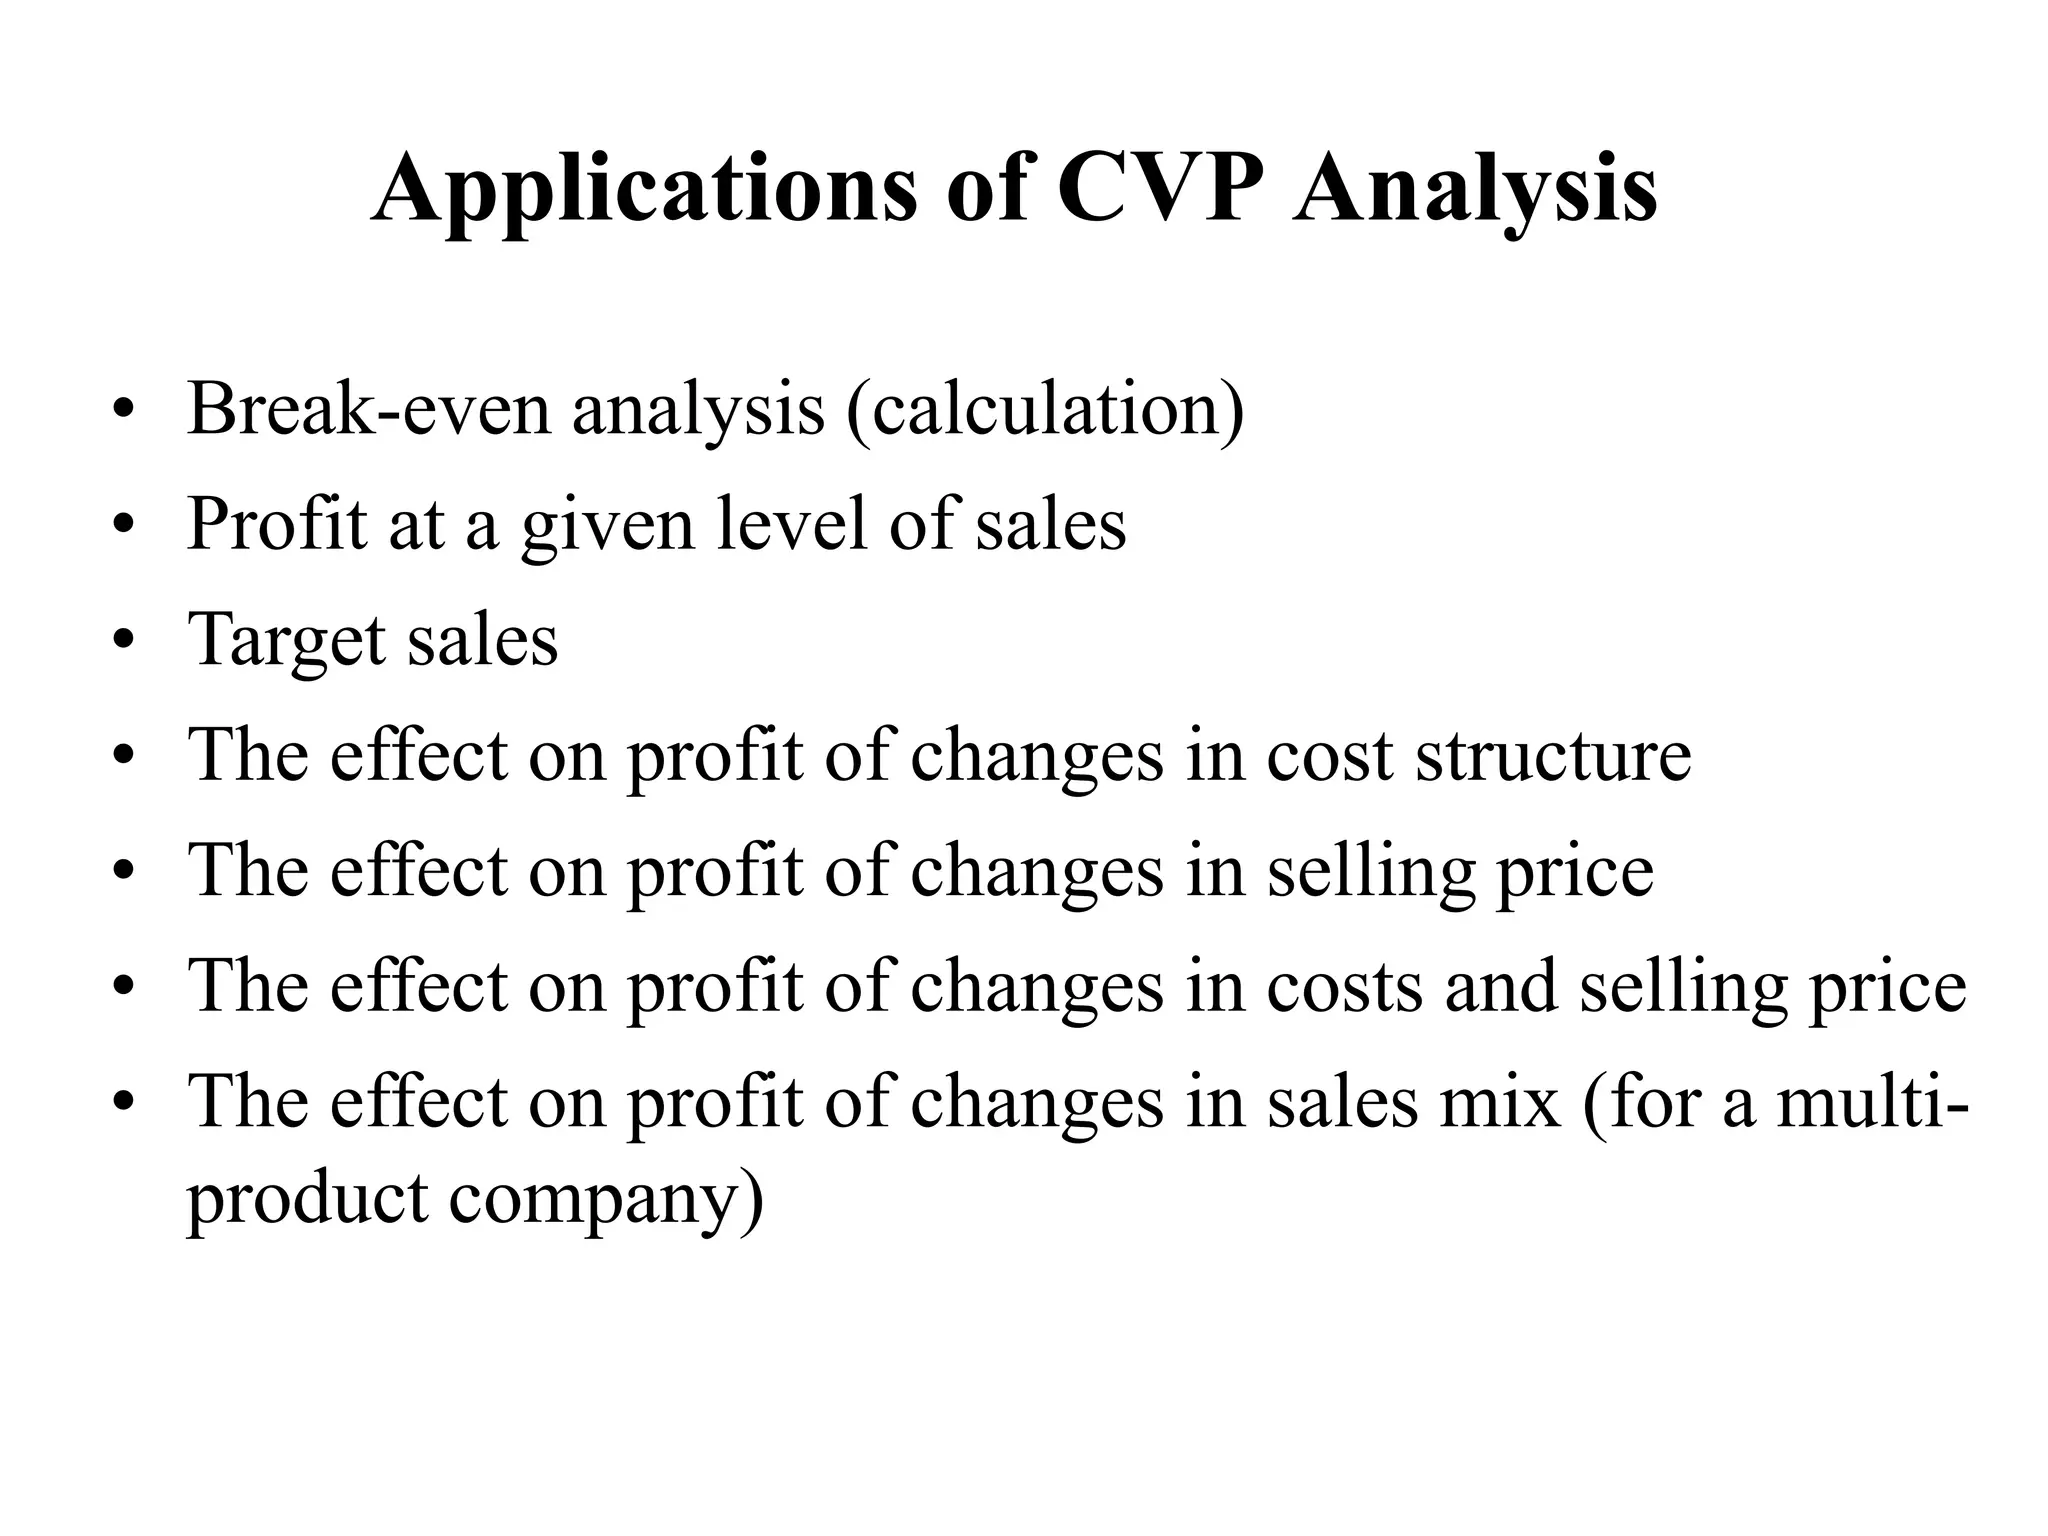
Applications of CVPAnalysis
• Break-even analysis (calculation)
• Profit at a given level of sales
• Target sales
• The effect on profit of changes in cost structure
• The effect on profit of changes in selling price
• The effect on profit of changes in costs and selling price
• The effect on profit of changes in sales mix (for a multi-
product company)
30.
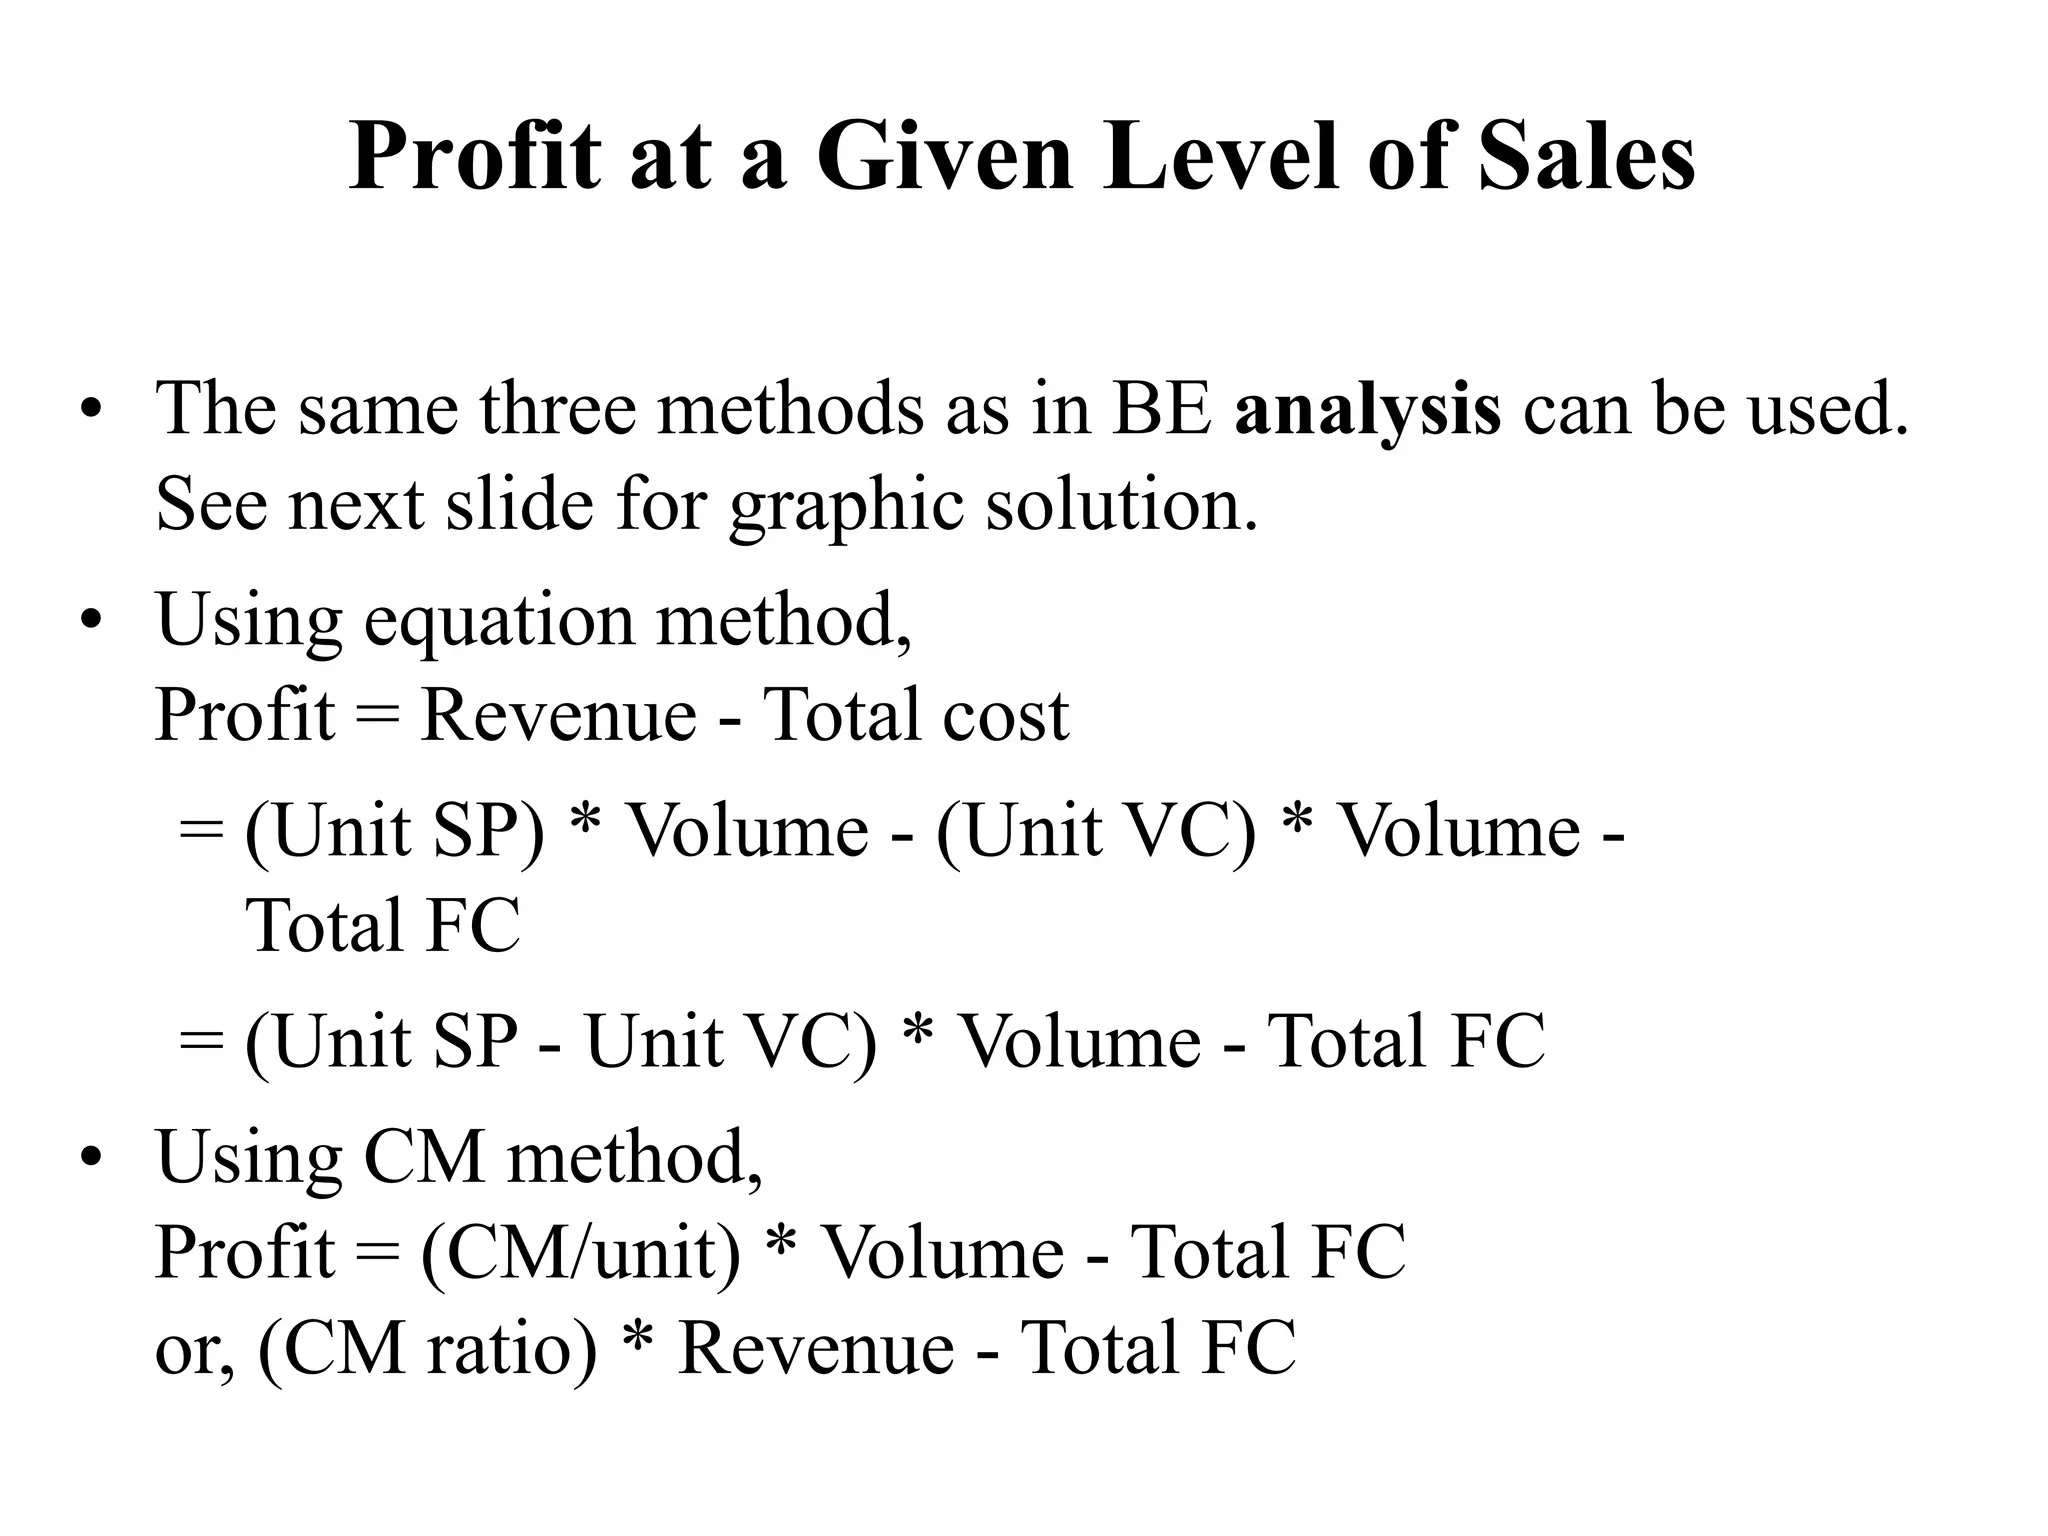
Profit at aGiven Level of Sales
• The same three methods as in BE analysis can be used.
See next slide for graphic solution.
• Using equation method,
Profit = Revenue - Total cost
= (Unit SP) * Volume - (Unit VC) * Volume -
Total FC
= (Unit SP - Unit VC) * Volume - Total FC
• Using CM method,
Profit = (CM/unit) * Volume - Total FC
or, (CM ratio) * Revenue - Total FC
31.
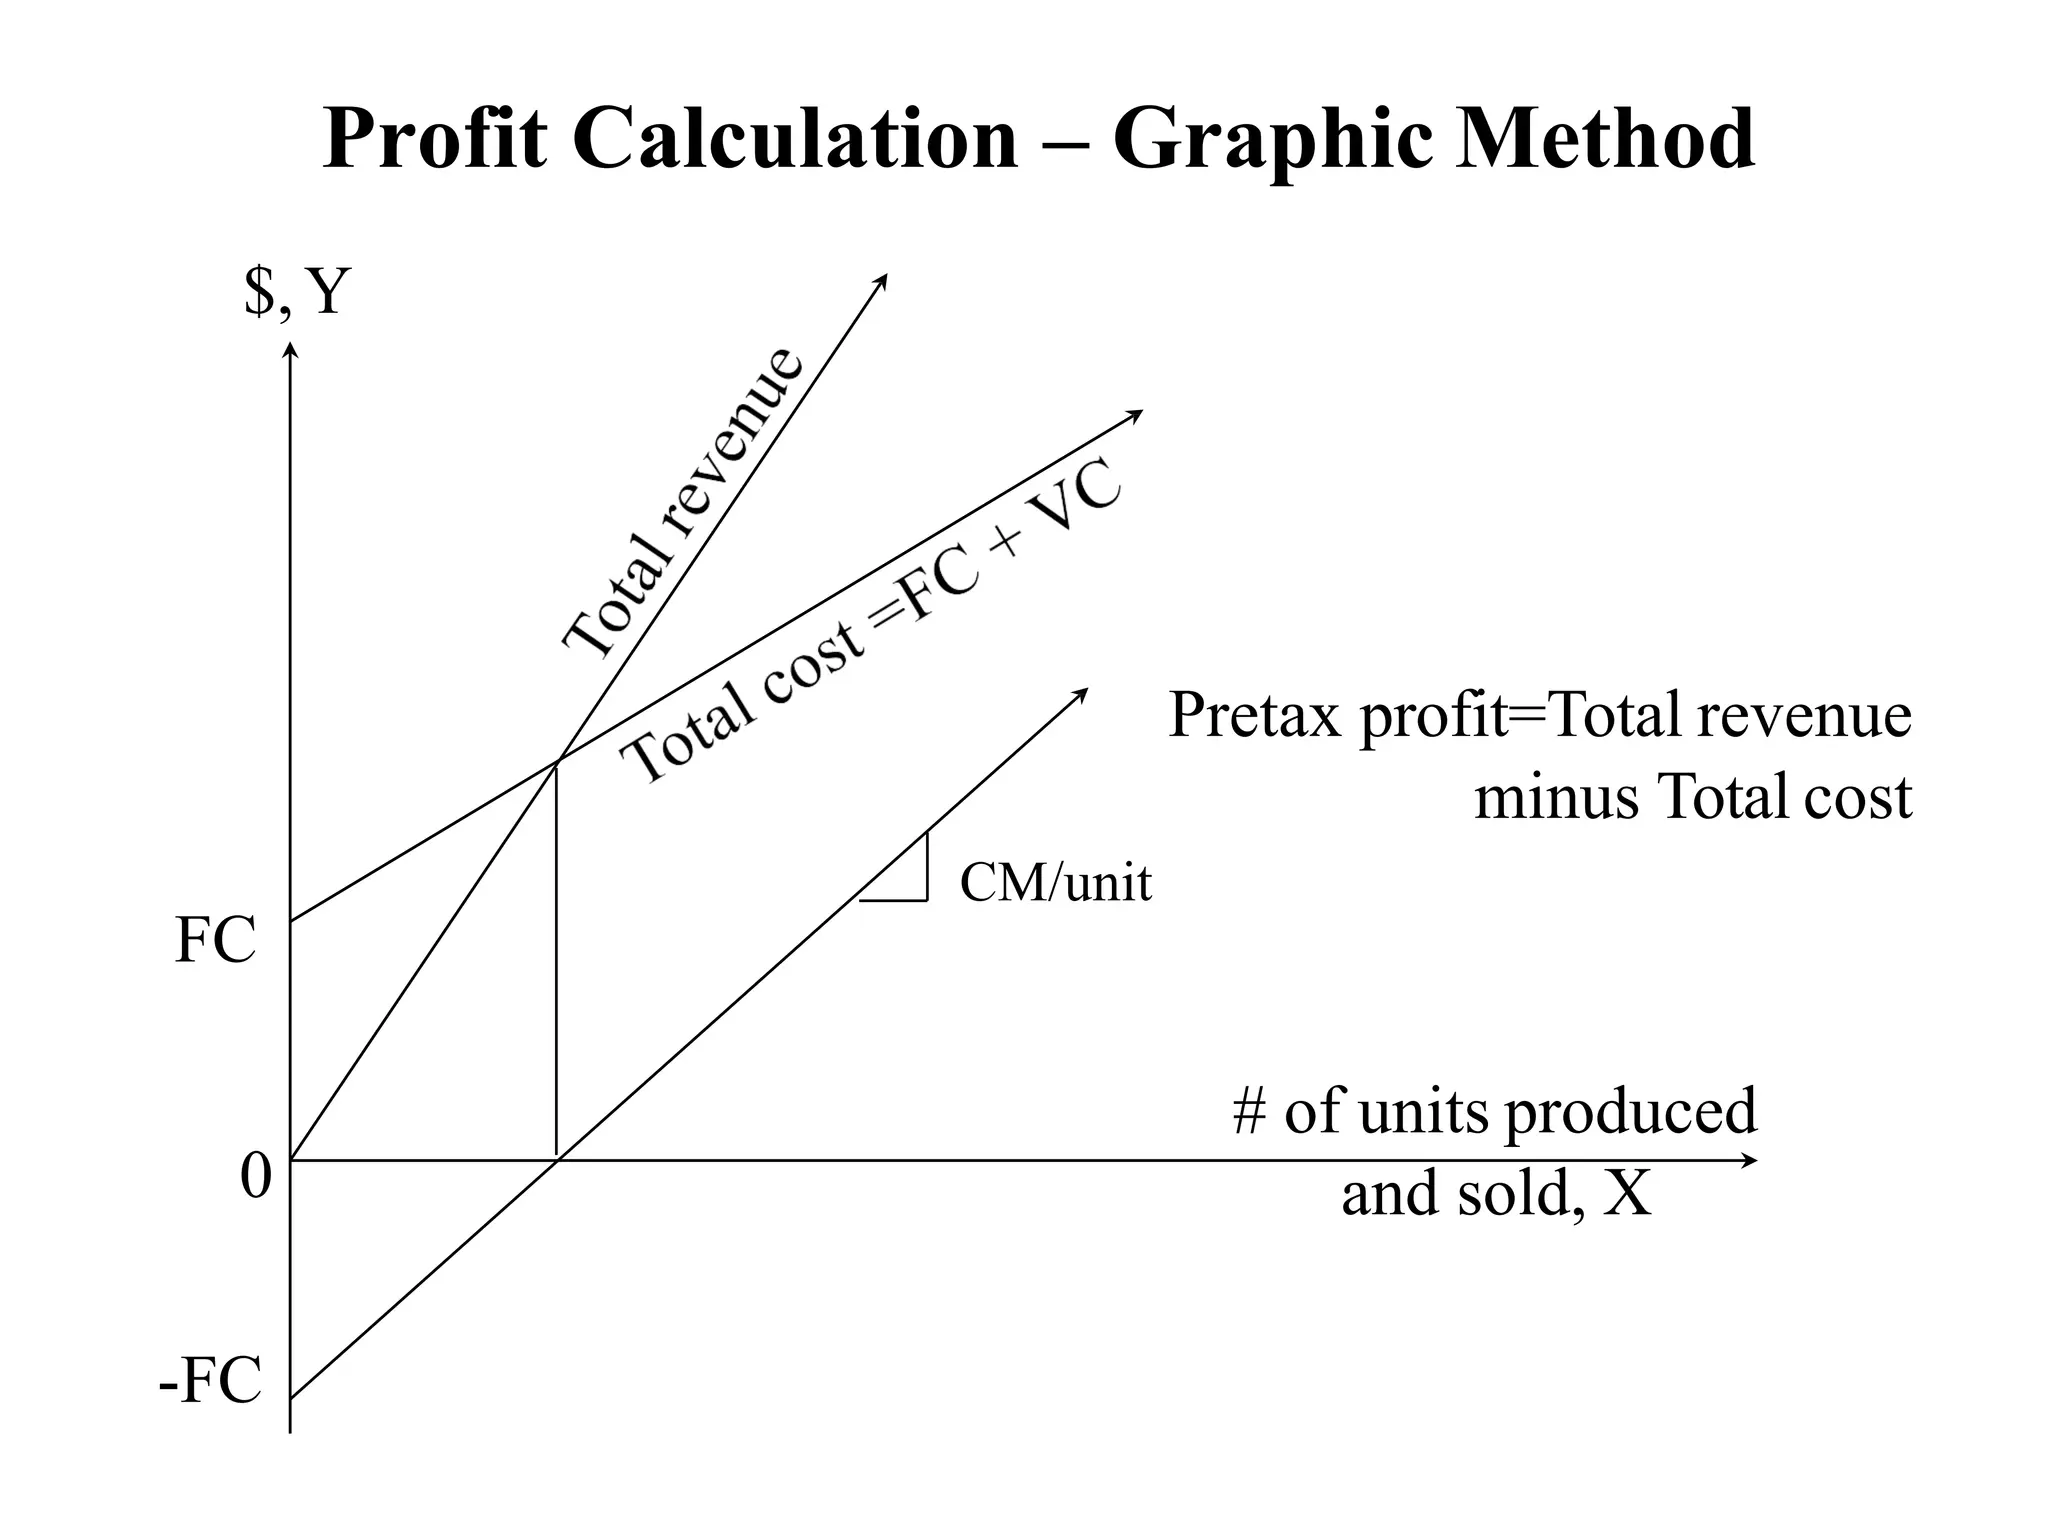
Profit Calculation –Graphic Method
# of units produced
and sold, X
$,Y
0
FC
-FC
Pretax profit=Total revenue
minus Total cost
CM/unit
32.
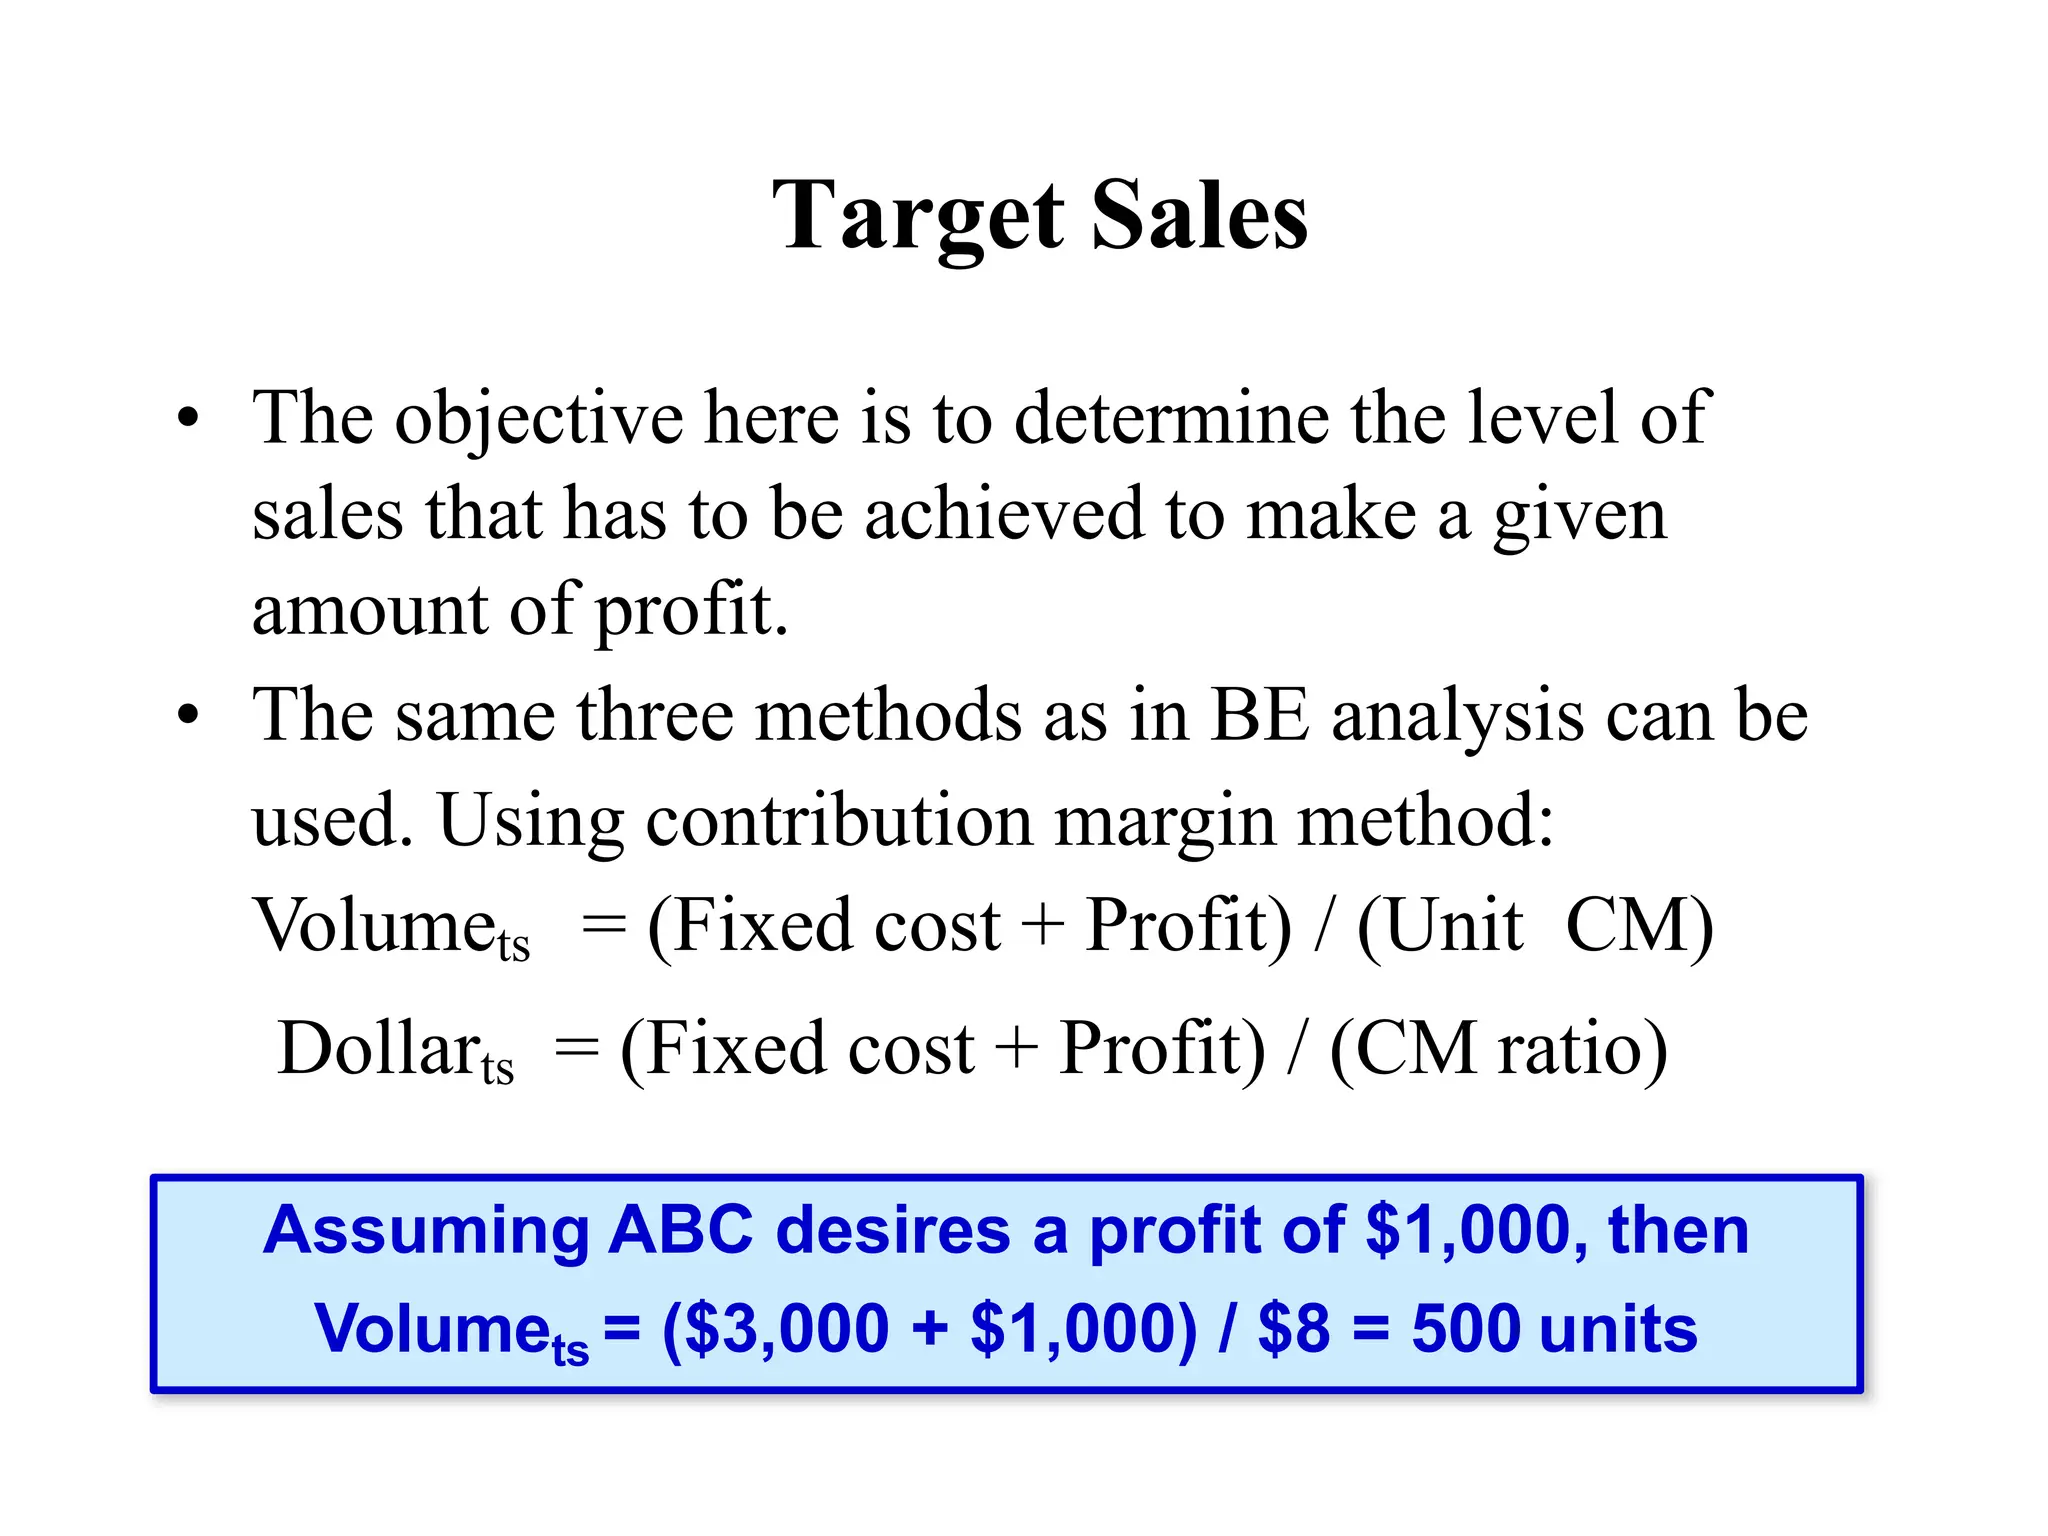
Target Sales
• Theobjective here is to determine the level of
sales that has to be achieved to make a given
amount of profit.
• The same three methods as in BE analysis can be
used. Using contribution margin method:
Volumets = (Fixed cost + Profit) / (Unit CM)
Dollarts = (Fixed cost + Profit) / (CM ratio)
Assuming ABC desires a profit of $1,000, then
Volumets = ($3,000 + $1,000) / $8 = 500 units
33.
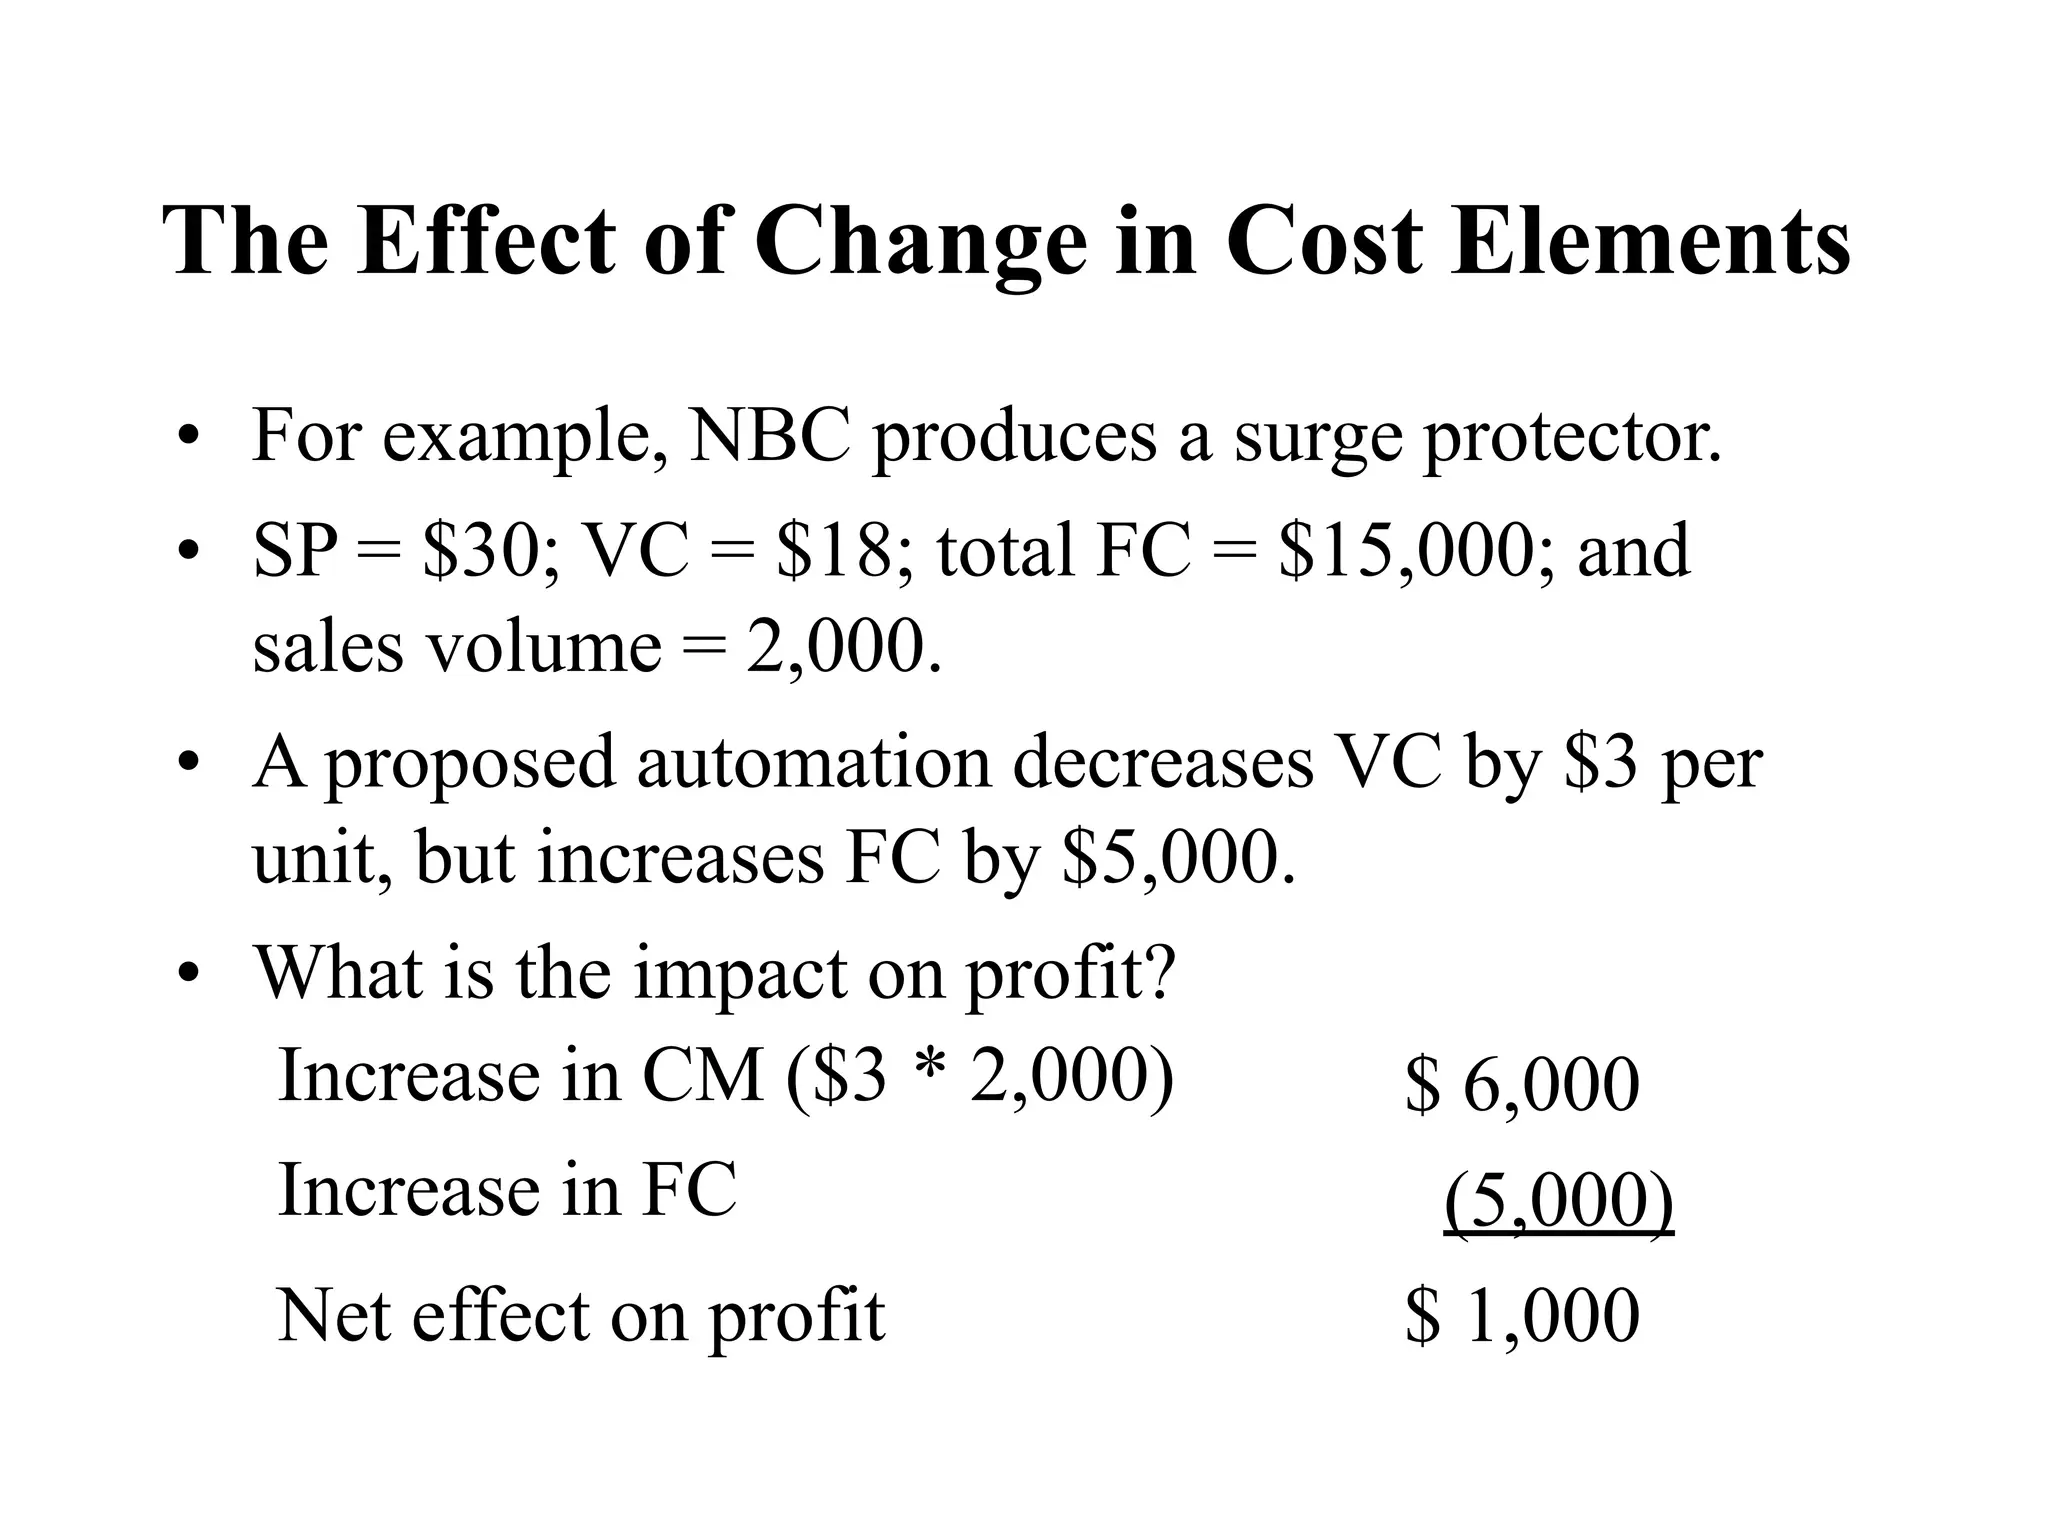
The Effect ofChange in Cost Elements
• For example, NBC produces a surge protector.
• SP = $30; VC = $18; total FC = $15,000; and
sales volume = 2,000.
• A proposed automation decreases VC by $3 per
unit, but increases FC by $5,000.
• What is the impact on profit?
Increase in CM ($3 * 2,000)
Increase in FC
Net effect on profit
$ 6,000
(5,000)
$ 1,000
34.
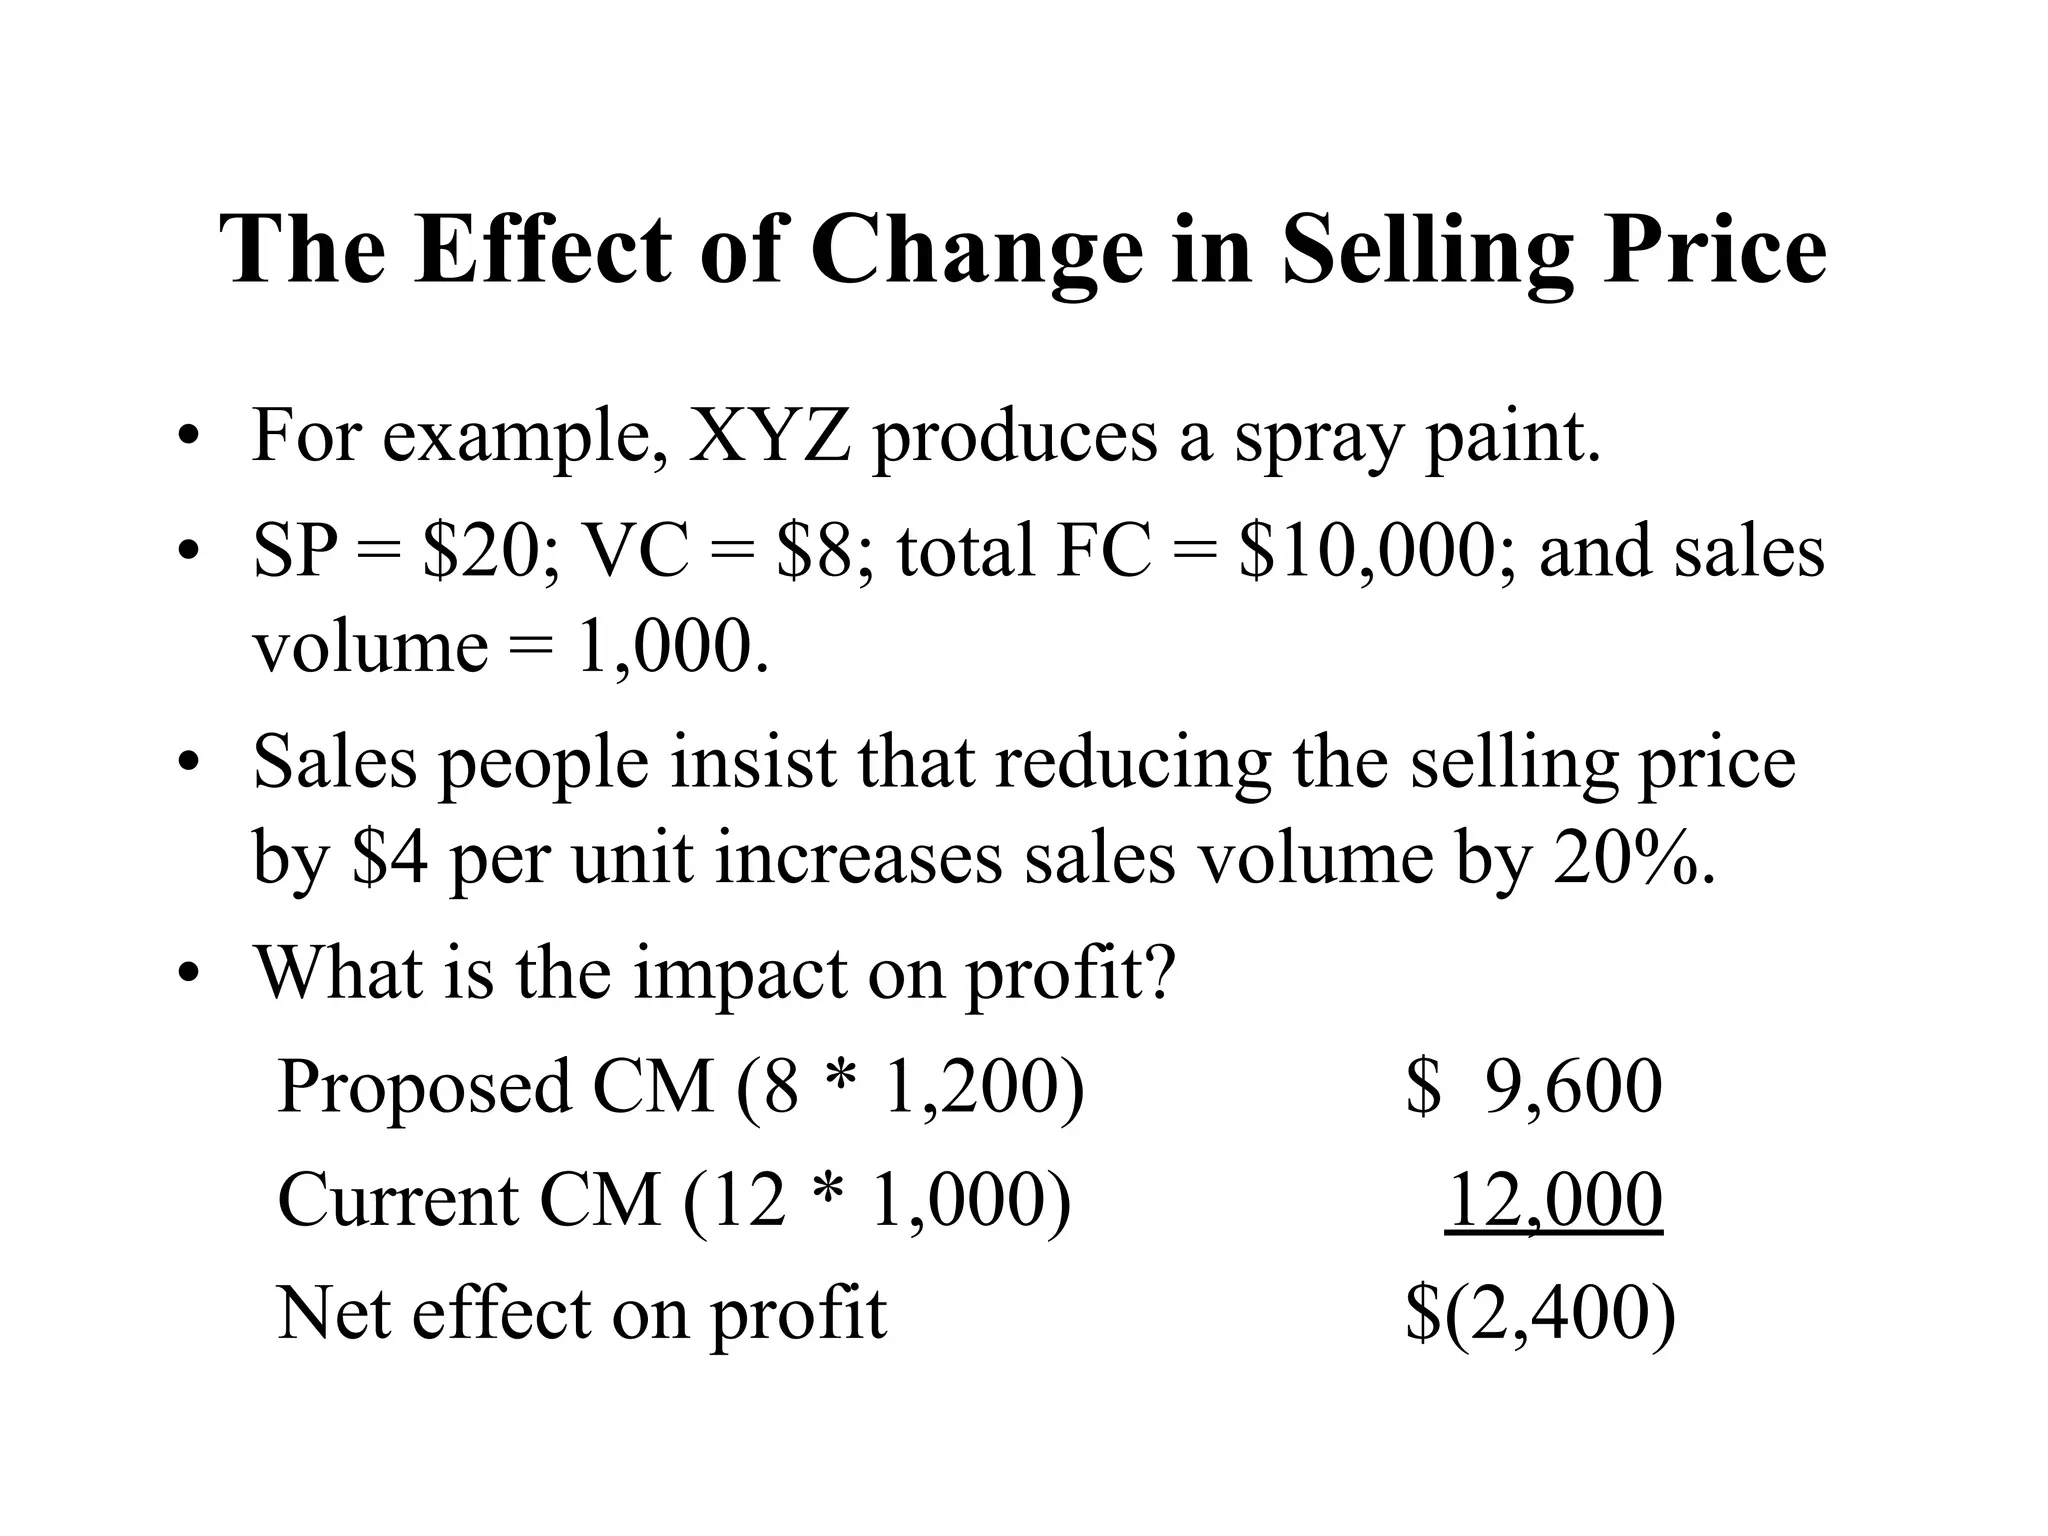
The Effect ofChange in Selling Price
• For example, XYZ produces a spray paint.
• SP = $20; VC = $8; total FC = $10,000; and sales
volume = 1,000.
• Sales people insist that reducing the selling price
by $4 per unit increases sales volume by 20%.
• What is the impact on profit?
Proposed CM (8 * 1,200) $ 9,600
Current CM (12 * 1,000) 12,000
Net effect on profit $(2,400)
35.
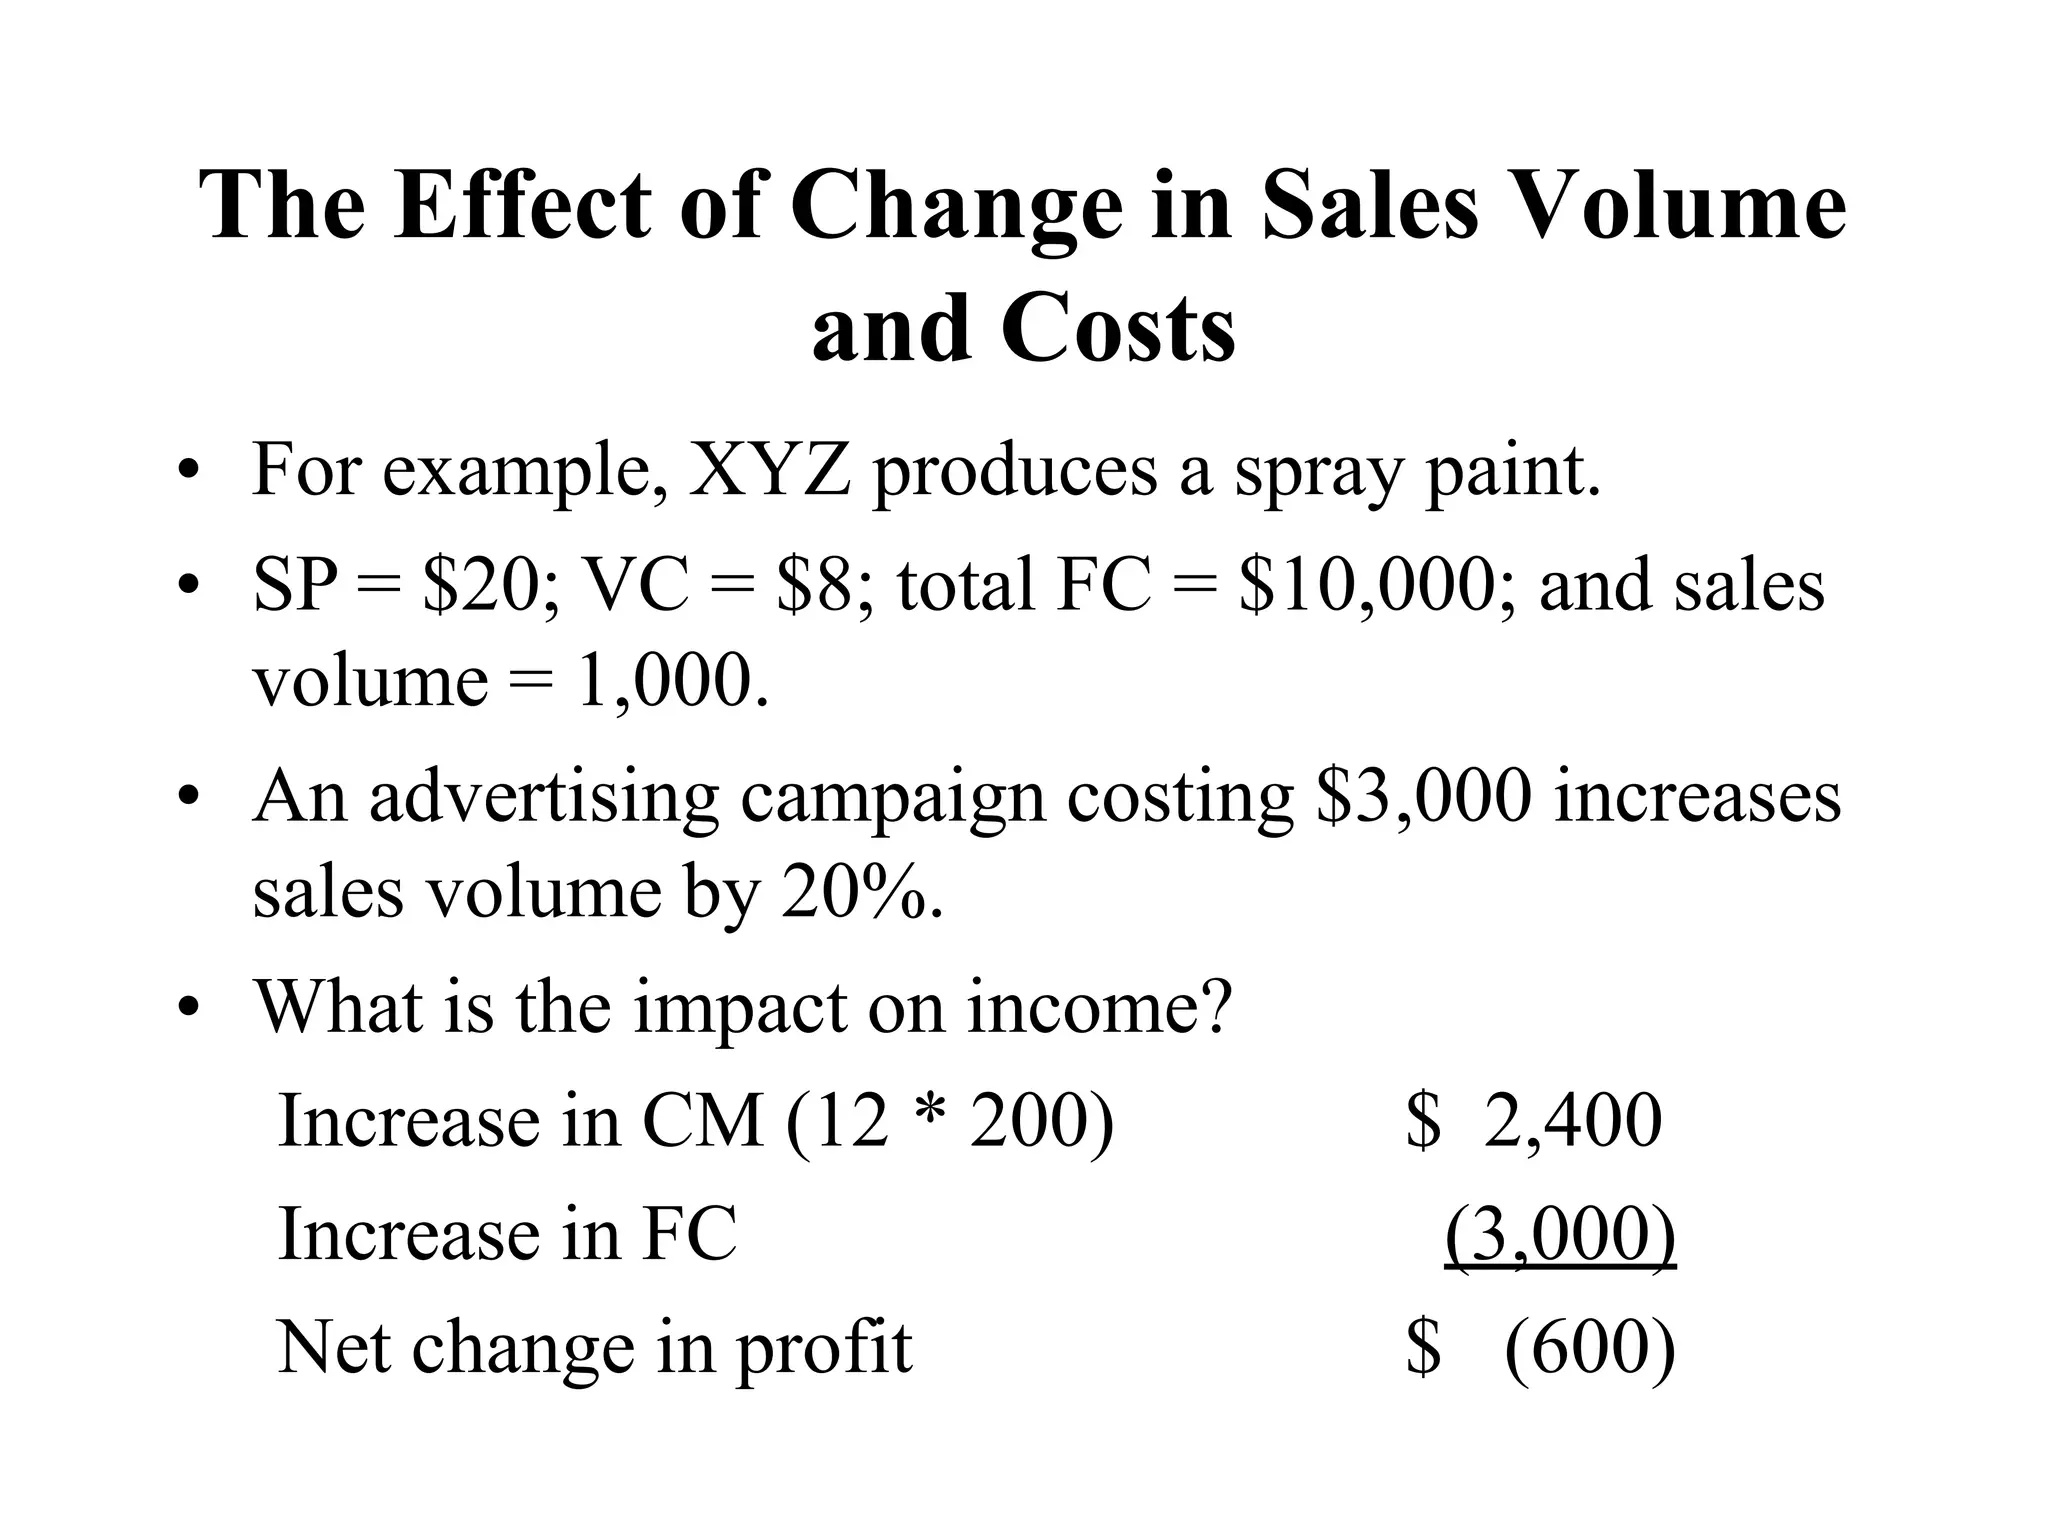
The Effect ofChange in Sales Volume
and Costs
• For example, XYZ produces a spray paint.
• SP = $20; VC = $8; total FC = $10,000; and sales
volume = 1,000.
• An advertising campaign costing $3,000 increases
sales volume by 20%.
• What is the impact on income?
Increase in CM (12 * 200) $ 2,400
Increase in FC (3,000)
Net change in profit $ (600)
36.
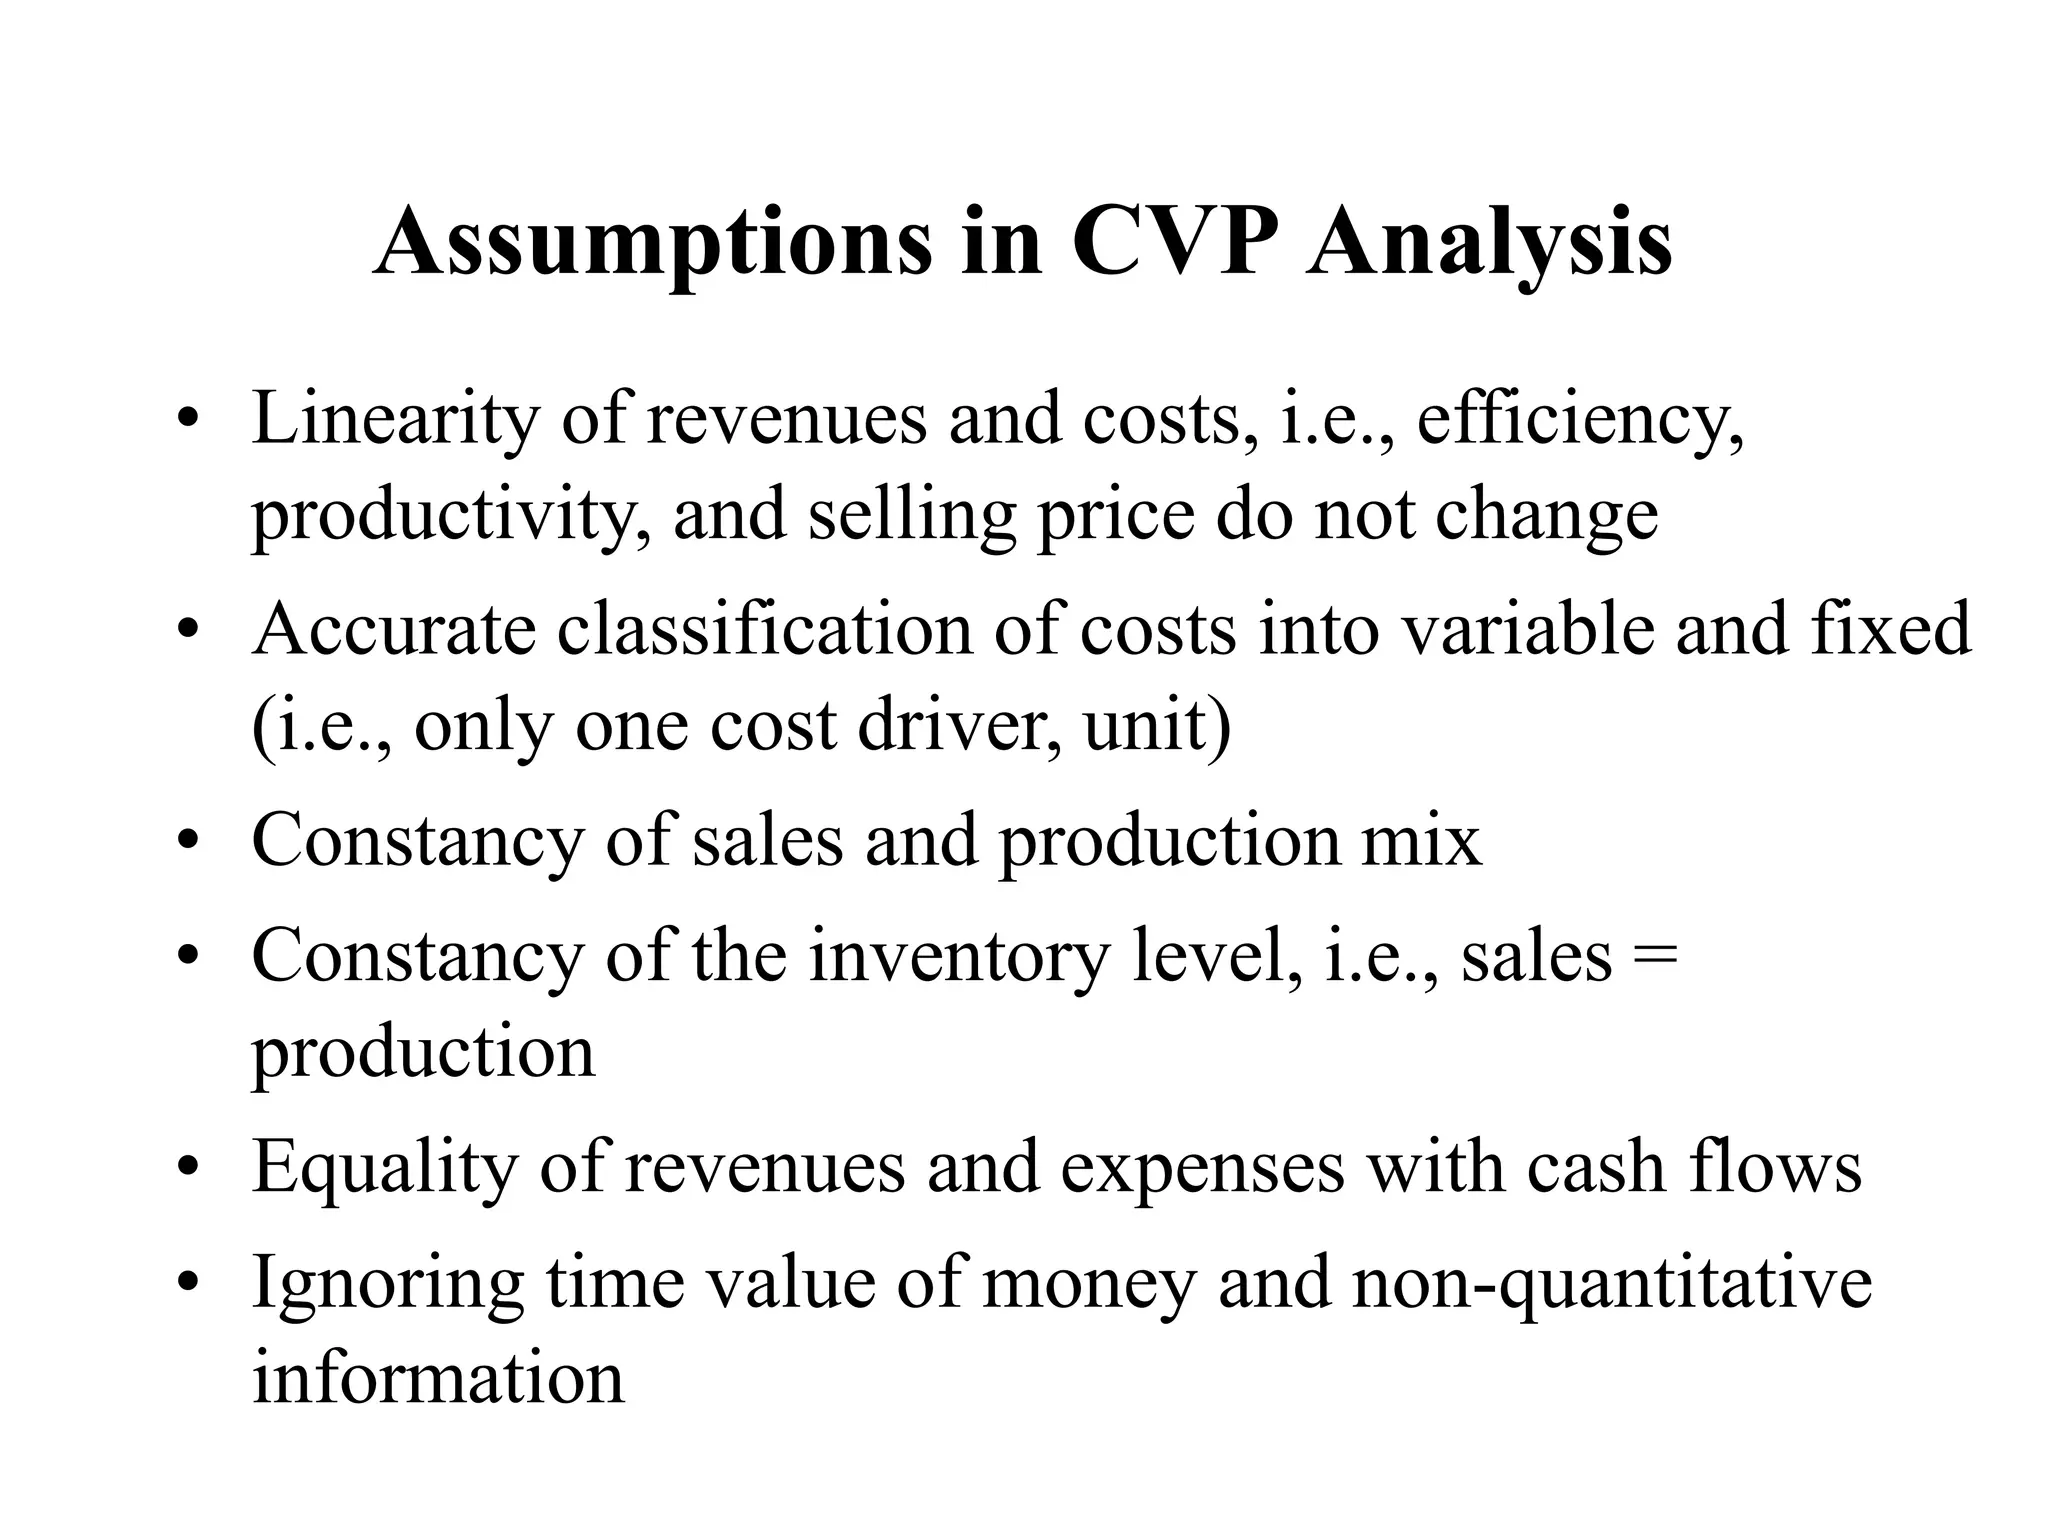
Assumptions in CVPAnalysis
• Linearity of revenues and costs, i.e., efficiency,
productivity, and selling price do not change
• Accurate classification of costs into variable and fixed
(i.e., only one cost driver, unit)
• Constancy of sales and production mix
• Constancy of the inventory level, i.e., sales =
production
• Equality of revenues and expenses with cash flows
• Ignoring time value of money and non-quantitative
information
37.
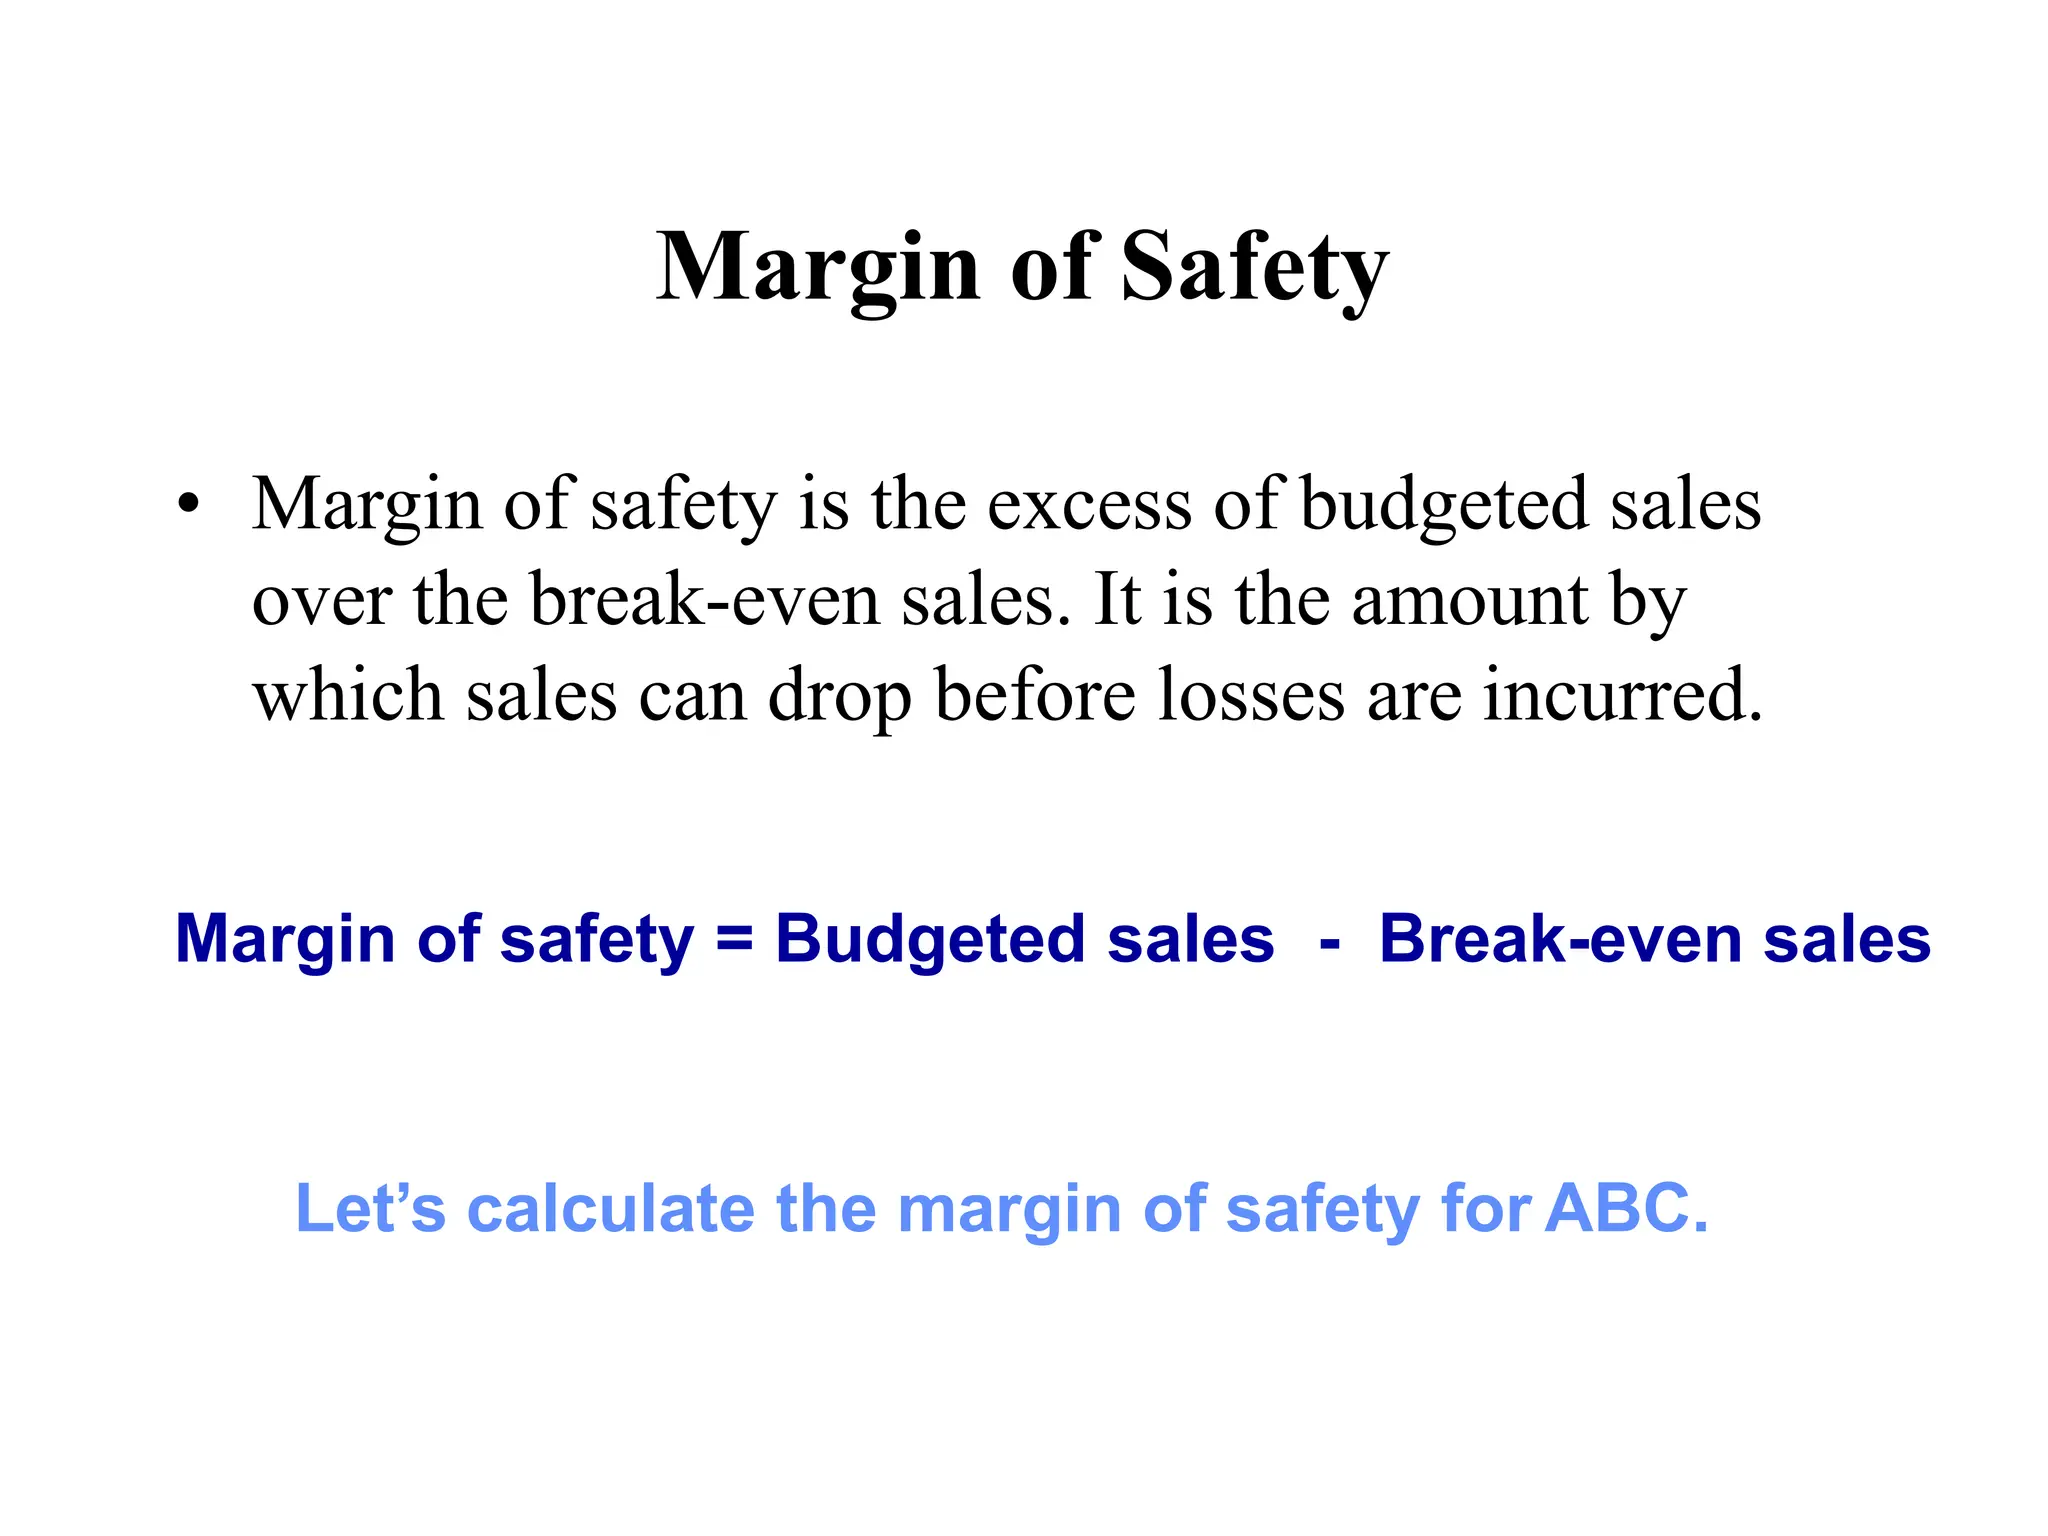
Margin of Safety
•Margin of safety is the excess of budgeted sales
over the break-even sales. It is the amount by
which sales can drop before losses are incurred.
Margin of safety = Budgeted sales - Break-even sales
Let’s calculate the margin of safety for ABC.
38.
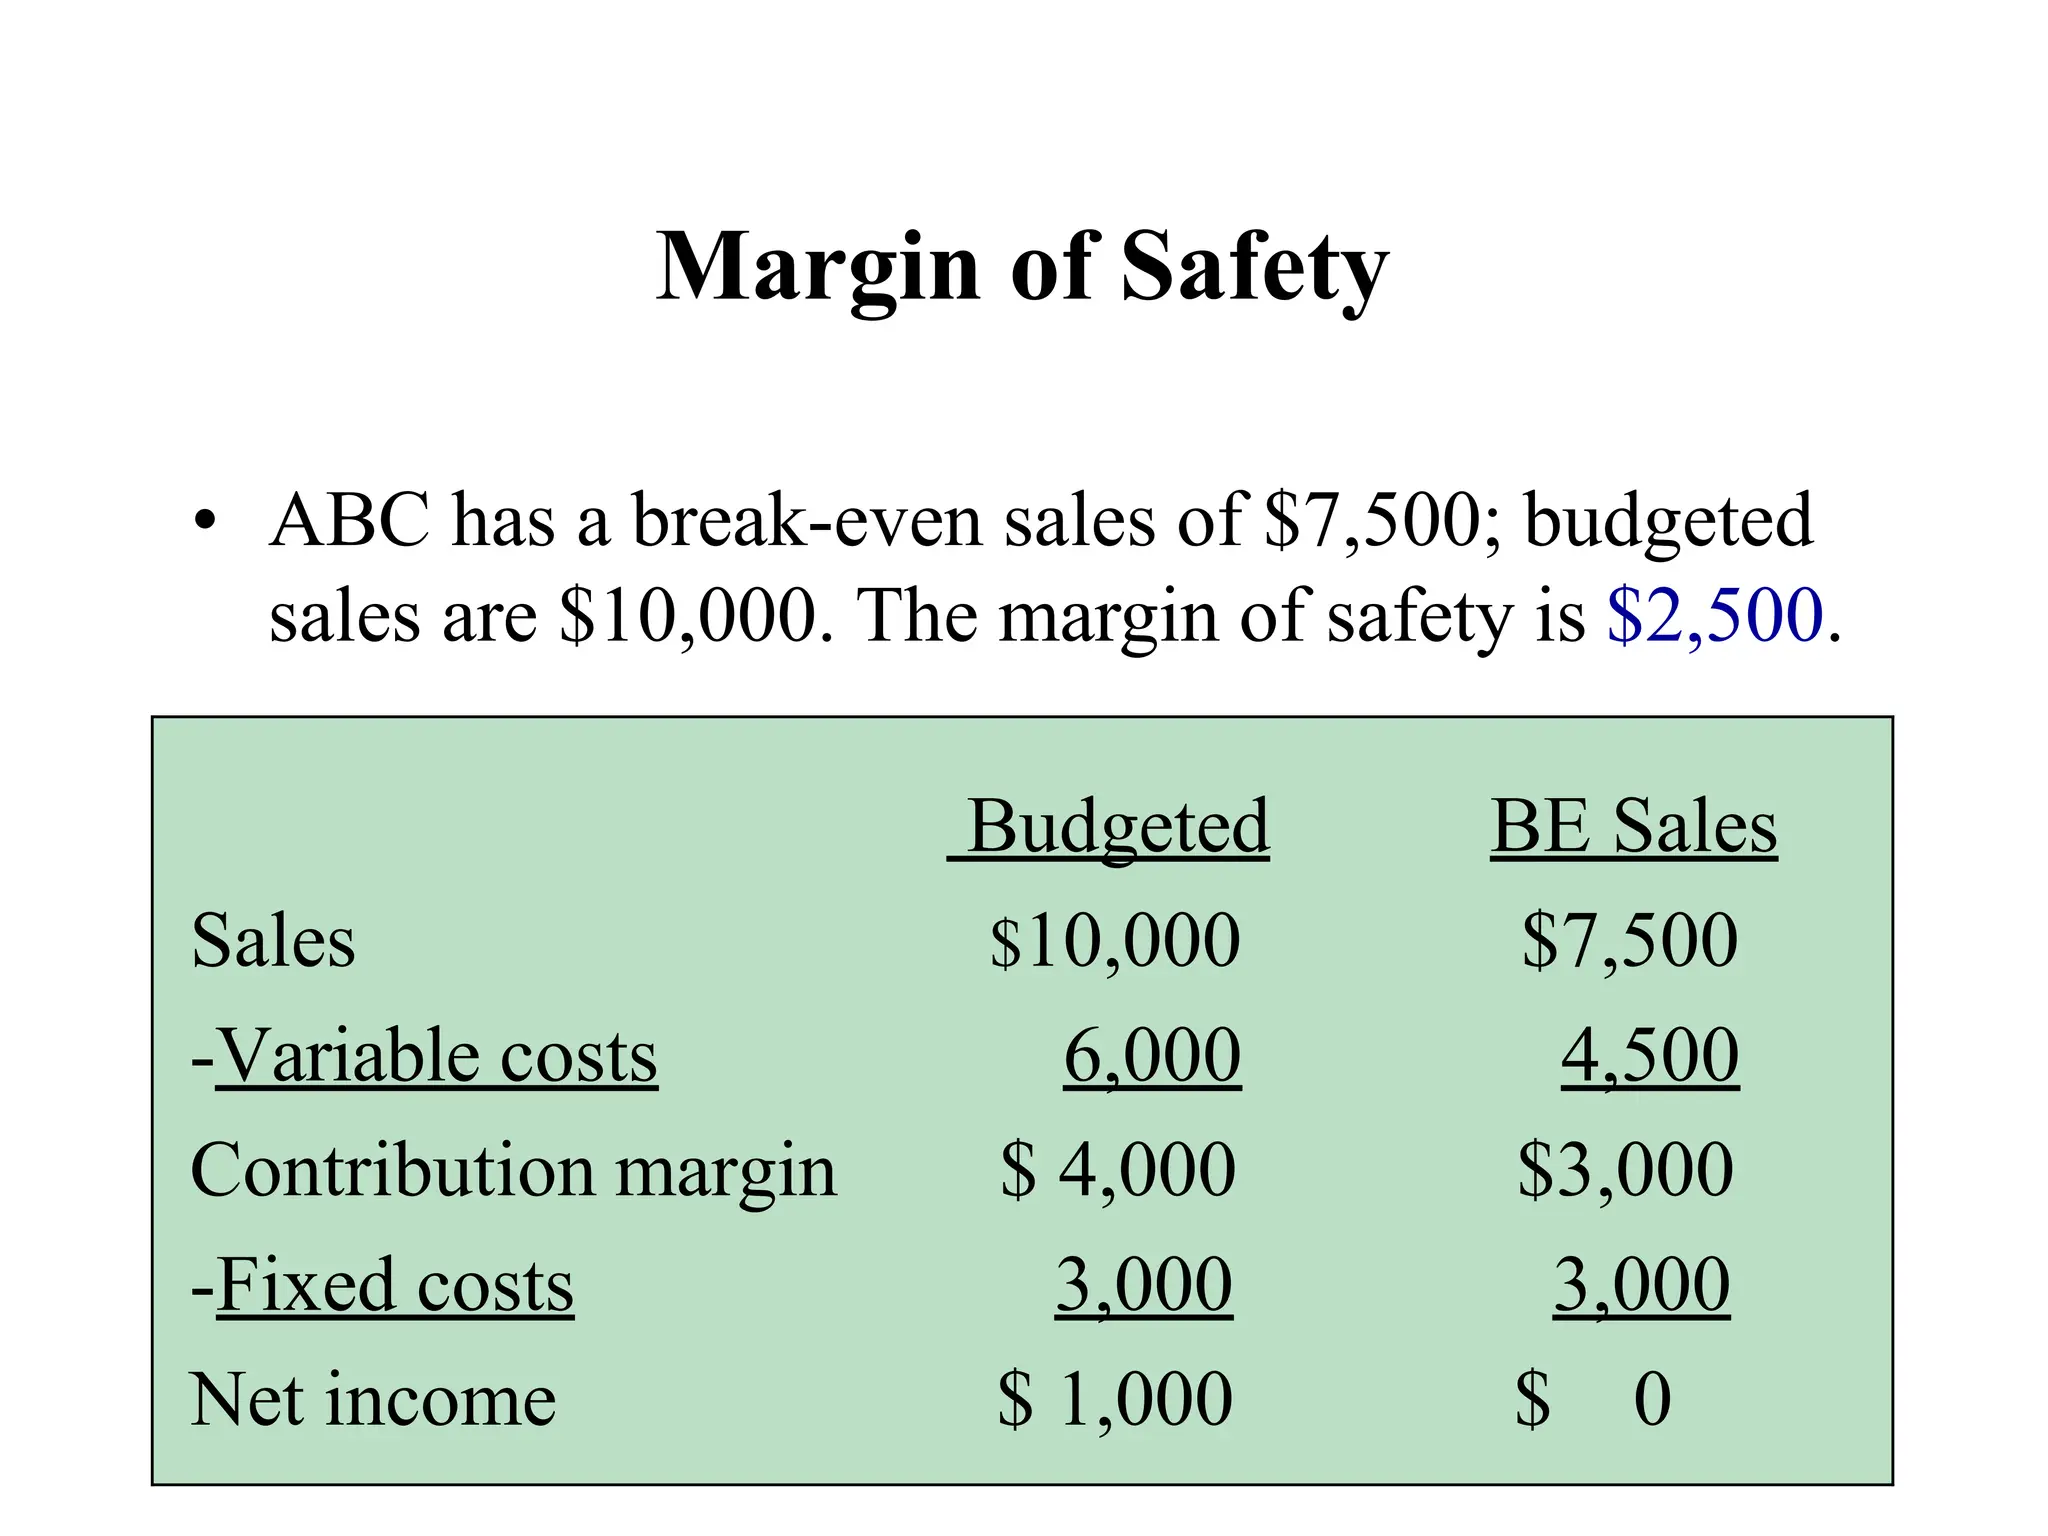
Budgeted BE Sales
Sales$10,000 $7,500
-Variable costs 6,000 4,500
Contribution margin $ 4,000 $3,000
-Fixed costs 3,000 3,000
Net income $ 1,000 $ 0
Margin of Safety
• ABC has a break-even sales of $7,500; budgeted
sales are $10,000. The margin of safety is $2,500.
39.
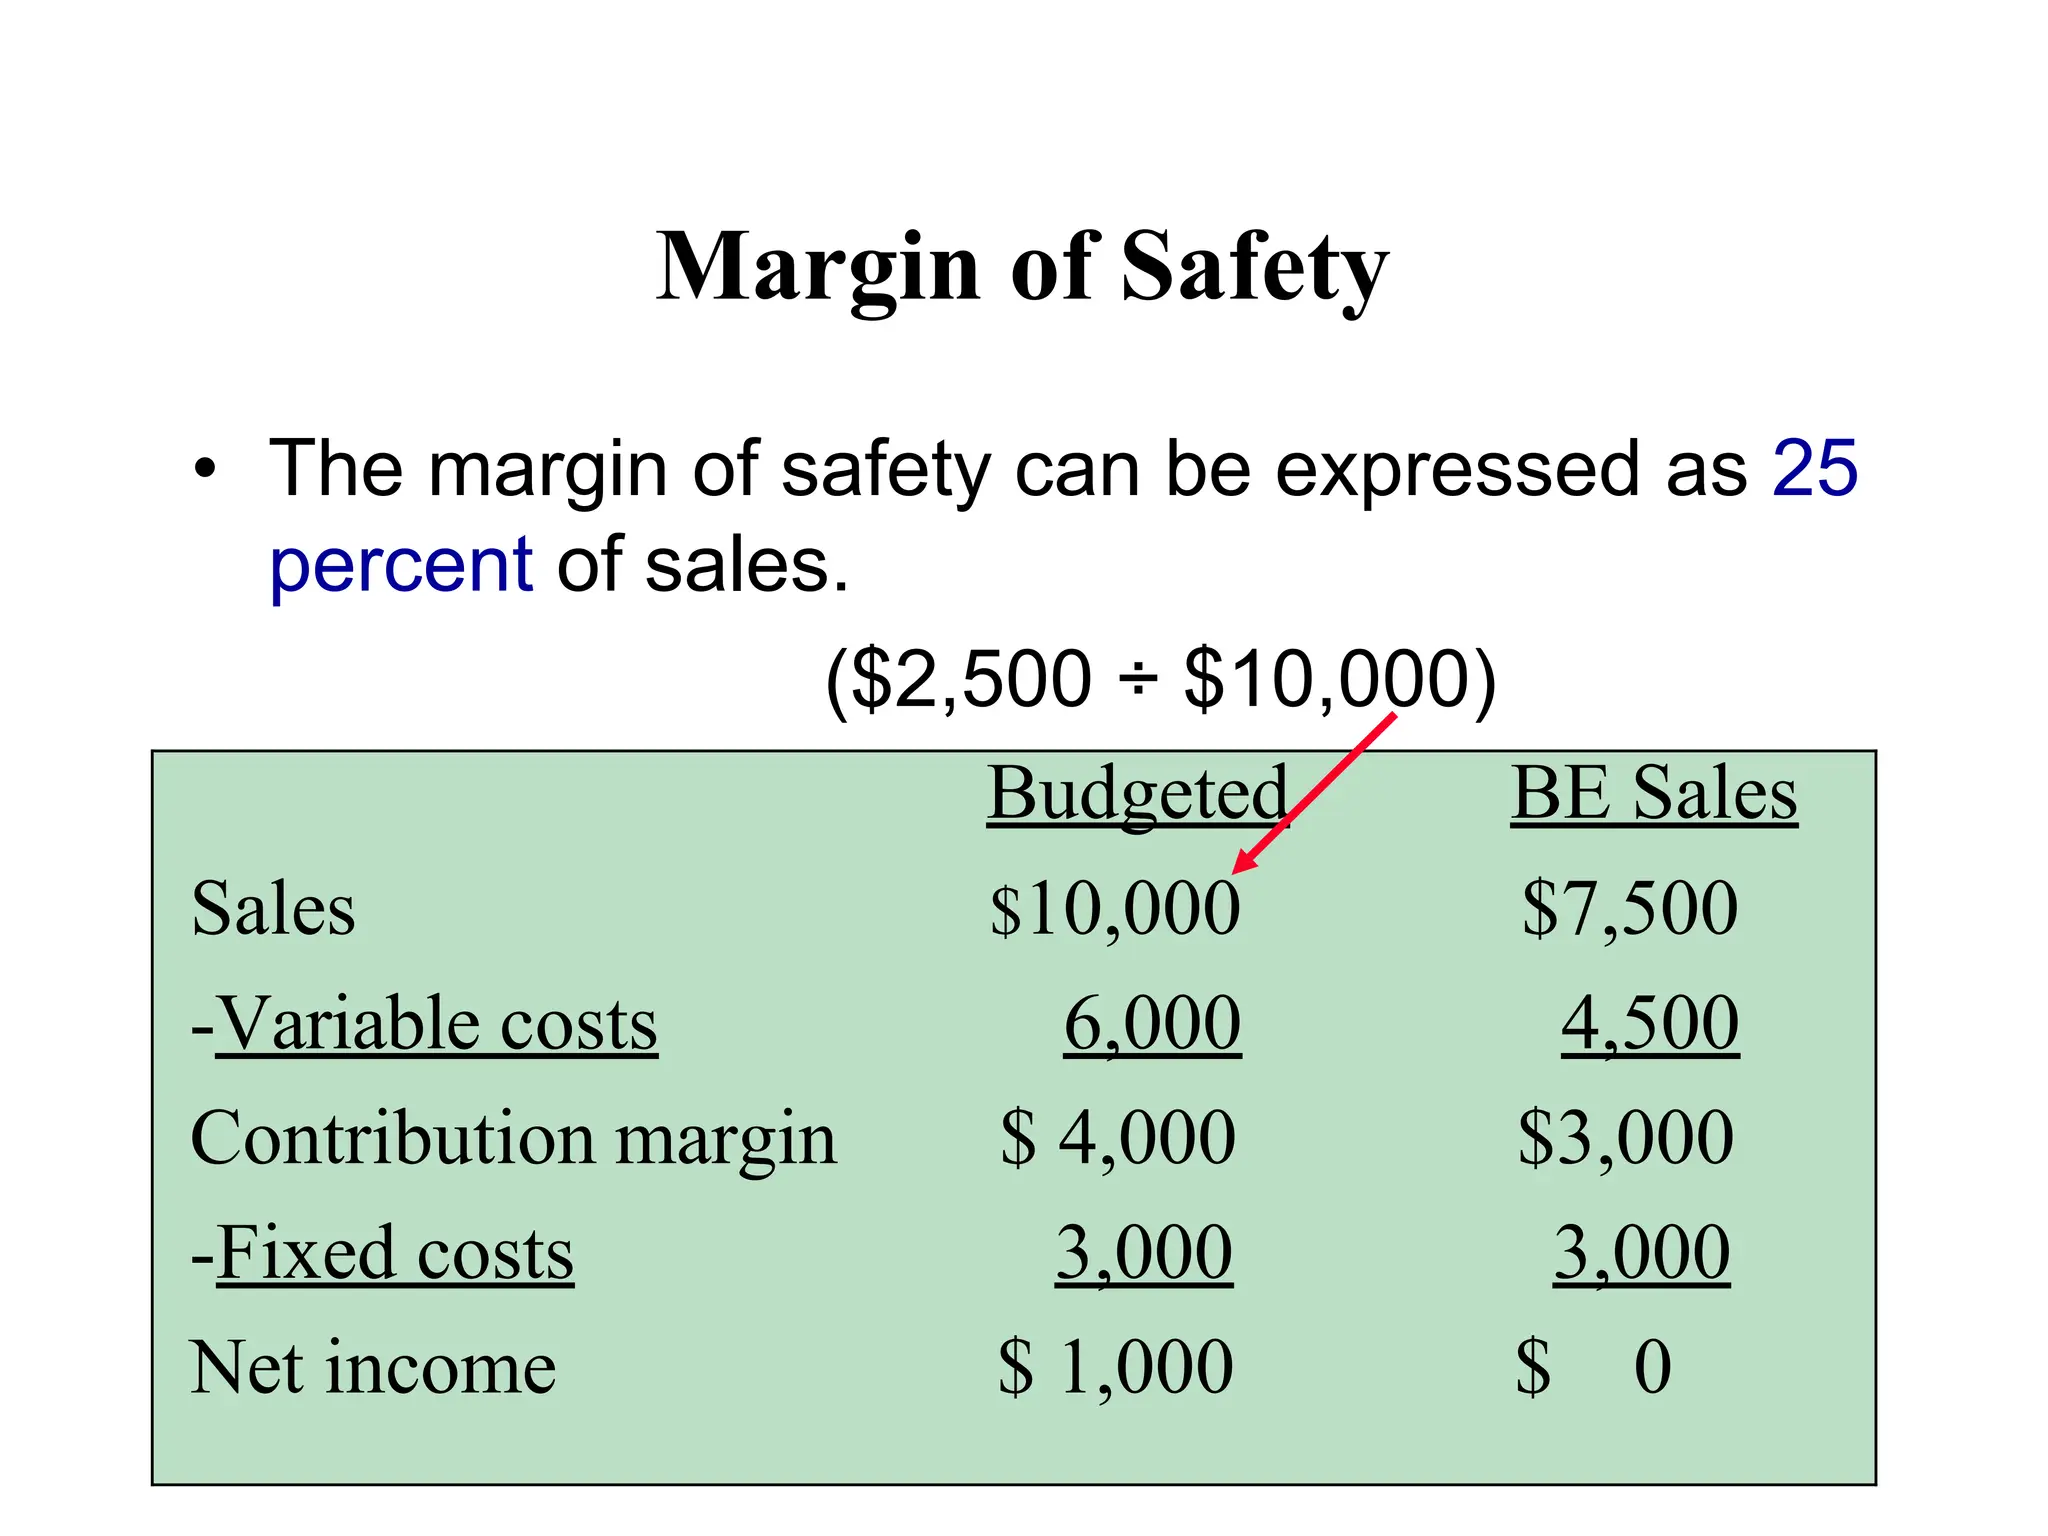
Margin of Safety
•The margin of safety can be expressed as 25
percent of sales.
($2,500 ÷ $10,000)
Budgeted BE Sales
Sales $10,000 $7,500
-Variable costs 6,000 4,500
Contribution margin $ 4,000 $3,000
-Fixed costs 3,000 3,000
Net income $ 1,000 $ 0
40.
Methods of CostEstimation
• Engineering Method
– It is based on a study of input-output relationship.
– The cost of all inputs are added to estimate the
cost of the output.
– This method is used only when input-output
relationship remains stable over-time and indirect
costs are a small portion of total cost; it is also
used when there is no past data to analyze.
• Analysis of Past Data
41.
Analysis of PastData
• Analysis of Past Data
– High-low Method
– Scatter-graph
– Simple Ordinary Least-Square (OLS)
Regression
• Note: all of these methods assume linearity and
one independent variable (one cost driver).
42.
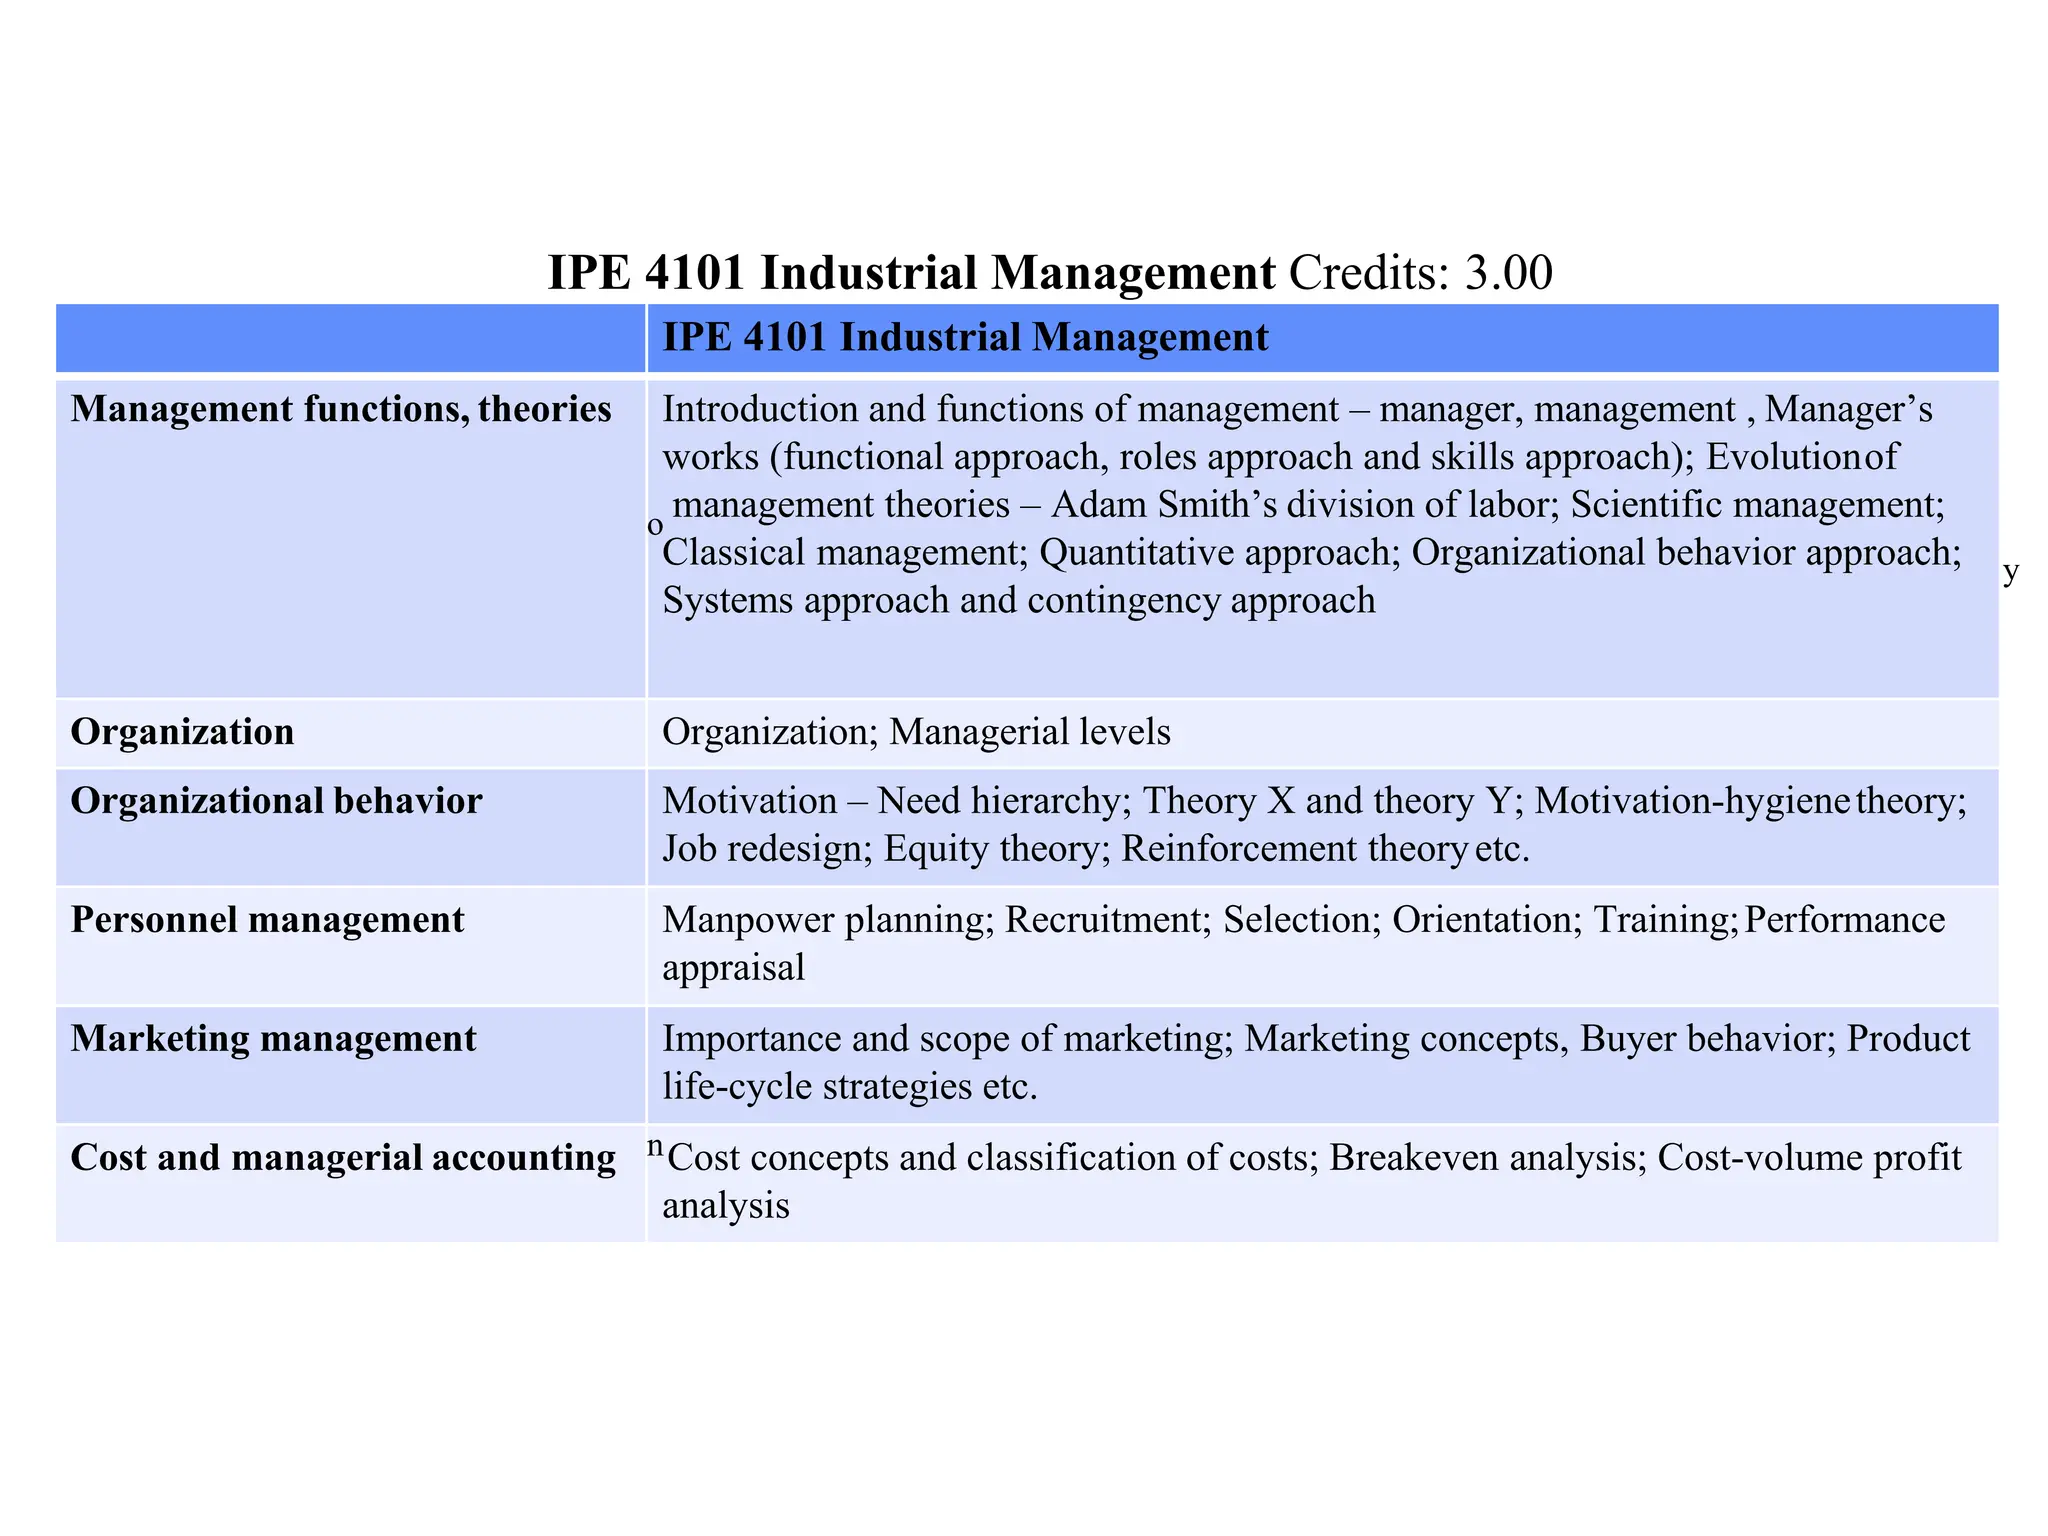
IPE 4101 IndustrialManagement Credits: 3.00
Management functions, theories and organization: Introduction and functions of management – manager, management and organization;
y
Managerial levels;
Manager’s works (functional approach, ro
Evolution of management theories – Ada
Classical management; Quantitative appr
Current trends and issues in management;
etc.
Organizational behavior: Importance; M
Equity theory; Reinforcement theory etc.;
les approach and skills approach); Scope and importance of management;
m Smith’s division of labor; Scientific management;
ach; Organizational behavior approach; Systems approach and contingency approach;
Organizational design and structure – coordination, span of control, authority, delegation, hierarch
otivation – need hierarchy; Theory X and theory Y; Motivation-hygiene theory; Job redesign;
Leadership – managers and leaders; Leadership styles and theories (trait theories, behavioral
theories, contingency theories etc.).
Personnel management: Manpower plan
etc.
Marketing management: Importance an
ning; Recruitment; Selection; Orientation; Training; Performance appraisal; Wages and incentives
d scope of marketing; Marketing concepts; Channel decisions; Marketing mix; Buyer behavior;
oncepts and classification of costs; Breakeven analysis; Cost-volume profit analysis etc.
Product life-cycle strategies etc.
Cost and managerial accounting: Cost c
Recommended Books:
1. Edwin B. Flippo : Personnel Managem
2. M Y Khan, PK Jain : Financial Mana
ent
gement, Text, Problems and Cases
3. Richard B. Chase, Nicholas J. Aquila
4. AYH., Eric W. Noreen & Peter C. Br
o, F.Robert Jacobs : Production and Operations Management: Manufacturing and Services
ewe Garrision : Managerial Accounting
IPE 4101 Industrial Management
Management functions, theories Introduction and functions of management – manager, management , Manager’s
works (functional approach, roles approach and skills approach); Evolutionof
o
management theories – Adam Smith’s division of labor; Scientific management;
Classical management; Quantitative approach; Organizational behavior approach;
Systems approach and contingency approach
Organization Organization; Managerial levels
Organizational behavior Motivation – Need hierarchy; Theory X and theory Y; Motivation-hygienetheory;
Job redesign; Equity theory; Reinforcement theoryetc.
Personnel management Manpower planning; Recruitment; Selection; Orientation; Training;Performance
appraisal
Marketing management Importance and scope of marketing; Marketing concepts, Buyer behavior; Product
life-cycle strategies etc.
Cost and managerial accounting nCost concepts and classification of costs; Breakeven analysis; Cost-volume profit
analysis
![Examples
For example, suppose that your fixed costs for producing
100,000 product were 30,000 Rs a year.
Your variable costs are 2.20 R.s materials, 4.00 R.s labor, and
0.80 Rs overhead, for a total of 7.00 R.s per unit.
If you choose a selling price of 12.00 Rs for each product, then:
BEP= TFC/P-V
30,000(TFC) divided by [12.00(P) - 7.00(V)] equals 6000 units.
This is the number of products that have to be sold at a selling
price of 12.00 Rs before your business will start to make a profit.
For example, if it costs R.s. 50 to produce a pen, and there
are fixed costs of R.s.1,000, the break-even point for selling
the widgets would be:
If selling for R.s. 100: 20 Widgets
(Calculated as 1000/(100-50)=20)
If selling for $200: 20 Widgets
(Calculated as 1000/(200-50)=6.7)
From this we can make out that the company should sell
products at higher price to reach BEPfaster.](https://image.slidesharecdn.com/lectureim-7-250903130819-991dcbbd/75/Lecture-IM-7-for-the-managment-system-in-any-organaysation-17-2048.jpg)