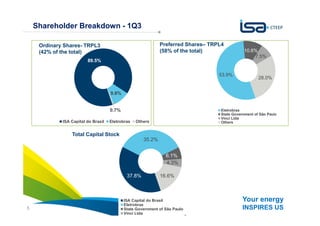
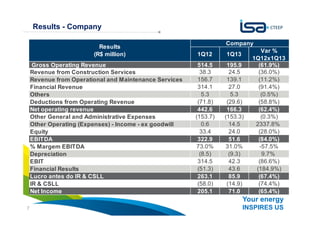
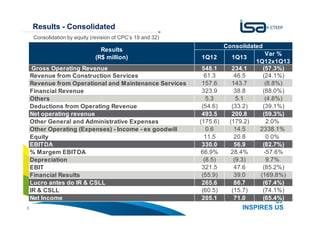
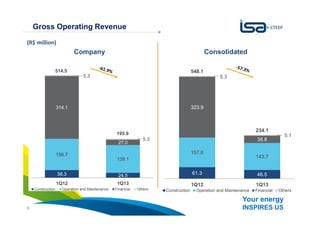
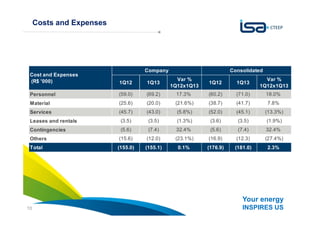
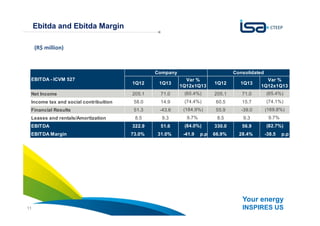
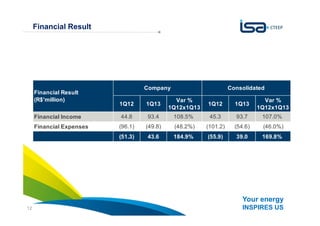
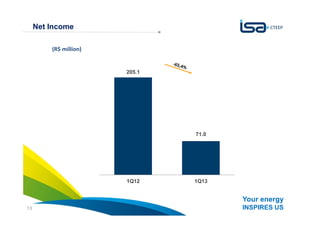
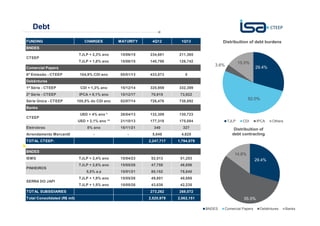
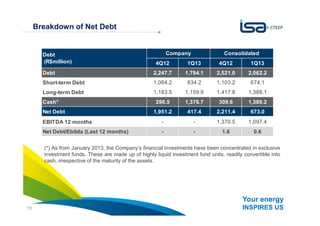
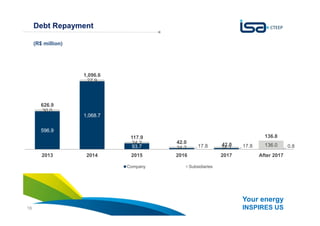
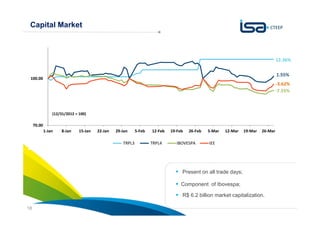
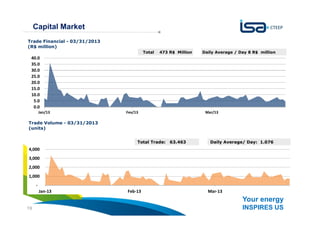
Your energy
INSPIRES US1
1Q13 Results Presentation
São Paulo, May 16 2013
Your energy
INSPIRES US2
Capital Market Performance
1Q13 Results
CTEEP
Your energy
INSPIRES US3
CTEEP Profile
A estratégia da CTEEP é baseada no crescimento sustentável
com foco na contínua criação de valor13,724 Km of transmission lines;
19,189 Km of circuits;
1,952 Km of optic fiber cables
106 substations.
Responsible for the annual
transmission of 30.0% of all
electricity produced in the country,
60% of the energy consumed in the
Southeast Region and nearly 100%
in the state of São Paulo;
The largest private sector concessionaire operating a public
utility service for the transmission of energy in Brazil,
controlled by ISA, one of the largest energy transmission
groups in Latin America.
Your energy
INSPIRES US4
Expansion of national Territory
A estratégia da CTEEP é baseada no crescimento sustentável
com foco na contínua criação de valorLargest Non-stop Transmission
Lines under construction in the
world (IEMadeira)
Starting in the continuous current
technology
Relevant Interconnection Projects
in the North of Brazil
Major supporting Works in the
South and Southeast of Brazil
In Operating
In Construction
EVRECY*
Acquisition of Assets
Your energy
INSPIRES US5
37.8%
35.2%
6.1%
4.3%
16.6%
ISA Capital do Brasil
Eletrobras
State Government of São Paulo
Vinci Ltda
53.9%
10.6%
7.5%
28.0%
Eletrobras
State Government of São Paulo
Vinci Ltda
Others
89.5%
9.8%
0.7%
ISA Capital do Brasil Eletrobras Others
Preferred Shares– TRPL4
(58% of the total)
Ordinary Shares- TRPL3
(42% of the total)
Total Capital Stock
Shareholder Breakdown - 1Q3
Your energy
INSPIRES US6
Capital Market Performance
1Q13 Results
CTEEP
Your energy
INSPIRES US7
Results - Company
1Q12 1Q13
Var %
1Q12x1Q13
Gross Operating Revenue 514.5 195.9 (61.9%)
Revenue from Construction Services 38.3 24.5 (36.0%)
Revenue from Operational and Maintenance Services 156.7 139.1 (11.2%)
Financial Revenue 314.1 27.0 (91.4%)
Others 5.3 5.3 (0.5%)
Deductions from Operating Revenue (71.8) (29.6) (58.8%)
Net operating revenue 442.6 166.3 (62.4%)
Other General and Administrative Expenses (153.7) (153.3) (0.3%)
Other Operating (Expenses) - Income - ex goodwill 0.6 14.5 2337.8%
Equity 33.4 24.0 (28.0%)
EBITDA 322.9 51.6 (84.0%)
% Margem EBITDA 73.0% 31.0% -57.5%
Depreciation (8.5) (9.3) 9.7%
EBIT 314.5 42.3 (86.6%)
Financial Results (51.3) 43.6 (184.9%)
Lucro antes do IR & CSLL 263.1 85.9 (67.4%)
IR & CSLL (58.0) (14.9) (74.4%)
Net Income 205.1 71.0 (65.4%)
Results
(R$ million)
Company
Your energy
INSPIRES US8
Results - Consolidated
1Q12 1Q13
Var %
1Q12x1Q13
Gross Operating Revenue 548.1 234.1 (57.3%)
Revenue from Construction Services 61.3 46.5 (24.1%)
Revenue from Operational and Maintenance Services 157.6 143.7 (8.8%)
Financial Revenue 323.9 38.8 (88.0%)
Others 5.3 5.1 (4.8%)
Deductions from Operating Revenue (54.6) (33.2) (39.1%)
Net operating revenue 493.5 200.8 (59.3%)
Other General and Administrative Expenses (175.6) (179.2) 2.0%
Other Operating (Expenses) - Income - ex goodwill 0.6 14.5 2338.1%
Equity 11.5 20.8 0.0%
EBITDA 330.0 56.9 (82.7%)
% Margem EBITDA 66.9% 28.4% -57.6%
Depreciation (8.5) (9.3) 9.7%
EBIT 321.5 47.6 (85.2%)
Financial Results (55.9) 39.0 (169.8%)
Lucro antes do IR & CSLL 265.6 86.7 (67.4%)
IR & CSLL (60.5) (15.7) (74.1%)
Net Income 205.1 71.0 (65.4%)
Results
(R$ million)
Consolidated
Consolidation by equity (revision of CPC’s 19 and 32)
Your energy
INSPIRES US9
Gross Operating Revenue
(R$ million)
Company Consolidated
38.3 24.5
156.7
139.1
314.1
27.0
5.3
5.3
514.5
195.9
1Q12 1Q13
Construction Operation and Maintenance Financial Others
61.3 46.5
157.6
143.7
323.9
38.8
5.3
5.1
548.1
234.1
1Q12 1Q13
Construction Operation and Maintenance Financial Others
Your energy
INSPIRES US10
Costs and Expenses
A estratégia da CTEEP é baseada no crescimento sustentável
com foco na contínua criação de valor
1Q12 1Q13
Var %
1Q12x1Q13
1Q12 1Q13
Var %
1Q12x1Q13
Personnel (59.0) (69.2) 17.3% (60.2) (71.0) 18.0%
Material (25.6) (20.0) (21.6%) (38.7) (41.7) 7.8%
Services (45.7) (43.0) (5.8%) (52.0) (45.1) (13.3%)
Leases and rentals (3.5) (3.5) (1.3%) (3.6) (3.5) (1.9%)
Contingencies (5.6) (7.4) 32.4% (5.6) (7.4) 32.4%
Others (15.6) (12.0) (23.1%) (16.9) (12.3) (27.4%)
Total (155.0) (155.1) 0.1% (176.9) (181.0) 2.3%
Consolidated
Cost and Expenses
(R$ '000)
Company
Your energy
INSPIRES US11
Ebitda and Ebitda Margin
A estratégia da CTEEP é baseada no crescimento sustentável
com foco na contínua criação de valor
(R$ million)
1Q12 1Q13 1Q12 1Q13
Net Income 205.1 71.0 205.1 71.0
Income tax and social contribuition 58.0 14.9 60.5 15.7
Financial Results 51.3 -43.6 55.9 -39.0
Leases and rentals/Amortization 8.5 9.3 8.5 9.3
EBITDA 322.9 51.6 330.0 56.9
EBITDA Margin 73.0% 31.0% -41.9 p.p 66.9% 28.4% -38.5 p.p
Var %
1Q12x1Q13
Company
EBITDA - ICVM 527 Var %
1Q12x1Q13
Consolidated
(65.4%)
(74.4%)
(184.9%)
9.7%
(84.0%)
(65.4%)
(74.1%)
(169.8%)
9.7%
(82.7%)
Your energy
INSPIRES US12
Financial Result
1Q12 1Q13
Var %
1Q12x1Q13
1Q12 1Q13
Var %
1Q12x1Q13
Financial Income 44.8 93.4 108.5% 45.3 93.7 107.0%
Financial Expenses (96.1) (49.8) (48.2%) (101.2) (54.6) (46.0%)
(51.3) 43.6 184.9% (55.9) 39.0 169.8%
Financial Result
(R$'million)
Company Consolidated
Your energy
INSPIRES US13
Net Income
A estratégia da CTEEP é baseada no crescimento sustentável
com foco na contínua criação de valor
(R$ million)
205.1
71.0
1Q12 1Q13
Your energy
INSPIRES US14
Debt
A estratégia da CTEEP é baseada no crescimento sustentável
com foco na contínua criação de valor
FUNDING CHARGES MATURITY 4Q12 1Q13
BNDES
TJLP + 2,3% ano 15/06/15 234,681 211,365
TJLP + 1,8% ano 15/06/15 140,798 126,742
Comercial Papers
6ª Emissão - CTEEP 104,9% CDI ano 05/01/13 433,873 0
Debêntures
1ª Série - CTEEP CDI + 1,3% ano 15/12/14 325,959 332,399
2ª Série - CTEEP IPCA + 8,1% ano 15/12/17 70,915 73,922
Série Única - CTEEP 105,5% do CDI ano 02/07/14 726,476 738,892
Banks
USD + 4% ano * 26/04/13 132,309 130,723
USD + 2,1% ano ** 21/10/13 177,318 175,084
Eletrobras 8% ano 15/11/21 340 327
Arrendamento Mercantil - - 5,048 4,625
TOTAL CTEEP: 2,247,717 1,794,079
BNDES
IEMG TJLP + 2,4% ano 15/04/23 52,513 51,253
TJLP + 2,6% ano 15/05/26 47,758 46,856
5,5% a.a 15/01/21 80,152 78,840
TJLP + 1,9% ano 15/05/26 49,801 48,888
TJLP + 1,5% ano 15/05/26 43,038 42,235
TOTAL SUBSIDIARIES 273,262 268,072
Total Consolidated (R$ mil) 2,520,979 2,062,151
SERRA DO JAPI
CTEEP
CTEEP
PINHEIROS
29.4%
52.0%
3.6%
15.0%
Distribuition of debt burdens
TJLP CDI IPCA Others
29.4%
55.5%
14.8%
Distribuition of
debt contracting
BNDES Comercial Papers Debêntures Banks
Your energy
INSPIRES US15
Breakdown of Net Debt
4Q12 1Q13 4Q12 1Q13
Debt 2,247.7 1,794.1 2,521.0 2,062.2
Short-term Debt 1,064.2 634.2 1,103.2 674.1
Long-term Debt 1,183.5 1,159.9 1,417.8 1,388.1
Cash* 296.5 1,376.7 309.6 1,389.2
Net Debt 1,951.2 417.4 2,211.4 673.0
EBITDA 12 months - - 1,370.5 1,097.4
Net Debt/Ebitda (Last 12 months) - - 1.6 0.6
Debt
(R$million)
Company Consolidated
(*) As from January 2013, the Company’s financial investments have been concentrated in exclusive
investment funds. These are made up of highly liquid investment fund units, readily convertible into
cash, irrespective of the maturity of the assets.
Your energy
INSPIRES US16
Debt Repayment
(R$ million)
596.9
1,068.7
93.7 17.8 17.8 0.8
30.0
27.9
24.2
24.2 24.2 136.0
626.9
1,096.6
117.9
42.0 42.0
136.8
2013 2014 2015 2016 2017 After 2017
Company Subsidiaries
Your energy
INSPIRES US17
Capital Market Performance
1Q13 Results
CTEEP
Your energy
INSPIRES US18
Capital Market
Present on all trade days;
Component of Ibovespa;
R$ 6.2 billion market capitalization.
70.00
100.00
1-Jan 8-Jan 15-Jan 22-Jan 29-Jan 5-Feb 12-Feb 19-Feb 26-Feb 5-Mar 12-Mar 19-Mar 26-Mar
TRPL3 TRPL4 IBOVESPA IEE
-3.62%
-7.55%
1.55%
12.36%
(12/31/2012 = 100)
Your energy
INSPIRES US19
Capital Market
0.0
5.0
10.0
15.0
20.0
25.0
30.0
35.0
40.0
Jan/13 Fev/13 Mar/13
Trade Financial - 03/31/2013
(R$ million)
Total 473 R$ Million Daily Average / Day 8 R$ million
-
1,000
2,000
3,000
4,000
Jan-13 Feb-13 Mar-13
Trade Volume - 03/31/2013
(units)
Total Trade: 63.463 Daily Average/ Day: 1.076
Your energy
INSPIRES US20
Disclaimer
A estratégia da CTEEP é baseada no crescimento sustentável
com foco na contínua criação de valor
All statements contained herein with regard to the Company’s
business prospects, projected results and the potential growth
of its business aremere forecasts, based on local management
expectationsin relation to the Company’s future performance.
Dependent as they are on market shifts and on the overall
performance of the Brazilian economy and the sector
and international markets, such estimates
are subject to changes.
Your energy
INSPIRES US21
Investor Relations
Phone: 55 11 3138-7557
ri@cteep.com.br
www.cteep.com.br/ri

Presentation 1Q13

  • 1.
    Your energy INSPIRES US1 1Q13Results Presentation São Paulo, May 16 2013
  • 2.
    Your energy INSPIRES US2 CapitalMarket Performance 1Q13 Results CTEEP
  • 3.
    Your energy INSPIRES US3 CTEEPProfile A estratégia da CTEEP é baseada no crescimento sustentável com foco na contínua criação de valor13,724 Km of transmission lines; 19,189 Km of circuits; 1,952 Km of optic fiber cables 106 substations. Responsible for the annual transmission of 30.0% of all electricity produced in the country, 60% of the energy consumed in the Southeast Region and nearly 100% in the state of São Paulo; The largest private sector concessionaire operating a public utility service for the transmission of energy in Brazil, controlled by ISA, one of the largest energy transmission groups in Latin America.
  • 4.
    Your energy INSPIRES US4 Expansionof national Territory A estratégia da CTEEP é baseada no crescimento sustentável com foco na contínua criação de valorLargest Non-stop Transmission Lines under construction in the world (IEMadeira) Starting in the continuous current technology Relevant Interconnection Projects in the North of Brazil Major supporting Works in the South and Southeast of Brazil In Operating In Construction EVRECY* Acquisition of Assets
  • 5.
    Your energy INSPIRES US5 37.8% 35.2% 6.1% 4.3% 16.6% ISACapital do Brasil Eletrobras State Government of São Paulo Vinci Ltda 53.9% 10.6% 7.5% 28.0% Eletrobras State Government of São Paulo Vinci Ltda Others 89.5% 9.8% 0.7% ISA Capital do Brasil Eletrobras Others Preferred Shares– TRPL4 (58% of the total) Ordinary Shares- TRPL3 (42% of the total) Total Capital Stock Shareholder Breakdown - 1Q3
  • 6.
    Your energy INSPIRES US6 CapitalMarket Performance 1Q13 Results CTEEP
  • 7.
    Your energy INSPIRES US7 Results- Company 1Q12 1Q13 Var % 1Q12x1Q13 Gross Operating Revenue 514.5 195.9 (61.9%) Revenue from Construction Services 38.3 24.5 (36.0%) Revenue from Operational and Maintenance Services 156.7 139.1 (11.2%) Financial Revenue 314.1 27.0 (91.4%) Others 5.3 5.3 (0.5%) Deductions from Operating Revenue (71.8) (29.6) (58.8%) Net operating revenue 442.6 166.3 (62.4%) Other General and Administrative Expenses (153.7) (153.3) (0.3%) Other Operating (Expenses) - Income - ex goodwill 0.6 14.5 2337.8% Equity 33.4 24.0 (28.0%) EBITDA 322.9 51.6 (84.0%) % Margem EBITDA 73.0% 31.0% -57.5% Depreciation (8.5) (9.3) 9.7% EBIT 314.5 42.3 (86.6%) Financial Results (51.3) 43.6 (184.9%) Lucro antes do IR & CSLL 263.1 85.9 (67.4%) IR & CSLL (58.0) (14.9) (74.4%) Net Income 205.1 71.0 (65.4%) Results (R$ million) Company
  • 8.
    Your energy INSPIRES US8 Results- Consolidated 1Q12 1Q13 Var % 1Q12x1Q13 Gross Operating Revenue 548.1 234.1 (57.3%) Revenue from Construction Services 61.3 46.5 (24.1%) Revenue from Operational and Maintenance Services 157.6 143.7 (8.8%) Financial Revenue 323.9 38.8 (88.0%) Others 5.3 5.1 (4.8%) Deductions from Operating Revenue (54.6) (33.2) (39.1%) Net operating revenue 493.5 200.8 (59.3%) Other General and Administrative Expenses (175.6) (179.2) 2.0% Other Operating (Expenses) - Income - ex goodwill 0.6 14.5 2338.1% Equity 11.5 20.8 0.0% EBITDA 330.0 56.9 (82.7%) % Margem EBITDA 66.9% 28.4% -57.6% Depreciation (8.5) (9.3) 9.7% EBIT 321.5 47.6 (85.2%) Financial Results (55.9) 39.0 (169.8%) Lucro antes do IR & CSLL 265.6 86.7 (67.4%) IR & CSLL (60.5) (15.7) (74.1%) Net Income 205.1 71.0 (65.4%) Results (R$ million) Consolidated Consolidation by equity (revision of CPC’s 19 and 32)
  • 9.
    Your energy INSPIRES US9 GrossOperating Revenue (R$ million) Company Consolidated 38.3 24.5 156.7 139.1 314.1 27.0 5.3 5.3 514.5 195.9 1Q12 1Q13 Construction Operation and Maintenance Financial Others 61.3 46.5 157.6 143.7 323.9 38.8 5.3 5.1 548.1 234.1 1Q12 1Q13 Construction Operation and Maintenance Financial Others
  • 10.
    Your energy INSPIRES US10 Costsand Expenses A estratégia da CTEEP é baseada no crescimento sustentável com foco na contínua criação de valor 1Q12 1Q13 Var % 1Q12x1Q13 1Q12 1Q13 Var % 1Q12x1Q13 Personnel (59.0) (69.2) 17.3% (60.2) (71.0) 18.0% Material (25.6) (20.0) (21.6%) (38.7) (41.7) 7.8% Services (45.7) (43.0) (5.8%) (52.0) (45.1) (13.3%) Leases and rentals (3.5) (3.5) (1.3%) (3.6) (3.5) (1.9%) Contingencies (5.6) (7.4) 32.4% (5.6) (7.4) 32.4% Others (15.6) (12.0) (23.1%) (16.9) (12.3) (27.4%) Total (155.0) (155.1) 0.1% (176.9) (181.0) 2.3% Consolidated Cost and Expenses (R$ '000) Company
  • 11.
    Your energy INSPIRES US11 Ebitdaand Ebitda Margin A estratégia da CTEEP é baseada no crescimento sustentável com foco na contínua criação de valor (R$ million) 1Q12 1Q13 1Q12 1Q13 Net Income 205.1 71.0 205.1 71.0 Income tax and social contribuition 58.0 14.9 60.5 15.7 Financial Results 51.3 -43.6 55.9 -39.0 Leases and rentals/Amortization 8.5 9.3 8.5 9.3 EBITDA 322.9 51.6 330.0 56.9 EBITDA Margin 73.0% 31.0% -41.9 p.p 66.9% 28.4% -38.5 p.p Var % 1Q12x1Q13 Company EBITDA - ICVM 527 Var % 1Q12x1Q13 Consolidated (65.4%) (74.4%) (184.9%) 9.7% (84.0%) (65.4%) (74.1%) (169.8%) 9.7% (82.7%)
  • 12.
    Your energy INSPIRES US12 FinancialResult 1Q12 1Q13 Var % 1Q12x1Q13 1Q12 1Q13 Var % 1Q12x1Q13 Financial Income 44.8 93.4 108.5% 45.3 93.7 107.0% Financial Expenses (96.1) (49.8) (48.2%) (101.2) (54.6) (46.0%) (51.3) 43.6 184.9% (55.9) 39.0 169.8% Financial Result (R$'million) Company Consolidated
  • 13.
    Your energy INSPIRES US13 NetIncome A estratégia da CTEEP é baseada no crescimento sustentável com foco na contínua criação de valor (R$ million) 205.1 71.0 1Q12 1Q13
  • 14.
    Your energy INSPIRES US14 Debt Aestratégia da CTEEP é baseada no crescimento sustentável com foco na contínua criação de valor FUNDING CHARGES MATURITY 4Q12 1Q13 BNDES TJLP + 2,3% ano 15/06/15 234,681 211,365 TJLP + 1,8% ano 15/06/15 140,798 126,742 Comercial Papers 6ª Emissão - CTEEP 104,9% CDI ano 05/01/13 433,873 0 Debêntures 1ª Série - CTEEP CDI + 1,3% ano 15/12/14 325,959 332,399 2ª Série - CTEEP IPCA + 8,1% ano 15/12/17 70,915 73,922 Série Única - CTEEP 105,5% do CDI ano 02/07/14 726,476 738,892 Banks USD + 4% ano * 26/04/13 132,309 130,723 USD + 2,1% ano ** 21/10/13 177,318 175,084 Eletrobras 8% ano 15/11/21 340 327 Arrendamento Mercantil - - 5,048 4,625 TOTAL CTEEP: 2,247,717 1,794,079 BNDES IEMG TJLP + 2,4% ano 15/04/23 52,513 51,253 TJLP + 2,6% ano 15/05/26 47,758 46,856 5,5% a.a 15/01/21 80,152 78,840 TJLP + 1,9% ano 15/05/26 49,801 48,888 TJLP + 1,5% ano 15/05/26 43,038 42,235 TOTAL SUBSIDIARIES 273,262 268,072 Total Consolidated (R$ mil) 2,520,979 2,062,151 SERRA DO JAPI CTEEP CTEEP PINHEIROS 29.4% 52.0% 3.6% 15.0% Distribuition of debt burdens TJLP CDI IPCA Others 29.4% 55.5% 14.8% Distribuition of debt contracting BNDES Comercial Papers Debêntures Banks
  • 15.
    Your energy INSPIRES US15 Breakdownof Net Debt 4Q12 1Q13 4Q12 1Q13 Debt 2,247.7 1,794.1 2,521.0 2,062.2 Short-term Debt 1,064.2 634.2 1,103.2 674.1 Long-term Debt 1,183.5 1,159.9 1,417.8 1,388.1 Cash* 296.5 1,376.7 309.6 1,389.2 Net Debt 1,951.2 417.4 2,211.4 673.0 EBITDA 12 months - - 1,370.5 1,097.4 Net Debt/Ebitda (Last 12 months) - - 1.6 0.6 Debt (R$million) Company Consolidated (*) As from January 2013, the Company’s financial investments have been concentrated in exclusive investment funds. These are made up of highly liquid investment fund units, readily convertible into cash, irrespective of the maturity of the assets.
  • 16.
    Your energy INSPIRES US16 DebtRepayment (R$ million) 596.9 1,068.7 93.7 17.8 17.8 0.8 30.0 27.9 24.2 24.2 24.2 136.0 626.9 1,096.6 117.9 42.0 42.0 136.8 2013 2014 2015 2016 2017 After 2017 Company Subsidiaries
  • 17.
    Your energy INSPIRES US17 CapitalMarket Performance 1Q13 Results CTEEP
  • 18.
    Your energy INSPIRES US18 CapitalMarket Present on all trade days; Component of Ibovespa; R$ 6.2 billion market capitalization. 70.00 100.00 1-Jan 8-Jan 15-Jan 22-Jan 29-Jan 5-Feb 12-Feb 19-Feb 26-Feb 5-Mar 12-Mar 19-Mar 26-Mar TRPL3 TRPL4 IBOVESPA IEE -3.62% -7.55% 1.55% 12.36% (12/31/2012 = 100)
  • 19.
    Your energy INSPIRES US19 CapitalMarket 0.0 5.0 10.0 15.0 20.0 25.0 30.0 35.0 40.0 Jan/13 Fev/13 Mar/13 Trade Financial - 03/31/2013 (R$ million) Total 473 R$ Million Daily Average / Day 8 R$ million - 1,000 2,000 3,000 4,000 Jan-13 Feb-13 Mar-13 Trade Volume - 03/31/2013 (units) Total Trade: 63.463 Daily Average/ Day: 1.076
  • 20.
    Your energy INSPIRES US20 Disclaimer Aestratégia da CTEEP é baseada no crescimento sustentável com foco na contínua criação de valor All statements contained herein with regard to the Company’s business prospects, projected results and the potential growth of its business aremere forecasts, based on local management expectationsin relation to the Company’s future performance. Dependent as they are on market shifts and on the overall performance of the Brazilian economy and the sector and international markets, such estimates are subject to changes.
  • 21.
    Your energy INSPIRES US21 InvestorRelations Phone: 55 11 3138-7557 ri@cteep.com.br www.cteep.com.br/ri