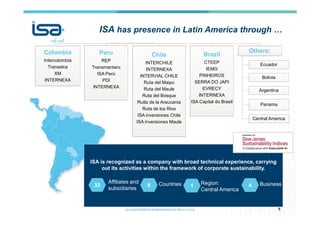
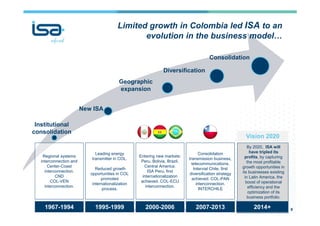
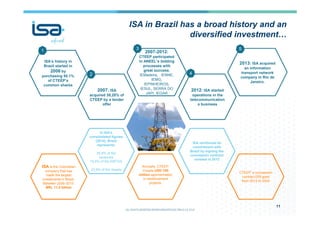
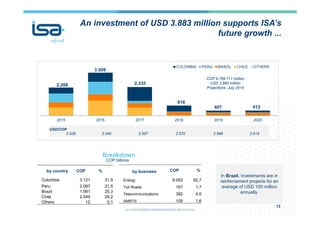
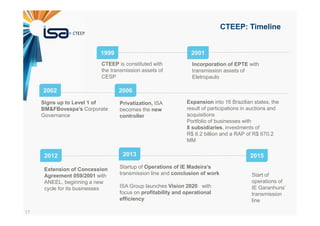
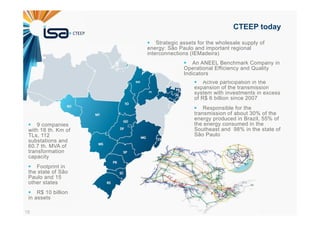
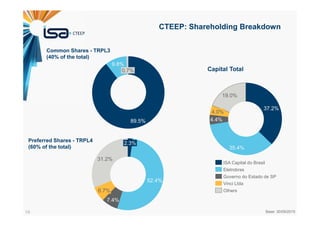
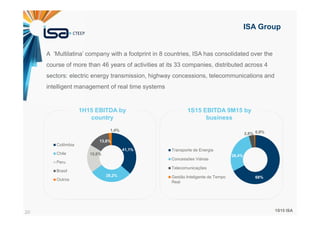
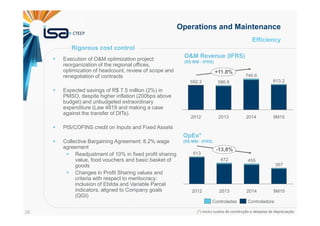
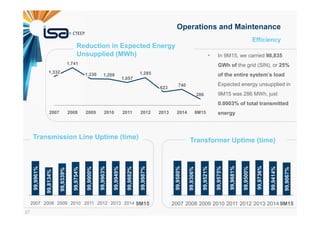
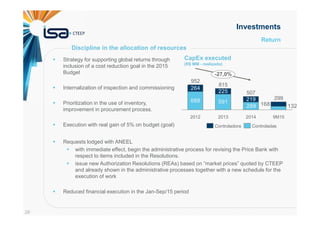
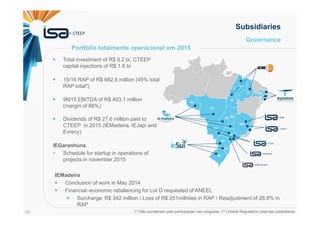
1
APIMEC 2015
PRESENTATION OF 3Q15 RESULTS
São Paulo, October 27, 2015
2
APIMEC seal 14 YEARS
3
Disclaimer
The statements in this report with respect to the outlook for the
Company’s businesses, the estimates and result and to the
potential for growth, constitute mere forecasts and were based on
management’s expectations in relation to the Company’s future.
These expectations are highly dependent on changes in the
market, the economic performance of Brazil, the sector and
international markets, all of which are subject to change.
4
ISA
Investor Presentation
APIMEC 2015
Sao Paulo. October 27, 2015
The IR Recognition granted by the Colombian Securities Exchange (Bolsa de Valores de Colombia S.A) is not a certification of the registered securities or the solvency of the issuer
AGENDA
6
Today, ISA is one of the largest company in
Latin America…
7
ELECTRIC ENERGY
TRANSPORT
TOLL ROAD
CONCESSIONS
TELECOMMUNICATIONS
TRANSPORT
SMART MANAGEMENT OF REAL
TIME SYSTEMS
Largest international
energy carrier in Latin
America.
41,650 kms of high voltage
circuit
77.710 MVA of
transformation capacity
Presence in Colombia,
Peru, Bolivia, Brazil, Chile,
Panama and Central
America.
Largest continued
terrestrial network of the
continent.
26,700 kms of
optical fiber
Presence: Colombia,
Venezuela, Ecuador, Peru,
Chile, and Brazil. Equity
stake in REDCA (Central
America).
Largest operator of
private roads in Chile.
907 kms of roads in
operation in 5 road
concessions of the Route
in Chile.
Over 100 million vehicles.
Close to USD 400 million
in toll revenue.
Operates the National
Interconnected
System
Generation: 64,328 GWh
Demand: 63,571 GWh
Manages the Wholesale
Energy Market
Purchase and sale of
energy: COP 13.3 trillion
ISA is recognized as a company with broad technical experience, carrying
out its activities within the framework of corporate sustainability.
8
33
ISA
Colombia
Intercolombia
Transelca
XM
INTERNEXA
Peru
REP
Transmantaro
ISA Perú
PDI
INTERNEXA
Chile
INTERCHILE
INTERNEXA
INTERVIAL CHILE
Ruta del Maipo
Ruta del Maule
Ruta del Bosque
Rutla de la Araucania
Ruta de los Rios
ISA inversiones Chile
ISA inversiones Maule
Brazil
CTEEP
IEMG
PINHEIROS
SERRA DO JAPI
EVRECY
INTERNEXA
ISA Capital do Brasil
Others:
Ecuador
Bolivia
Argentina
Panama
Central America
Affiliates and
subsidiaries
8 Countries 1
Region:
Central America
4 Business
ISA has presence in Latin America through …
Limited growth in Colombia led ISA to an
evolution in the business model…
Leading energy
transmitter in COL.
Reduced growth
opportunities in COL
promoted
internationalization
process.
Entering new markets:
Peru, Bolivia, Brazil,
Central America.
ISA Peru, first
internationalization
achieved. COL-ECU
interconnection.
Consolidation
transmission business,
telecommunications.
Intervial Chile, first
diversification strategy
achieved. COL-PAN
interconnection.
INTERCHILE
1967-1994 1995-1999 2000-2006 2007-2013
Institutional
consolidation
New ISA
Geographic
expansion
Diversification
Consolidation
2014+ 9
Regional systems
interconnection and
Center-Coast
interconnection.
CND
COL-VEN
interconnection.
By 2020, ISA will
have tripled its
profits, by capturing
the most profitable
growth opportunities in
its businesses existing
in Latin America, the
boost of operational
efficiency and the
optimization of its
business portfolio.
Vision 2020
AGENDA
10
ISA in Brazil has a broad history and an
diversified investment…
11
In ISA’s
consolidated figures
(2014), Brazil
represents:
25,9% of the
revenues
16,0% of the EBITDA
23,9% of the Assets
2007-2012:
CTEEP participated
in ANEEL’s bidding
processes with
great success.
IEMadeira, IENNE,
IEMG,
IEPINHEIROS,
IESUL, SERRA DO
JAPI, IEGAR
ISA’s history in
Brazil started in
2006 by
purchasing 50.1%
of CTEEP’s
common shares
Annually, CTEEP,
invests USD 100
million approximately
in reinforcement
projects.
2007: ISA
acquired 39,28% of
CTEEP by a tender
offer
2013: ISA acquired
an information
transport network
company in Rio de
Janeiro.
2012: ISA started
operations in the
telecommunication
s business
ISA is the Colombian
company that has
made the largest
investments in Brazil.
Between 2006-2015:
BRL 11,3 billion
ISA reinforced its
commitment with
Brazil by signing the
concession contract
renewal in 2012
CTEEP’ s concession
contract 059 goes
from 2013 to 2042
1
2
3
4
5
AGENDA
12
2.528 2.540 2.557 2.570 2.589 2.615
2015 2016 2017 2018 2019 2020
COLOMBIA PERU BRAZIL CHILE OTHERS
An investment of USD 3.883 million supports ISA’s
future growth ...
13
by country COP %
Colombia 3.121 31,9
Peru 2.097 21,5
Brazil 1.991 20,3
Chile 2.549 26,2
Others 12 0,1
by business COP %
Energy 9.052 92,7
Toll Roads 167 1,7
Telecommunications 392 4,0
SMRTS 159 1,6
COP 9.769.711 million
USD 3.883 million
Projections: July 2015
Breakdown
COP billions
3.509
2.335
818
407 412
2.288
In Brazil, investments are in
reinforcement projects for an
average of USD 100 million
annually.
USD/COP
14
For nearly 50 years, ISA has been characterized by the
efficient and reliable delivery of its services, within a
framework of respect for human rights and environmental
protection in order to promote regional competitiveness
and sustainability, thanks to a highly qualified and
committed team consisting of more than 3,800 workers.
16
CTEEP
17
CTEEP: Timeline
CTEEP is constituted with
the transmission assets of
CESP
Incorporation of EPTE with
transmission assets of
Eletropaulo
Extension of Concession
Agreement 059/2001 with
ANEEL, beginning a new
cycle for its businesses
Startup of Operations of IE Madeira’s
transmission line and conclusion of work
ISA Group launches Vision 2020 with
focus on profitability and operational
efficiency
Signs up to Level 1 of
BM&FBovespa’s Corporate
Governance
Privatization, ISA
becomes the new
controller
2002 2006
2012 2013 2015
Expansion into 16 Brazilian states, the
result of participations in auctions and
acquisitions
Portfolio of businesses with
8 subsidiaries, investments of
R$ 6.2 billion and a RAP of R$ 670.2
MM
1999 2001
Start of
operations of
IE Garanhuns’
transmission
line
18
CTEEP today
Active participation in the
expansion of the transmission
system with investments in excess
of R$ 6 billion since 2007
Responsible for the
transmission of about 30% of the
energy produced in Brazil, 55% of
the energy consumed in the
Southeast and 98% in the state of
São Paulo
9 companies
with 18 th. Km of
TLs, 112
substations and
60.7 th. MVA of
transformation
capacity
Footprint in
the state of São
Paulo and 15
other states
R$ 10 billion
in assets
Strategic assets for the wholesale supply of
energy: São Paulo and important regional
interconnections (IEMadeira)
An ANEEL Benchmark Company in
Operational Efficiency and Quality
Indicators
19
CTEEP: Shareholding Breakdown
Capital Total
Preferred Shares - TRPL4
(60% of the total)
Common Shares - TRPL3
(40% of the total)
0.7%
9.8%
89.5%
52.4%
2.3%
31.2%
6.7%
7.4%
19.0%
4.0%
4.4%
35.4%
37.2%
Others
Vinci Ltda
Governo do Estado de SP
Eletrobras
ISA Capital do Brasil
Base: 30/09/2015
20
A ‘Multilatina’ company with a footprint in 8 countries, ISA has consolidated over the
course of more than 46 years of activities at its 33 companies, distributed across 4
sectors: electric energy transmission, highway concessions, telecommunications and
intelligent management of real time systems
ISA Group
1S15 ISA
1H15 EBITDA by
country
1S15 EBITDA 9M15 by
business
Colômbia
Chile
Peru
Brasil
Outros
41,1%
28,2%
15,6%
1,4%
13,6%
Transporte de Energia
Concessões Viárias
Telecomunicações
Gestão Inteligente de Tempo
Real
68%
2,8% 0,8%
28,4%
21
CTEEP: Investments
539
680 785
623
443
656
957
884
801
288
197
449
369
425 306
250
229
285
493
240 1552202
407
683
2010 2011
2.062
1.563
2015E
637
2012
1.976
2014
757
1.674
20132009
1.386
2008
610
2007
CTEEP Sócios nas SubsidiariasCTEEP nas Subsidiarias
Investments in excess of R $ 11 billion since 2007 , including investments in subsidiaries ,
directly or in partnership with partners
Participation in 14 of the 19 auctions between 2006 and 2012 , with supply in 48 lots
12 lots in operational phase and 1 lot with operation scheduled for November / 15
Investimentos 2007/2015E
(R$ MM corrigidos)
22
Results and Challenges
23
Vision 2020
24
Value Drivers
O&M
EFFICIENCY
Investments
RETURN
Subsidieries
GOVERNANCE
Indemnification
/DIT
FAIR VALUE
Contingencies
REDUCTION
Optimization
of Costs
Tax
Optimization
Optimization
of O&M Model
CapEx
Optimization
Inventory
Utilization
FIN/ADM
Centralization
of the 100%
subs. in CTEEP
Control of
IEMG and
Evrecy via COT
RBSE Report
Regulatory
Affairs Area
Strategic
Liabilities
Management
Project
25
Efficiency
Operations and Maintenance
Use of all that is most modern in technology – Control Centers, Substations
and Transmission Lines
Management of Operations and Maintenance by Processes, continuously
improved and certified
People are valued, highly trained and continuously developed with a focus on
the multidisciplinary approach and team spirit
ANEEL Benchmark Company
CTEEP’s operational strategy is based on excellence in the
rendering of services with a focus on the continuous creation
of value for the clients
CTEEP’s operational strategy is based on excellence in the
rendering of services with a focus on the continuous creation
of value for the clients
26
Efficiency
Execution of O&M optimization project:
reorganization of the regional offices,
optimization of headcount, review of scope and
renegotiation of contracts
Expected savings of R$ 7.5 million (2%) in
PMSO, despite higher inflation (200bps above
budget) and unbudgeted extraordinary
expenditure (Law 4819 and making a case
against the transfer of DITs).
PIS/COFINS credit on Inputs and Fixed Assets
Collective Bargaining Agreement: 8.2% wage
agreement
Readjustment of 10% in fixed profit sharing
value, food vouchers and basic basket of
goods
Changes in Profit Sharing values and
criteria with respect to meritocracy:
inclusion of Ebitda and Variable Parcel
indicators, aligned to Company goals
(QGI)
Operations and Maintenance
Rigorous cost control
2012
613
-13,8%
9M15
357
2014
455
2013
472
(*) exclui custos de construção e despesa de depreciação
+11.8%
9M15
613.2
2014
740.6
2013
586.6
2012
592.3
O&M Revenue (IFRS)
(R$ MM - IFRS)
OpEx*
(R$ MM - IFRS)
Controladas Controladora
27
In 9M15, we carried 98,835
GWh of the grid (SIN), or 25%
of the entire system’s load
Expected energy unsupplied in
9M15 was 286 MWh, just
0.0003% of total transmitted
energy
Efficiency
Operations and Maintenance
Transformer Uptime (time)Transmission Line Uptime (time)
2009
99,9339%
2008
99,8134%
2007
99,9961%
9M15
99,9987%
2014
99,9882%
2013
99,9949%
2012
99,9963%
2011
99,9900%
2010
99,9754%
200999,9521%2008
99,9306%
2007
99,9580%
9M15
99,9067%
2014
99,9414%
2013
99,9736%
2012
99,9500%
2011
99,9681%
2010
99,9575%
286
740
1.285
1.057
1.208
1.741
2009
1.230
20082007
1.332
2013 9M152014201220112010
623
Reduction in Expected Energy
Unsupplied (MWh)
28
Return
Strategy for supporting global returns through
inclusion of a cost reduction goal in the 2015
Budget
Internalization of inspection and commissioning
Prioritization in the use of inventory,
improvement in procurement process.
Execution with real gain of 5% on budget (goal)
Investments
Discipline in the allocation of resources
CapEx executed
(R$ MM - realizado)
688 591
264
225
219
289 132168
299
9M152014
-27,0%
507
2013
815
2012
952
ControladasControladora
Requests lodged with ANEEL
with immediate effect, begin the administrative process for revising the Price Bank with
respect to items included in the Resolutions.
issue new Authorization Resolutions (REAs) based on “market prices” quoted by CTEEP
and already shown in the administrative processes together with a new schedule for the
execution of work
Reduced financial execution in the Jan-Sep/15 period
29
Governance
Total investment of R$ 6.2 bi, CTEEP
capital injections of R$ 1.6 bi
15/16 RAP of R$ 682.8 million (45% total
RAP total*)
9M15 EBITDA of R$ 403,1 million
(margin of 88%)
Dividends of R$ 27.6 million paid to
CTEEP in 2015 (IEMadeira, IEJapi and
Evrecy)
IEGaranhuns
Schedule for startup in operations of
projects in november 2015
Subsidiaries
Portfólio totalmente operacional em 2015
E
S
P
BP
EA
L
IEMadeira
Conclusion of work in May 2014
Financial–economic rebalancing for Lot D requested of ANEEL
Surcharge: R$ 342 million / Loss of R$ 251milhões in RAP / Readjustment of 26.8% in
RAP
(*) Não ponderado pela participação nas coligadas (**) Ebitda Regulatório total das subsidiárias
30
Fair Value
With the purpose of reducing tariffs, MP 579
modified the method used to remunerate
investments, divided into: (i) sufficient revenue to
cover costs plus a profit margin for operations and
maintenance; and (ii) indemnification of assets
not fully amortized
CTEEP’s decision was essential for 100%
adherence of the transmission companies and
was based on trust in Brazilian institutions and
the creation of value through the fair
indemnification of the unamortized assets with a
view to recovering the Company’s investment
capacity and long-term growth
Indemnification
Extention of Conecession Agreement
40%
60%
RAP
(R$ million)
Indemnification
(R$ million)
358
158
495
Pre MP 579
2,150
1,655
-76%
Post MP 579
516
36%
RBNI
2.891
RBSE
5.186
64%
31
Fair Value
Indemnification
Background to the Process
MP 579
Sep/12
Law
12.783
Jan/13
RBNI
Jan/13
RBSE
ANEEL
Resolution
583
Dec/13
Evaluation
Report
Aug/14
ANEEL
Ratification
Decision on
Criteria
(MME)
ANEEL
Inspection
Oct/14
3.6053.7263.742
4.9385.0315.186
121161.196
93155
Post
Ins.Rep.
Revision
Report
Filed
Inspection
Mont. Rep.
NT SFF
196/2015
Inspection
Monitoring
Report
-24%
Revised
Report
CTEEP Current Difference ANEEL
Timeline of the Indemnification Amount (R$ million)
32
Fair Value
Comparison between New
Replacement Values recognized
by ANEEL and Transmission
Auction Values
(Bain&Company)
For transmission lines, the
recognized values are on
average 26% lower than those
prevailing at the auctions
For substations, ANEEL
recognized values on average
29% lower than prevailing at the
auctions
Indemnification
Aneel NRV vs Aneel Auctions
518
777
1.095
380312 384
664
873
314
161
440/500kV Total138kV 230kV 345kV
-26%
NRV Multiple Report (ANEEL Proposal)NRV Multiple Auctions
218191214184
542
156160110171
315
440/500kV345kV Total138kV 230kV
-28%
Substations
(R$ th / MVA)
Transmission Lines
(R$ th / KM)
33
Fair Value
Conditions for extension of the concession imply net reduction of 45% in Revenue CTEEP
( RAP after renovation + annuities equivalent to SE compensation at $ 3.7 billion
Conditions well below those of the Eletrobras companies ( 17% ) indicate the need to
persist in discussions with ANEEL on calculation criteria
Indemnification
Valor Glosa
CTEEP 2.208 522 2.891 3.743 -28% 201 494 1.217 -45%
FURNAS 2.308 637 2.878 8.999 -16% 200 1.188 2.026 -12%
CHESF 1.401 524 1.587 5.064 -10% 110 669 1.303 -7%
Eletronorte 1.115 280 1.682 2.633 -10% 117 348 744 -33%
Eletrosul 920 411 1.986 1.007 -5% 138 133 682 -26%
Grupo Eletrobras 5.745 1.852 8.133 17.704 -13% 565 2.338 4.755 -17%
Total 7.952 2.374 11.024 21.446 -16% 766 2.832 5.972 -25%
Concessionárias
Base: Dez/2012
Nova RAP
NI
(B)
SE
(com IR)
(D)
Com IR
em SE
(A+B+D)
∆%
Receita Anual
Permitida (RAP)
NI
Pós-
renovação
(A)
Pré-
renovação
SE
Indenizações Anuidades
CTEEP indemnity vs other utilities
34
Fair Value
Indemnification
Payment of indemnity by way of
electricity energy tariff
Payments on a reducing basis in
monthly installments
Restatement at the IPCA + capital
cost as from the baseline date of the
Report (12/31/2012)
Gross up of applicable direct and
indirect taxes
Sight payment of the amount
corresponding to the period from
Jan/2013 to the initial date of payment
Initial indemnity payment for each
Transmission Company as soon as the
respective amount is ratified
Report
Value
Financial
Restatement
Gross up
taxes
Indemnity
Value in Dec12
+
+ =
Indemnity
Value
Additional
RAP
Constant
amortization
system
+
Regulatory
charges
Payment Method: ABRATE Proposal
35
Considerations
Legal
Aspects
Transfer of more than 50%
of the assets covered by the
CTEEP concession
Legal insecurity triggered by two regulatory changes in less than three
years
Possible loss of the concession’s purpose
Technical
Aspects
Transfer of all the DIT
Significant part of CTEEP DIT bear no similarity to the traditional
distribution networks, the example of the complementary network
operated by the ONS (National Grid Operator)
DIT cannot be analyzed simply on the basis of voltage but rather on
the basis of the systematic function they exercise
Indemnificat
ion
Indemnification for all
investments executed post-
2012 based on ANEEL’s
Price Bank
(R$ 356 million )
According to the Federal Audit Court (TCU), the Price Bank constituted
in 2008 has not be updated
Does not take into account the tax levy
The effective restated cost of R$ 1,398 million (nominal value of R$
624 million, restated for inflation and regulatory WACC with taxes)
Revenue
from O&M
Decrease of Revenue does
not impact
economic/financial balance
CTEEP’s current RAP includes a 35% quality premium and an O&M
margin of 10% pursuant to NT ANEEL 383/2012
Indemnification for the loss of these future results is necessary to
ensure that the economic and financial balance of the agreement is
maintained. Expected impact amounts to R$ 688 million
Decrease in revenue income could trigger early repayment of loans
and sureties
Others
Transmission and
Distribution companies
decide other aspects
Necessary prior definition for equipment replacement; inventory; service
agreements signed by the Transmission Companies; Labor Relations
and cost, and regularization with transfer of properties
Technical Note
Summary of CTEEP’s contributions to Public Hearings
Transfer of Other Transmission Installations - DIT
36
Reduction
Supplementary Retirement Act 4819
Favorable decision of the Supreme Court in April of 4819 / 2015 ( defines the regular courts
as competent to proceed to judgment )
Association of Retired CESP Foundation filed an appeal against the decision and obtained
injunctive relief (maintenance of leaf payment until evaluation by regular courts )
In 14/10 the Supreme Court ruled on the embargo and confirmed the jurisdiction of the
ordinary courts and upheld the injunction of the Association of Retirees
Collection Suit 4819
There was judgment of the Collection CTEEP proposed action against the State of São
Paulo. The appeal of CTEEP was welcomed defining the jurisdiction of the regular courts ,
as well as a right to reimbursement of expenses 4,819 . CTEEP will appeal for a better
definition of funds entitled to reimbursement in sentencing
Process Eletropaulo / Eletrobras
Expert report of 16 September 2015 confirmed the Company's thesis
Contingencies
Status
(*) ex provisão de R$ 0,5 MM
37
Awards and Best Practices
CTEEP is the first electricity company to have the Quality Assessment Certification , an
international certification granted by The Institute of Internal Auditors (IIA ) , which aims
to recognize the quality of the areas of internal audit organizations.
A research and development project (R & D ) developed by CTEEP in partnership with the
Institute for Energy and Environment ( IEE ) at USP and CESP won recognition in the 1st
Innovation and Technology Award Solar Brazil . The study , which focuses on analyzing
the impacts of photovoltaics in the electrical system , was awarded in the category "
Award for best academic design innovation 2015 "
CTEEP was among the best companies in the yearbook Época Business 360, with the
47th position among the 250 best . The Company stood out in the sector in two
dimensions : Innovation Capacity ( 5th place ) and HR Practice ( 4th place )
Awards
38
Financial Results 3Q15
39
Allowed Annual Revenue (RAP) – increase of 16.4%;
Increase of 29.2% in Net Revenue;
EBITDA of R$ 343.9 million in 3Q15 and EBITDA Margin of 75.2%;
Net Income of 3Q15 reached R$ 276.3 million, an increase of 97.1%;
Decline of 24.0% in consolidated net debt in 3Q15 in relation to the end of 2014
and amounting to R$ 537.8 million;
Dividends of R$ 27.6 million paid by Evrecy, IEJapi and IEMadeira;
Holding of a Public Hearing on the issue of Other Transmission Installations
(DIT).
Confirmation of CTEEP’s Long Term Brazilian Corporate Rating of ‘AA+(bra)’
with stable outlook;
Amount and method of payment of RBSE still pending. Settlement now
expected as from July/2016.
IFRS Highlights 3Q15
40
IFRS - Gross Consolidated Revenue
+28,3%
3Q15 504,6
Others 0,1
Assets
Concession
72,6
O&M 16,6
Infrastructure 22,1
3Q14 393,2
+23,8%
9M15 1.104,5
9M14 891,9
Infrastructure: increase of 28.7%, largely due to the
increase in upgrading projects, substation construction,
transmission line reconstruction and the installation of
capacitor banks at CTEEP and the controlled
subsidiaries of Serra do Japi
O&M: increase of 7.7% largely due to the positive
variation in IPCA and IGP-M indices used to restate
O&M revenue comprising the 14/15 RAP to find the
15/16 RAP
Remuneration of Concession Assets: increase of
76.8% due to: (i) average balance of financial assets for
expected realization of construction values and
indemnification in favor of CTEEP and increased due to
monetary restatement and the startup of new
investments during the period and (ii) the monetary
restatement of financial flows for the 2015/2016 cycle
with respect to CAAE (Annual Cost of the Electricity
Assets) installment
Others: increase of R$ 0.3MM in rents and a decline of
R$ 0.2 MM in third party services
Aumento de 28,2%
(R$ millions)
ConsolidatedCompany
41
Regulatory – Consolidated Gross Revenue
+9.8%
3Q15 281.0
Others 0.1
The
electrical
Interconnection
Revenues
25.0
3Q14 255.9
+12.6%
9M15 746.0
9M14 662.5
Increase of 9.8% in 3Q15
Company Consolidated
Electric Energy Network Uptime:
i. monetary restatement of the 2014/2015
RAP cycle as the basis for the
2015/2016 RAP cycle (IPCA 8.47% and
IGP-M 4.11%)
ii. inclusion of the Annual Cost of Facilities
and Assets (CAIMI of R$ 28.7 MM in the
2015/2016 cycle) receivable and
iii. startup of operations of new
investments, increasing the RAP by R$
30.8 MM for the 2015/2016 cycle
Other Revenues:
i. increase of R$ 0.3 MM in rents and a
decline of R$ 0.2 MM in third party
services
(R$ millions)
42
Growth of 29.2% in Net Operating Revenue for 3Q15
IFRS - Consolidated Net Revenue
Deductions: in 3Q15, there was an
increase of 20.1% compared with 3Q14,
due to revenue taxes which match the
variation in operating revenue, and offset
by the rate established for PIS and
COFINS (3.65%) charges levied on the
subsidiaries which adopt the presumed
profit tax regime
Growth of 24.1% in Net Revenue for
9M15 compared with the same period in
2014.
Deduction
3Q15
-47,4
Gross
Revenue
3Q15
504,6
Net
Revenue
3Q15
457,2
9M15 989,9
9M14 797,4
+24,1%
Company Subsidiaries
(R$ millions)
43
Growth of 29.2% in Consolidated Net Revenue for 3Q15
Regulatory – Consolidated Net Revenue
Deductions: in 3Q15 there was an
increase of 20.1% compared with 3Q14,
due to revenue taxes which match the
variation in operating revenue, and offset
by the rate established for PIS and
COFINS (3.65%) charges levied on the
subsidiaries which adopt the presumed
profit tax regime
Growth of 24.1% in Net Revenue for
9M15 compared with the same period in
2014.
Deduction
3Q15
248.6
Net
Revenue
3Q15
-32.4
Gross
Revenue
3Q15
281.0
9M15 657.1
+12.0%
9M14 586.7
Company Subsidiaries
(R$ millions)
44
IFRS - Trend in Consolidated O&M Costs
and Expenses
9,4
8,0
7,1
+4.7%
3Q15 126.5
Others
Material
Services
Personnel
3Q14 120.8
+10.9%
9M15 362.9
9M14 327.2
Increase of 4.7% in 3Q15
Personnel: growth of 11.1% due to the
collective bargaining agreement resulting in an
8.2% increase granted in August 2015,
backdated to June 2015, termination costs with
the restructuring of the technical area and the
greater use made of company’s medical
services during the period
Services/Material: increase of 39.2% in
services and materials, above all due to the non-
recurring recovery of costs in 3Q14 which
reduced the comparative base for 3Q15
Others: reduction of 34.7% in contingency
expenses, reflecting the work on restatement of
amounts and probabilities for success in legal
actions which had inflated contingencies in
3Q14.
(R$ millions)
SubsidiariesCompany
45
Regulatory – Trend in Consolidated O&M
Costs and Expenses
5,8
-3.5%
3Q15 134.9
Others -8.6
Material
Services
-2.1
Personnel
3Q14 139.8
+5.9%
9M15 392.8
9M14 370.8
Personnel: growth of 11.1% due to the
collective bargaining agreement resulting in an
8.2% increase granted in August 2015,
backdated to June 2015, termination costs with
the restructuring of the technical area and the
greater use made of company’s medical
services during the period
Material/Services: reduction of 20.7% and
5.8%, respectively, due to (i) increased use of in-
house labor for operations and maintenance
services and (ii) redefinition of scope and
conditions of work
Others: reduction of 34.7% in contingency
expenses, reflecting the work on restatement of
amounts and probabilities for success in legal
actions which had inflated contingencies in
3Q14.
Reduction of 3.5%
Company Subsidiaries
(R$ millions)
46
IFRS - Equity Income Result
IEMadeira: in 3Q14, the RTP was booked to the
accounts, reducing the RAP for Lot D by 4.5% and
Lot F by 3.8%, decreasing the base used for
comparison with 3Q15. The adjustment of the RAP
2015/2016 cycle was R$ 110.8million for 3Q15.
The adjustment at the other subsidiaries had a net
impact of R$ 13.6 million.
Increase of 185.8% in 3Q15
25,9
85,6
0,7 7,8
7,34,3
+185.8%
3Q15
102.6
1.9
3Q14
35.9
5.0
IESULIEENEIEGaranhusIEMadeira
54,9
107,0
0,9
3,8 20,2
9M15
+91.0%
137.5
2.6 7.7
9M14
72.0
12.4
(R$ millions)
47
Regulatory – Equity Income Result
Increase of 45.9% in 3Q15
-45.9%
3Q15
16.5
-0.5
17.0
3Q14
30.5
-0.2
30.7
54.2
9M15
+71.0%
-0.1 -0.6
54.9
9M14
31.7
-0.6 -1.5
33.8
IESULIEENEIEMadeira
IEMadeira: Reduction of 44.6% in the result due to
the booking of adjustments to the RAP 2015/2016
cycle: (i) booking of the RTP for 2014, impacting the
2015/2016 cycle; (ii) booking of 3/12 of a negative
PA.
In addition, the result for IEMadeira was negatively
affected due to the increase in financial expenses as
a result of greater leverage as a result of debenture
issues.
(R$ millions)
48
IFRS - Consolidated Financial Result
-1,6
3Q15 -8.0
Others 2.0
Interest/
expenses
on loans
0.5
Monetary
(net)
Interest
Receivable
-8.0
3Q14 -0.9
9M15 -5.6
9M14 15.6
Reduction in monetary restatement revenue and
from interest in 3Q15 totaling R$ 7.3 million,
compared with R$ 16.8 million in 3Q14, reflecting
restatement at the IPCA + 5,59% of accounts
receivable by reversal – Law 12.783
RBNI receivables flow
(R$ millions)
Company Subsidiaries
49
Earnings per share were R$ 1.6526 in 3Q15
IFRS - Net Income
442,7
315,8
276,3
140,2
+40.2%
+97.1%
9M159M143Q153Q14
(R$ millions)
50
Earnings per share were R$ 0.3777 in 3Q15
Regulatory – Net Income
(R$ millions)
+6.2%
-28.7%
9M15
198.3
9M14
186.8
3Q15
65.2
3Q14
91.5
51
Consolidated EBITDA post ICVM 527
3Q15 3Q14 1H15 1H14 3T15 3T14 9M15 9M14
Net Income 276.3 140.1 442.7 315.8 65.2 91.5 198.3 186.8
Income tax and social contribuition 49.4 21.3 89.4 67.0 47.3 6.2 87.8 36.2
Financial Results 8.0 0.9 5.6 (15.6) 8.0 0.9 5.6 (15.6)
Depreciation and Amortization 10.2 10.5 30.7 31.0 21.0 19.6 61.5 57.4
EBITDA ICVM 527/12 343.9 172.7 568.3 398.3 141.4 118.2 353.2 264.8
Ebitda Margin
EBITDA Margin 75.2% 48.8% 57.4% 49.9% 56.9% 51.9% 53.7% 45.1%
REGULATORYEBITDA
(R$ million)
IFRS
52
Reduction of 24% in Net Debt
Net Debt
In June, settlement of the first interest payment for R$ 101.6 million on the 3rd
Debenture issue.
Monthly settlement of principal and interest in favor of BNDES for R$9.9 MM in
3Q15
3T152014
BNDES - TJLP
Debêntures - CDI/IPCA
Outros
BNDES - TJLP
Debêntures - CDI/IPCA
Outros
Debt 1,080.2 1,191.9 -9.4%
Short-term Debt 110.5 215.9 -48.8%
Long-term Debt 969.7 976.0 -0.6%
Cash 542.5 484.3 12.0%
Net Debt 537.8 707.6 -24.0%
Debt
(R$ million)
3Q15 2014 ∆%
47.9%52.0%
0.2%
45.7%
54.2%
0.1%
53
Cash and Cash Equivalents as at September 30, 2015:
R$542.5MM
Debt Amortization
2026 a 2030
52.4
4.6
47.8
2021 a 2025
164.8
69.0
95.8
2020
48.3
26.3
22.0
2019
50.4
26.3
24.1
2018
216.7
26.3
190.4
2017
237.1
26.4
210.7
2016
248.0
40.7
207.3
2015
62.5
9.6
52.9
SubsidiariesCompany
(R$ millions)
54
CTEEP’s participation
Debt of the Jointly Controlled Subsidiaries
Total: R$ 1,479.4Total: R$ 1,500.7
59.5% of debt of the jointly controlled subsidiaries in 3Q15 is indexed to the TJLP
No additional funding was raised 3Q15
16.0
175.9
1,233.2
54.2
IESulIEGaranhunsIEMadeira IENNE
56.3
17.4
184.8
1,242.2
3T15
2014
(R$ millions)
55
Closing prices of TRPL4 in 3Q15 was R$ 40.80
Capital Markets Performance
Principal events:
CTEEP’s market cap. at the end of September 2015 was R$ 6.715MM;
Average daily traded volume in 9M15 was R$12.5 MM
Average daily trades – 1,781
TRPL4 trade on all the days the Exchange was open for business
-35
-25
-15
-5
5
15
Jan/15 Fev/15 Mar/15 Abr/15 Mai/15 Jun/15 Jul/15 Ago/15 Set/15
Volume TRPL4 TRPL3 TRPL4 IBOVESPA IEE Volume Médio Diário TRPL4
-5,10%
-9,89%
-1,69%
-2,50%
R$ 12,5 Milhões
56
Q&A
57
THANKS
Investor Relations
Tel: +55 11 3138-7557
ri@cteep.com.br
www.cteep.com.br/
Canal Linha Ética
canalconfidencial.com.br/linhaeticacteep ou pelo telefone 0800 777 0775
58

Apimec 2015 ing

  • 1.
    1 APIMEC 2015 PRESENTATION OF3Q15 RESULTS São Paulo, October 27, 2015
  • 2.
  • 3.
    3 Disclaimer The statements inthis report with respect to the outlook for the Company’s businesses, the estimates and result and to the potential for growth, constitute mere forecasts and were based on management’s expectations in relation to the Company’s future. These expectations are highly dependent on changes in the market, the economic performance of Brazil, the sector and international markets, all of which are subject to change.
  • 4.
  • 5.
    Investor Presentation APIMEC 2015 SaoPaulo. October 27, 2015 The IR Recognition granted by the Colombian Securities Exchange (Bolsa de Valores de Colombia S.A) is not a certification of the registered securities or the solvency of the issuer
  • 6.
  • 7.
    Today, ISA isone of the largest company in Latin America… 7 ELECTRIC ENERGY TRANSPORT TOLL ROAD CONCESSIONS TELECOMMUNICATIONS TRANSPORT SMART MANAGEMENT OF REAL TIME SYSTEMS Largest international energy carrier in Latin America. 41,650 kms of high voltage circuit 77.710 MVA of transformation capacity Presence in Colombia, Peru, Bolivia, Brazil, Chile, Panama and Central America. Largest continued terrestrial network of the continent. 26,700 kms of optical fiber Presence: Colombia, Venezuela, Ecuador, Peru, Chile, and Brazil. Equity stake in REDCA (Central America). Largest operator of private roads in Chile. 907 kms of roads in operation in 5 road concessions of the Route in Chile. Over 100 million vehicles. Close to USD 400 million in toll revenue. Operates the National Interconnected System Generation: 64,328 GWh Demand: 63,571 GWh Manages the Wholesale Energy Market Purchase and sale of energy: COP 13.3 trillion
  • 8.
    ISA is recognizedas a company with broad technical experience, carrying out its activities within the framework of corporate sustainability. 8 33 ISA Colombia Intercolombia Transelca XM INTERNEXA Peru REP Transmantaro ISA Perú PDI INTERNEXA Chile INTERCHILE INTERNEXA INTERVIAL CHILE Ruta del Maipo Ruta del Maule Ruta del Bosque Rutla de la Araucania Ruta de los Rios ISA inversiones Chile ISA inversiones Maule Brazil CTEEP IEMG PINHEIROS SERRA DO JAPI EVRECY INTERNEXA ISA Capital do Brasil Others: Ecuador Bolivia Argentina Panama Central America Affiliates and subsidiaries 8 Countries 1 Region: Central America 4 Business ISA has presence in Latin America through …
  • 9.
    Limited growth inColombia led ISA to an evolution in the business model… Leading energy transmitter in COL. Reduced growth opportunities in COL promoted internationalization process. Entering new markets: Peru, Bolivia, Brazil, Central America. ISA Peru, first internationalization achieved. COL-ECU interconnection. Consolidation transmission business, telecommunications. Intervial Chile, first diversification strategy achieved. COL-PAN interconnection. INTERCHILE 1967-1994 1995-1999 2000-2006 2007-2013 Institutional consolidation New ISA Geographic expansion Diversification Consolidation 2014+ 9 Regional systems interconnection and Center-Coast interconnection. CND COL-VEN interconnection. By 2020, ISA will have tripled its profits, by capturing the most profitable growth opportunities in its businesses existing in Latin America, the boost of operational efficiency and the optimization of its business portfolio. Vision 2020
  • 10.
  • 11.
    ISA in Brazilhas a broad history and an diversified investment… 11 In ISA’s consolidated figures (2014), Brazil represents: 25,9% of the revenues 16,0% of the EBITDA 23,9% of the Assets 2007-2012: CTEEP participated in ANEEL’s bidding processes with great success. IEMadeira, IENNE, IEMG, IEPINHEIROS, IESUL, SERRA DO JAPI, IEGAR ISA’s history in Brazil started in 2006 by purchasing 50.1% of CTEEP’s common shares Annually, CTEEP, invests USD 100 million approximately in reinforcement projects. 2007: ISA acquired 39,28% of CTEEP by a tender offer 2013: ISA acquired an information transport network company in Rio de Janeiro. 2012: ISA started operations in the telecommunication s business ISA is the Colombian company that has made the largest investments in Brazil. Between 2006-2015: BRL 11,3 billion ISA reinforced its commitment with Brazil by signing the concession contract renewal in 2012 CTEEP’ s concession contract 059 goes from 2013 to 2042 1 2 3 4 5
  • 12.
  • 13.
    2.528 2.540 2.5572.570 2.589 2.615 2015 2016 2017 2018 2019 2020 COLOMBIA PERU BRAZIL CHILE OTHERS An investment of USD 3.883 million supports ISA’s future growth ... 13 by country COP % Colombia 3.121 31,9 Peru 2.097 21,5 Brazil 1.991 20,3 Chile 2.549 26,2 Others 12 0,1 by business COP % Energy 9.052 92,7 Toll Roads 167 1,7 Telecommunications 392 4,0 SMRTS 159 1,6 COP 9.769.711 million USD 3.883 million Projections: July 2015 Breakdown COP billions 3.509 2.335 818 407 412 2.288 In Brazil, investments are in reinforcement projects for an average of USD 100 million annually. USD/COP
  • 14.
    14 For nearly 50years, ISA has been characterized by the efficient and reliable delivery of its services, within a framework of respect for human rights and environmental protection in order to promote regional competitiveness and sustainability, thanks to a highly qualified and committed team consisting of more than 3,800 workers.
  • 16.
  • 17.
    17 CTEEP: Timeline CTEEP isconstituted with the transmission assets of CESP Incorporation of EPTE with transmission assets of Eletropaulo Extension of Concession Agreement 059/2001 with ANEEL, beginning a new cycle for its businesses Startup of Operations of IE Madeira’s transmission line and conclusion of work ISA Group launches Vision 2020 with focus on profitability and operational efficiency Signs up to Level 1 of BM&FBovespa’s Corporate Governance Privatization, ISA becomes the new controller 2002 2006 2012 2013 2015 Expansion into 16 Brazilian states, the result of participations in auctions and acquisitions Portfolio of businesses with 8 subsidiaries, investments of R$ 6.2 billion and a RAP of R$ 670.2 MM 1999 2001 Start of operations of IE Garanhuns’ transmission line
  • 18.
    18 CTEEP today Active participationin the expansion of the transmission system with investments in excess of R$ 6 billion since 2007 Responsible for the transmission of about 30% of the energy produced in Brazil, 55% of the energy consumed in the Southeast and 98% in the state of São Paulo 9 companies with 18 th. Km of TLs, 112 substations and 60.7 th. MVA of transformation capacity Footprint in the state of São Paulo and 15 other states R$ 10 billion in assets Strategic assets for the wholesale supply of energy: São Paulo and important regional interconnections (IEMadeira) An ANEEL Benchmark Company in Operational Efficiency and Quality Indicators
  • 19.
    19 CTEEP: Shareholding Breakdown CapitalTotal Preferred Shares - TRPL4 (60% of the total) Common Shares - TRPL3 (40% of the total) 0.7% 9.8% 89.5% 52.4% 2.3% 31.2% 6.7% 7.4% 19.0% 4.0% 4.4% 35.4% 37.2% Others Vinci Ltda Governo do Estado de SP Eletrobras ISA Capital do Brasil Base: 30/09/2015
  • 20.
    20 A ‘Multilatina’ companywith a footprint in 8 countries, ISA has consolidated over the course of more than 46 years of activities at its 33 companies, distributed across 4 sectors: electric energy transmission, highway concessions, telecommunications and intelligent management of real time systems ISA Group 1S15 ISA 1H15 EBITDA by country 1S15 EBITDA 9M15 by business Colômbia Chile Peru Brasil Outros 41,1% 28,2% 15,6% 1,4% 13,6% Transporte de Energia Concessões Viárias Telecomunicações Gestão Inteligente de Tempo Real 68% 2,8% 0,8% 28,4%
  • 21.
    21 CTEEP: Investments 539 680 785 623 443 656 957 884 801 288 197 449 369 425306 250 229 285 493 240 1552202 407 683 2010 2011 2.062 1.563 2015E 637 2012 1.976 2014 757 1.674 20132009 1.386 2008 610 2007 CTEEP Sócios nas SubsidiariasCTEEP nas Subsidiarias Investments in excess of R $ 11 billion since 2007 , including investments in subsidiaries , directly or in partnership with partners Participation in 14 of the 19 auctions between 2006 and 2012 , with supply in 48 lots 12 lots in operational phase and 1 lot with operation scheduled for November / 15 Investimentos 2007/2015E (R$ MM corrigidos)
  • 22.
  • 23.
  • 24.
    24 Value Drivers O&M EFFICIENCY Investments RETURN Subsidieries GOVERNANCE Indemnification /DIT FAIR VALUE Contingencies REDUCTION Optimization ofCosts Tax Optimization Optimization of O&M Model CapEx Optimization Inventory Utilization FIN/ADM Centralization of the 100% subs. in CTEEP Control of IEMG and Evrecy via COT RBSE Report Regulatory Affairs Area Strategic Liabilities Management Project
  • 25.
    25 Efficiency Operations and Maintenance Useof all that is most modern in technology – Control Centers, Substations and Transmission Lines Management of Operations and Maintenance by Processes, continuously improved and certified People are valued, highly trained and continuously developed with a focus on the multidisciplinary approach and team spirit ANEEL Benchmark Company CTEEP’s operational strategy is based on excellence in the rendering of services with a focus on the continuous creation of value for the clients CTEEP’s operational strategy is based on excellence in the rendering of services with a focus on the continuous creation of value for the clients
  • 26.
    26 Efficiency Execution of O&Moptimization project: reorganization of the regional offices, optimization of headcount, review of scope and renegotiation of contracts Expected savings of R$ 7.5 million (2%) in PMSO, despite higher inflation (200bps above budget) and unbudgeted extraordinary expenditure (Law 4819 and making a case against the transfer of DITs). PIS/COFINS credit on Inputs and Fixed Assets Collective Bargaining Agreement: 8.2% wage agreement Readjustment of 10% in fixed profit sharing value, food vouchers and basic basket of goods Changes in Profit Sharing values and criteria with respect to meritocracy: inclusion of Ebitda and Variable Parcel indicators, aligned to Company goals (QGI) Operations and Maintenance Rigorous cost control 2012 613 -13,8% 9M15 357 2014 455 2013 472 (*) exclui custos de construção e despesa de depreciação +11.8% 9M15 613.2 2014 740.6 2013 586.6 2012 592.3 O&M Revenue (IFRS) (R$ MM - IFRS) OpEx* (R$ MM - IFRS) Controladas Controladora
  • 27.
    27 In 9M15, wecarried 98,835 GWh of the grid (SIN), or 25% of the entire system’s load Expected energy unsupplied in 9M15 was 286 MWh, just 0.0003% of total transmitted energy Efficiency Operations and Maintenance Transformer Uptime (time)Transmission Line Uptime (time) 2009 99,9339% 2008 99,8134% 2007 99,9961% 9M15 99,9987% 2014 99,9882% 2013 99,9949% 2012 99,9963% 2011 99,9900% 2010 99,9754% 200999,9521%2008 99,9306% 2007 99,9580% 9M15 99,9067% 2014 99,9414% 2013 99,9736% 2012 99,9500% 2011 99,9681% 2010 99,9575% 286 740 1.285 1.057 1.208 1.741 2009 1.230 20082007 1.332 2013 9M152014201220112010 623 Reduction in Expected Energy Unsupplied (MWh)
  • 28.
    28 Return Strategy for supportingglobal returns through inclusion of a cost reduction goal in the 2015 Budget Internalization of inspection and commissioning Prioritization in the use of inventory, improvement in procurement process. Execution with real gain of 5% on budget (goal) Investments Discipline in the allocation of resources CapEx executed (R$ MM - realizado) 688 591 264 225 219 289 132168 299 9M152014 -27,0% 507 2013 815 2012 952 ControladasControladora Requests lodged with ANEEL with immediate effect, begin the administrative process for revising the Price Bank with respect to items included in the Resolutions. issue new Authorization Resolutions (REAs) based on “market prices” quoted by CTEEP and already shown in the administrative processes together with a new schedule for the execution of work Reduced financial execution in the Jan-Sep/15 period
  • 29.
    29 Governance Total investment ofR$ 6.2 bi, CTEEP capital injections of R$ 1.6 bi 15/16 RAP of R$ 682.8 million (45% total RAP total*) 9M15 EBITDA of R$ 403,1 million (margin of 88%) Dividends of R$ 27.6 million paid to CTEEP in 2015 (IEMadeira, IEJapi and Evrecy) IEGaranhuns Schedule for startup in operations of projects in november 2015 Subsidiaries Portfólio totalmente operacional em 2015 E S P BP EA L IEMadeira Conclusion of work in May 2014 Financial–economic rebalancing for Lot D requested of ANEEL Surcharge: R$ 342 million / Loss of R$ 251milhões in RAP / Readjustment of 26.8% in RAP (*) Não ponderado pela participação nas coligadas (**) Ebitda Regulatório total das subsidiárias
  • 30.
    30 Fair Value With thepurpose of reducing tariffs, MP 579 modified the method used to remunerate investments, divided into: (i) sufficient revenue to cover costs plus a profit margin for operations and maintenance; and (ii) indemnification of assets not fully amortized CTEEP’s decision was essential for 100% adherence of the transmission companies and was based on trust in Brazilian institutions and the creation of value through the fair indemnification of the unamortized assets with a view to recovering the Company’s investment capacity and long-term growth Indemnification Extention of Conecession Agreement 40% 60% RAP (R$ million) Indemnification (R$ million) 358 158 495 Pre MP 579 2,150 1,655 -76% Post MP 579 516 36% RBNI 2.891 RBSE 5.186 64%
  • 31.
    31 Fair Value Indemnification Background tothe Process MP 579 Sep/12 Law 12.783 Jan/13 RBNI Jan/13 RBSE ANEEL Resolution 583 Dec/13 Evaluation Report Aug/14 ANEEL Ratification Decision on Criteria (MME) ANEEL Inspection Oct/14 3.6053.7263.742 4.9385.0315.186 121161.196 93155 Post Ins.Rep. Revision Report Filed Inspection Mont. Rep. NT SFF 196/2015 Inspection Monitoring Report -24% Revised Report CTEEP Current Difference ANEEL Timeline of the Indemnification Amount (R$ million)
  • 32.
    32 Fair Value Comparison betweenNew Replacement Values recognized by ANEEL and Transmission Auction Values (Bain&Company) For transmission lines, the recognized values are on average 26% lower than those prevailing at the auctions For substations, ANEEL recognized values on average 29% lower than prevailing at the auctions Indemnification Aneel NRV vs Aneel Auctions 518 777 1.095 380312 384 664 873 314 161 440/500kV Total138kV 230kV 345kV -26% NRV Multiple Report (ANEEL Proposal)NRV Multiple Auctions 218191214184 542 156160110171 315 440/500kV345kV Total138kV 230kV -28% Substations (R$ th / MVA) Transmission Lines (R$ th / KM)
  • 33.
    33 Fair Value Conditions forextension of the concession imply net reduction of 45% in Revenue CTEEP ( RAP after renovation + annuities equivalent to SE compensation at $ 3.7 billion Conditions well below those of the Eletrobras companies ( 17% ) indicate the need to persist in discussions with ANEEL on calculation criteria Indemnification Valor Glosa CTEEP 2.208 522 2.891 3.743 -28% 201 494 1.217 -45% FURNAS 2.308 637 2.878 8.999 -16% 200 1.188 2.026 -12% CHESF 1.401 524 1.587 5.064 -10% 110 669 1.303 -7% Eletronorte 1.115 280 1.682 2.633 -10% 117 348 744 -33% Eletrosul 920 411 1.986 1.007 -5% 138 133 682 -26% Grupo Eletrobras 5.745 1.852 8.133 17.704 -13% 565 2.338 4.755 -17% Total 7.952 2.374 11.024 21.446 -16% 766 2.832 5.972 -25% Concessionárias Base: Dez/2012 Nova RAP NI (B) SE (com IR) (D) Com IR em SE (A+B+D) ∆% Receita Anual Permitida (RAP) NI Pós- renovação (A) Pré- renovação SE Indenizações Anuidades CTEEP indemnity vs other utilities
  • 34.
    34 Fair Value Indemnification Payment ofindemnity by way of electricity energy tariff Payments on a reducing basis in monthly installments Restatement at the IPCA + capital cost as from the baseline date of the Report (12/31/2012) Gross up of applicable direct and indirect taxes Sight payment of the amount corresponding to the period from Jan/2013 to the initial date of payment Initial indemnity payment for each Transmission Company as soon as the respective amount is ratified Report Value Financial Restatement Gross up taxes Indemnity Value in Dec12 + + = Indemnity Value Additional RAP Constant amortization system + Regulatory charges Payment Method: ABRATE Proposal
  • 35.
    35 Considerations Legal Aspects Transfer of morethan 50% of the assets covered by the CTEEP concession Legal insecurity triggered by two regulatory changes in less than three years Possible loss of the concession’s purpose Technical Aspects Transfer of all the DIT Significant part of CTEEP DIT bear no similarity to the traditional distribution networks, the example of the complementary network operated by the ONS (National Grid Operator) DIT cannot be analyzed simply on the basis of voltage but rather on the basis of the systematic function they exercise Indemnificat ion Indemnification for all investments executed post- 2012 based on ANEEL’s Price Bank (R$ 356 million ) According to the Federal Audit Court (TCU), the Price Bank constituted in 2008 has not be updated Does not take into account the tax levy The effective restated cost of R$ 1,398 million (nominal value of R$ 624 million, restated for inflation and regulatory WACC with taxes) Revenue from O&M Decrease of Revenue does not impact economic/financial balance CTEEP’s current RAP includes a 35% quality premium and an O&M margin of 10% pursuant to NT ANEEL 383/2012 Indemnification for the loss of these future results is necessary to ensure that the economic and financial balance of the agreement is maintained. Expected impact amounts to R$ 688 million Decrease in revenue income could trigger early repayment of loans and sureties Others Transmission and Distribution companies decide other aspects Necessary prior definition for equipment replacement; inventory; service agreements signed by the Transmission Companies; Labor Relations and cost, and regularization with transfer of properties Technical Note Summary of CTEEP’s contributions to Public Hearings Transfer of Other Transmission Installations - DIT
  • 36.
    36 Reduction Supplementary Retirement Act4819 Favorable decision of the Supreme Court in April of 4819 / 2015 ( defines the regular courts as competent to proceed to judgment ) Association of Retired CESP Foundation filed an appeal against the decision and obtained injunctive relief (maintenance of leaf payment until evaluation by regular courts ) In 14/10 the Supreme Court ruled on the embargo and confirmed the jurisdiction of the ordinary courts and upheld the injunction of the Association of Retirees Collection Suit 4819 There was judgment of the Collection CTEEP proposed action against the State of São Paulo. The appeal of CTEEP was welcomed defining the jurisdiction of the regular courts , as well as a right to reimbursement of expenses 4,819 . CTEEP will appeal for a better definition of funds entitled to reimbursement in sentencing Process Eletropaulo / Eletrobras Expert report of 16 September 2015 confirmed the Company's thesis Contingencies Status (*) ex provisão de R$ 0,5 MM
  • 37.
    37 Awards and BestPractices CTEEP is the first electricity company to have the Quality Assessment Certification , an international certification granted by The Institute of Internal Auditors (IIA ) , which aims to recognize the quality of the areas of internal audit organizations. A research and development project (R & D ) developed by CTEEP in partnership with the Institute for Energy and Environment ( IEE ) at USP and CESP won recognition in the 1st Innovation and Technology Award Solar Brazil . The study , which focuses on analyzing the impacts of photovoltaics in the electrical system , was awarded in the category " Award for best academic design innovation 2015 " CTEEP was among the best companies in the yearbook Época Business 360, with the 47th position among the 250 best . The Company stood out in the sector in two dimensions : Innovation Capacity ( 5th place ) and HR Practice ( 4th place ) Awards
  • 38.
  • 39.
    39 Allowed Annual Revenue(RAP) – increase of 16.4%; Increase of 29.2% in Net Revenue; EBITDA of R$ 343.9 million in 3Q15 and EBITDA Margin of 75.2%; Net Income of 3Q15 reached R$ 276.3 million, an increase of 97.1%; Decline of 24.0% in consolidated net debt in 3Q15 in relation to the end of 2014 and amounting to R$ 537.8 million; Dividends of R$ 27.6 million paid by Evrecy, IEJapi and IEMadeira; Holding of a Public Hearing on the issue of Other Transmission Installations (DIT). Confirmation of CTEEP’s Long Term Brazilian Corporate Rating of ‘AA+(bra)’ with stable outlook; Amount and method of payment of RBSE still pending. Settlement now expected as from July/2016. IFRS Highlights 3Q15
  • 40.
    40 IFRS - GrossConsolidated Revenue +28,3% 3Q15 504,6 Others 0,1 Assets Concession 72,6 O&M 16,6 Infrastructure 22,1 3Q14 393,2 +23,8% 9M15 1.104,5 9M14 891,9 Infrastructure: increase of 28.7%, largely due to the increase in upgrading projects, substation construction, transmission line reconstruction and the installation of capacitor banks at CTEEP and the controlled subsidiaries of Serra do Japi O&M: increase of 7.7% largely due to the positive variation in IPCA and IGP-M indices used to restate O&M revenue comprising the 14/15 RAP to find the 15/16 RAP Remuneration of Concession Assets: increase of 76.8% due to: (i) average balance of financial assets for expected realization of construction values and indemnification in favor of CTEEP and increased due to monetary restatement and the startup of new investments during the period and (ii) the monetary restatement of financial flows for the 2015/2016 cycle with respect to CAAE (Annual Cost of the Electricity Assets) installment Others: increase of R$ 0.3MM in rents and a decline of R$ 0.2 MM in third party services Aumento de 28,2% (R$ millions) ConsolidatedCompany
  • 41.
    41 Regulatory – ConsolidatedGross Revenue +9.8% 3Q15 281.0 Others 0.1 The electrical Interconnection Revenues 25.0 3Q14 255.9 +12.6% 9M15 746.0 9M14 662.5 Increase of 9.8% in 3Q15 Company Consolidated Electric Energy Network Uptime: i. monetary restatement of the 2014/2015 RAP cycle as the basis for the 2015/2016 RAP cycle (IPCA 8.47% and IGP-M 4.11%) ii. inclusion of the Annual Cost of Facilities and Assets (CAIMI of R$ 28.7 MM in the 2015/2016 cycle) receivable and iii. startup of operations of new investments, increasing the RAP by R$ 30.8 MM for the 2015/2016 cycle Other Revenues: i. increase of R$ 0.3 MM in rents and a decline of R$ 0.2 MM in third party services (R$ millions)
  • 42.
    42 Growth of 29.2%in Net Operating Revenue for 3Q15 IFRS - Consolidated Net Revenue Deductions: in 3Q15, there was an increase of 20.1% compared with 3Q14, due to revenue taxes which match the variation in operating revenue, and offset by the rate established for PIS and COFINS (3.65%) charges levied on the subsidiaries which adopt the presumed profit tax regime Growth of 24.1% in Net Revenue for 9M15 compared with the same period in 2014. Deduction 3Q15 -47,4 Gross Revenue 3Q15 504,6 Net Revenue 3Q15 457,2 9M15 989,9 9M14 797,4 +24,1% Company Subsidiaries (R$ millions)
  • 43.
    43 Growth of 29.2%in Consolidated Net Revenue for 3Q15 Regulatory – Consolidated Net Revenue Deductions: in 3Q15 there was an increase of 20.1% compared with 3Q14, due to revenue taxes which match the variation in operating revenue, and offset by the rate established for PIS and COFINS (3.65%) charges levied on the subsidiaries which adopt the presumed profit tax regime Growth of 24.1% in Net Revenue for 9M15 compared with the same period in 2014. Deduction 3Q15 248.6 Net Revenue 3Q15 -32.4 Gross Revenue 3Q15 281.0 9M15 657.1 +12.0% 9M14 586.7 Company Subsidiaries (R$ millions)
  • 44.
    44 IFRS - Trendin Consolidated O&M Costs and Expenses 9,4 8,0 7,1 +4.7% 3Q15 126.5 Others Material Services Personnel 3Q14 120.8 +10.9% 9M15 362.9 9M14 327.2 Increase of 4.7% in 3Q15 Personnel: growth of 11.1% due to the collective bargaining agreement resulting in an 8.2% increase granted in August 2015, backdated to June 2015, termination costs with the restructuring of the technical area and the greater use made of company’s medical services during the period Services/Material: increase of 39.2% in services and materials, above all due to the non- recurring recovery of costs in 3Q14 which reduced the comparative base for 3Q15 Others: reduction of 34.7% in contingency expenses, reflecting the work on restatement of amounts and probabilities for success in legal actions which had inflated contingencies in 3Q14. (R$ millions) SubsidiariesCompany
  • 45.
    45 Regulatory – Trendin Consolidated O&M Costs and Expenses 5,8 -3.5% 3Q15 134.9 Others -8.6 Material Services -2.1 Personnel 3Q14 139.8 +5.9% 9M15 392.8 9M14 370.8 Personnel: growth of 11.1% due to the collective bargaining agreement resulting in an 8.2% increase granted in August 2015, backdated to June 2015, termination costs with the restructuring of the technical area and the greater use made of company’s medical services during the period Material/Services: reduction of 20.7% and 5.8%, respectively, due to (i) increased use of in- house labor for operations and maintenance services and (ii) redefinition of scope and conditions of work Others: reduction of 34.7% in contingency expenses, reflecting the work on restatement of amounts and probabilities for success in legal actions which had inflated contingencies in 3Q14. Reduction of 3.5% Company Subsidiaries (R$ millions)
  • 46.
    46 IFRS - EquityIncome Result IEMadeira: in 3Q14, the RTP was booked to the accounts, reducing the RAP for Lot D by 4.5% and Lot F by 3.8%, decreasing the base used for comparison with 3Q15. The adjustment of the RAP 2015/2016 cycle was R$ 110.8million for 3Q15. The adjustment at the other subsidiaries had a net impact of R$ 13.6 million. Increase of 185.8% in 3Q15 25,9 85,6 0,7 7,8 7,34,3 +185.8% 3Q15 102.6 1.9 3Q14 35.9 5.0 IESULIEENEIEGaranhusIEMadeira 54,9 107,0 0,9 3,8 20,2 9M15 +91.0% 137.5 2.6 7.7 9M14 72.0 12.4 (R$ millions)
  • 47.
    47 Regulatory – EquityIncome Result Increase of 45.9% in 3Q15 -45.9% 3Q15 16.5 -0.5 17.0 3Q14 30.5 -0.2 30.7 54.2 9M15 +71.0% -0.1 -0.6 54.9 9M14 31.7 -0.6 -1.5 33.8 IESULIEENEIEMadeira IEMadeira: Reduction of 44.6% in the result due to the booking of adjustments to the RAP 2015/2016 cycle: (i) booking of the RTP for 2014, impacting the 2015/2016 cycle; (ii) booking of 3/12 of a negative PA. In addition, the result for IEMadeira was negatively affected due to the increase in financial expenses as a result of greater leverage as a result of debenture issues. (R$ millions)
  • 48.
    48 IFRS - ConsolidatedFinancial Result -1,6 3Q15 -8.0 Others 2.0 Interest/ expenses on loans 0.5 Monetary (net) Interest Receivable -8.0 3Q14 -0.9 9M15 -5.6 9M14 15.6 Reduction in monetary restatement revenue and from interest in 3Q15 totaling R$ 7.3 million, compared with R$ 16.8 million in 3Q14, reflecting restatement at the IPCA + 5,59% of accounts receivable by reversal – Law 12.783 RBNI receivables flow (R$ millions) Company Subsidiaries
  • 49.
    49 Earnings per sharewere R$ 1.6526 in 3Q15 IFRS - Net Income 442,7 315,8 276,3 140,2 +40.2% +97.1% 9M159M143Q153Q14 (R$ millions)
  • 50.
    50 Earnings per sharewere R$ 0.3777 in 3Q15 Regulatory – Net Income (R$ millions) +6.2% -28.7% 9M15 198.3 9M14 186.8 3Q15 65.2 3Q14 91.5
  • 51.
    51 Consolidated EBITDA postICVM 527 3Q15 3Q14 1H15 1H14 3T15 3T14 9M15 9M14 Net Income 276.3 140.1 442.7 315.8 65.2 91.5 198.3 186.8 Income tax and social contribuition 49.4 21.3 89.4 67.0 47.3 6.2 87.8 36.2 Financial Results 8.0 0.9 5.6 (15.6) 8.0 0.9 5.6 (15.6) Depreciation and Amortization 10.2 10.5 30.7 31.0 21.0 19.6 61.5 57.4 EBITDA ICVM 527/12 343.9 172.7 568.3 398.3 141.4 118.2 353.2 264.8 Ebitda Margin EBITDA Margin 75.2% 48.8% 57.4% 49.9% 56.9% 51.9% 53.7% 45.1% REGULATORYEBITDA (R$ million) IFRS
  • 52.
    52 Reduction of 24%in Net Debt Net Debt In June, settlement of the first interest payment for R$ 101.6 million on the 3rd Debenture issue. Monthly settlement of principal and interest in favor of BNDES for R$9.9 MM in 3Q15 3T152014 BNDES - TJLP Debêntures - CDI/IPCA Outros BNDES - TJLP Debêntures - CDI/IPCA Outros Debt 1,080.2 1,191.9 -9.4% Short-term Debt 110.5 215.9 -48.8% Long-term Debt 969.7 976.0 -0.6% Cash 542.5 484.3 12.0% Net Debt 537.8 707.6 -24.0% Debt (R$ million) 3Q15 2014 ∆% 47.9%52.0% 0.2% 45.7% 54.2% 0.1%
  • 53.
    53 Cash and CashEquivalents as at September 30, 2015: R$542.5MM Debt Amortization 2026 a 2030 52.4 4.6 47.8 2021 a 2025 164.8 69.0 95.8 2020 48.3 26.3 22.0 2019 50.4 26.3 24.1 2018 216.7 26.3 190.4 2017 237.1 26.4 210.7 2016 248.0 40.7 207.3 2015 62.5 9.6 52.9 SubsidiariesCompany (R$ millions)
  • 54.
    54 CTEEP’s participation Debt ofthe Jointly Controlled Subsidiaries Total: R$ 1,479.4Total: R$ 1,500.7 59.5% of debt of the jointly controlled subsidiaries in 3Q15 is indexed to the TJLP No additional funding was raised 3Q15 16.0 175.9 1,233.2 54.2 IESulIEGaranhunsIEMadeira IENNE 56.3 17.4 184.8 1,242.2 3T15 2014 (R$ millions)
  • 55.
    55 Closing prices ofTRPL4 in 3Q15 was R$ 40.80 Capital Markets Performance Principal events: CTEEP’s market cap. at the end of September 2015 was R$ 6.715MM; Average daily traded volume in 9M15 was R$12.5 MM Average daily trades – 1,781 TRPL4 trade on all the days the Exchange was open for business -35 -25 -15 -5 5 15 Jan/15 Fev/15 Mar/15 Abr/15 Mai/15 Jun/15 Jul/15 Ago/15 Set/15 Volume TRPL4 TRPL3 TRPL4 IBOVESPA IEE Volume Médio Diário TRPL4 -5,10% -9,89% -1,69% -2,50% R$ 12,5 Milhões
  • 56.
  • 57.
    57 THANKS Investor Relations Tel: +5511 3138-7557 ri@cteep.com.br www.cteep.com.br/ Canal Linha Ética canalconfidencial.com.br/linhaeticacteep ou pelo telefone 0800 777 0775
  • 58.