Download to read offline


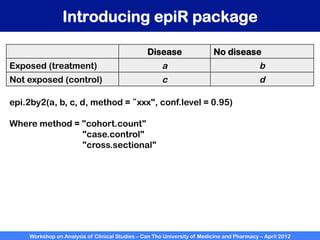


A workshop on analysis of clinical studies was held at Can Tho University of Medicine and Pharmacy in April 2012. The workshop covered topics such as comparing groups using categorical data, metrics to measure treatment effect such as difference, relative risk, odds ratio, and number needed to treat. Examples of randomized controlled trials, case-control studies, and cohort studies were presented to illustrate the appropriate effect measures and statistical tests for different study designs. R software was introduced to demonstrate how to calculate confidence intervals for differences, relative risks, and odds ratios.


![Medical statistics Basic concept and applications [Square one]](https://cdn.slidesharecdn.com/ss_thumbnails/medicalstatisticsl123m-131208222631-phpapp02-thumbnail.jpg?width=640&height=640&fit=bounds)


