Download as PDF, PPTX

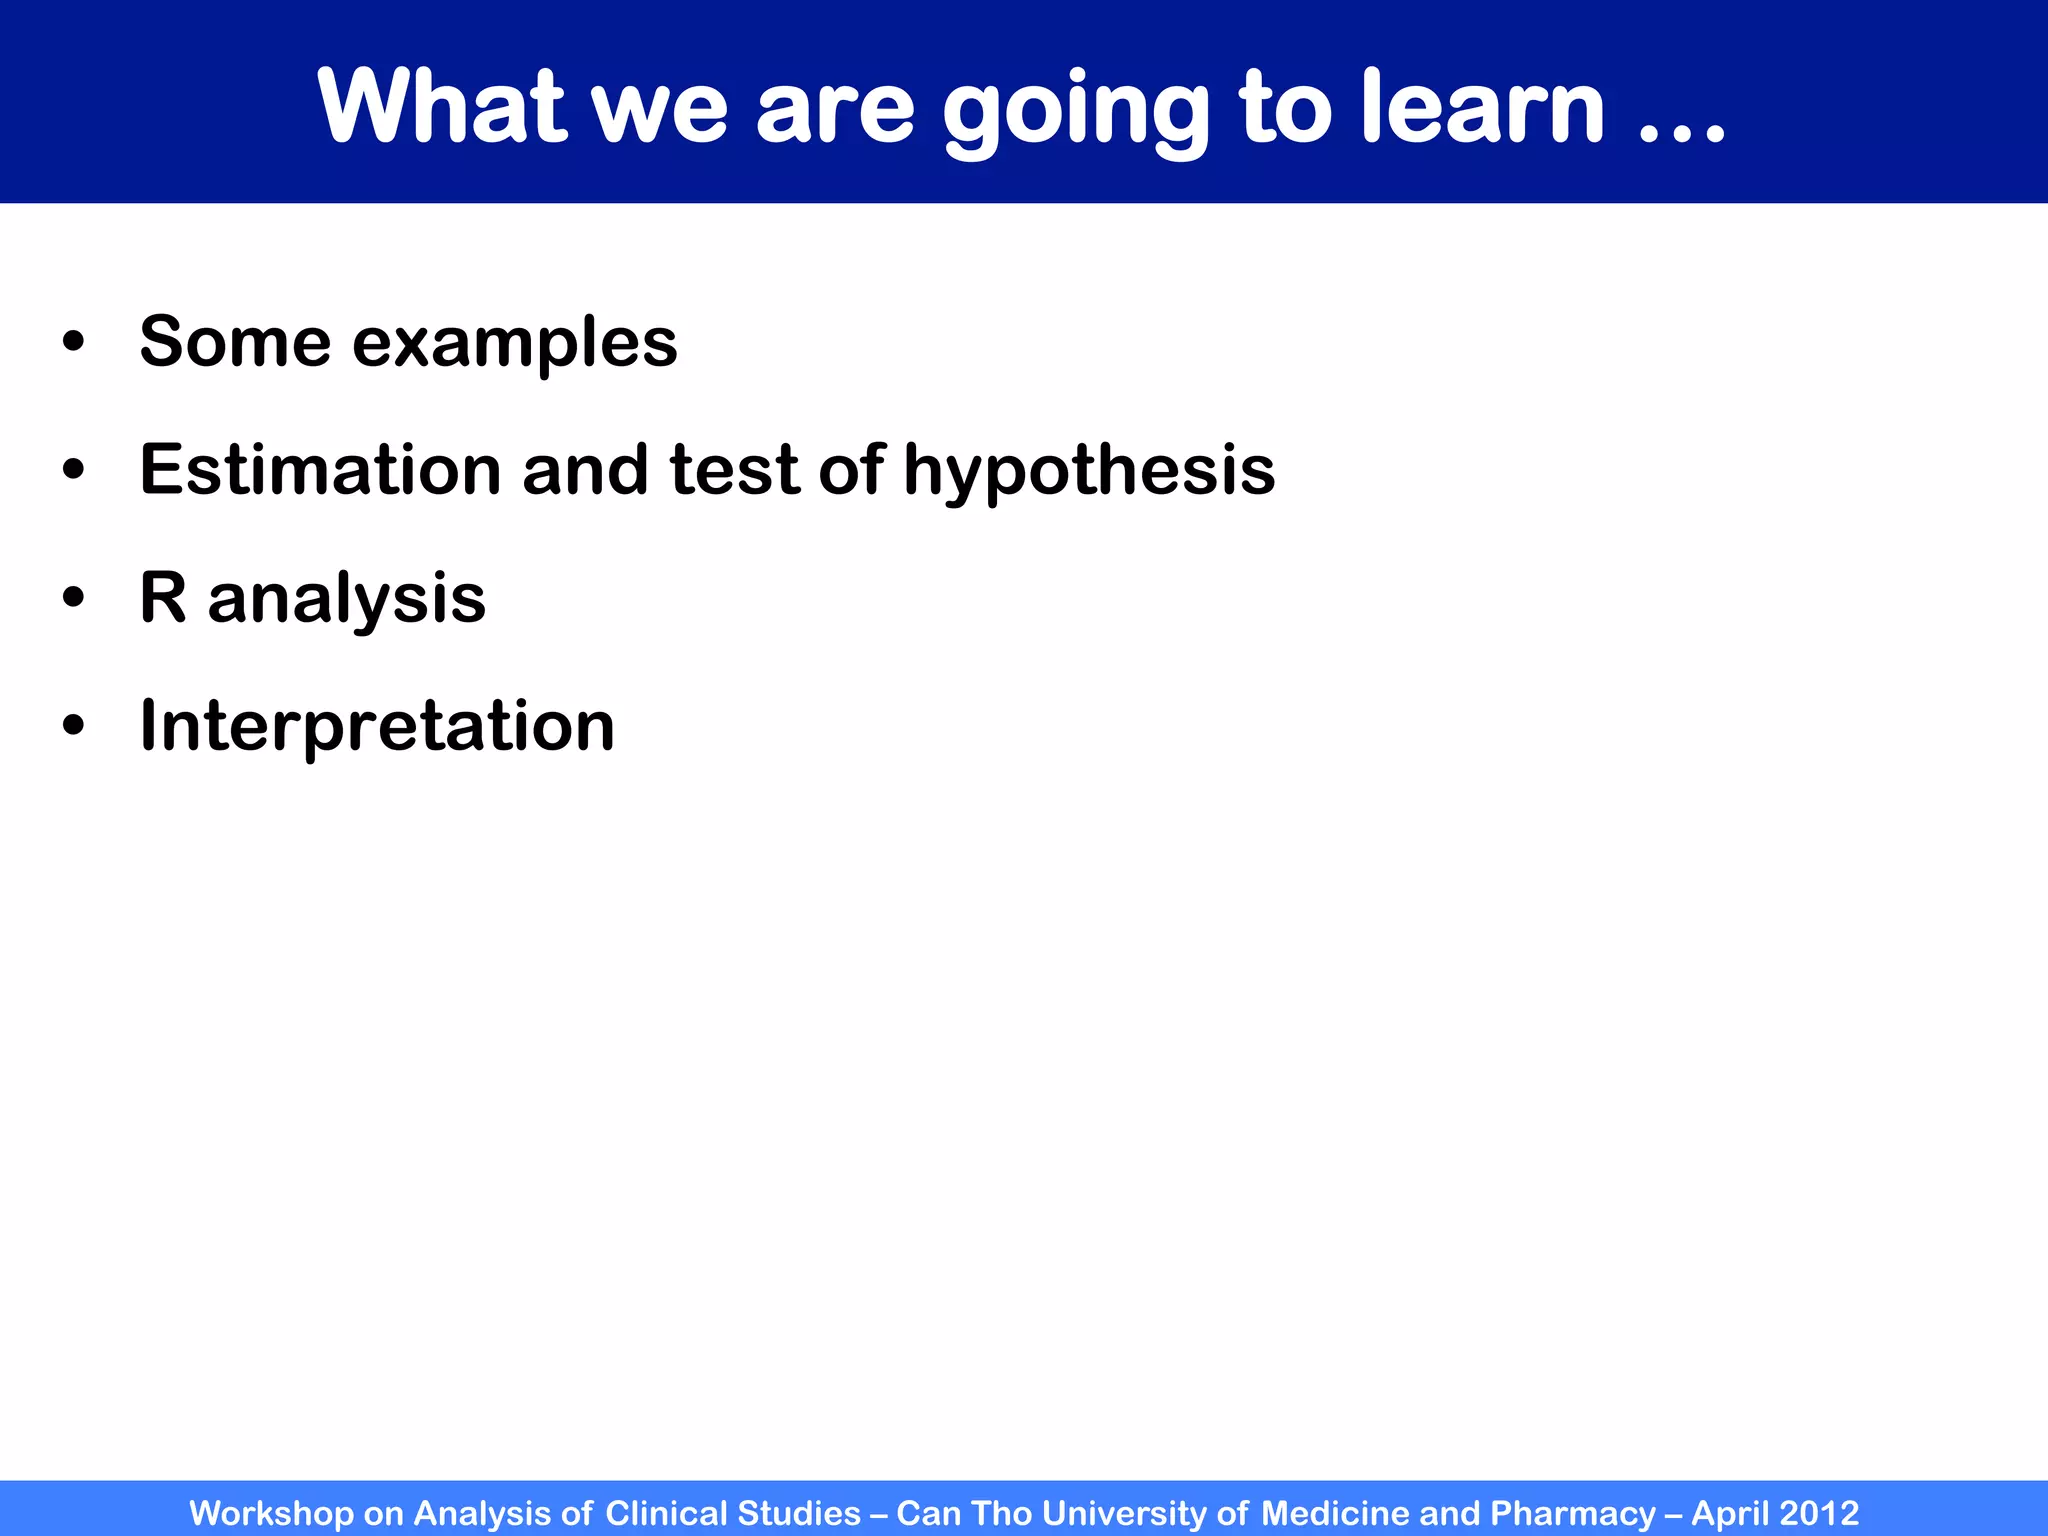
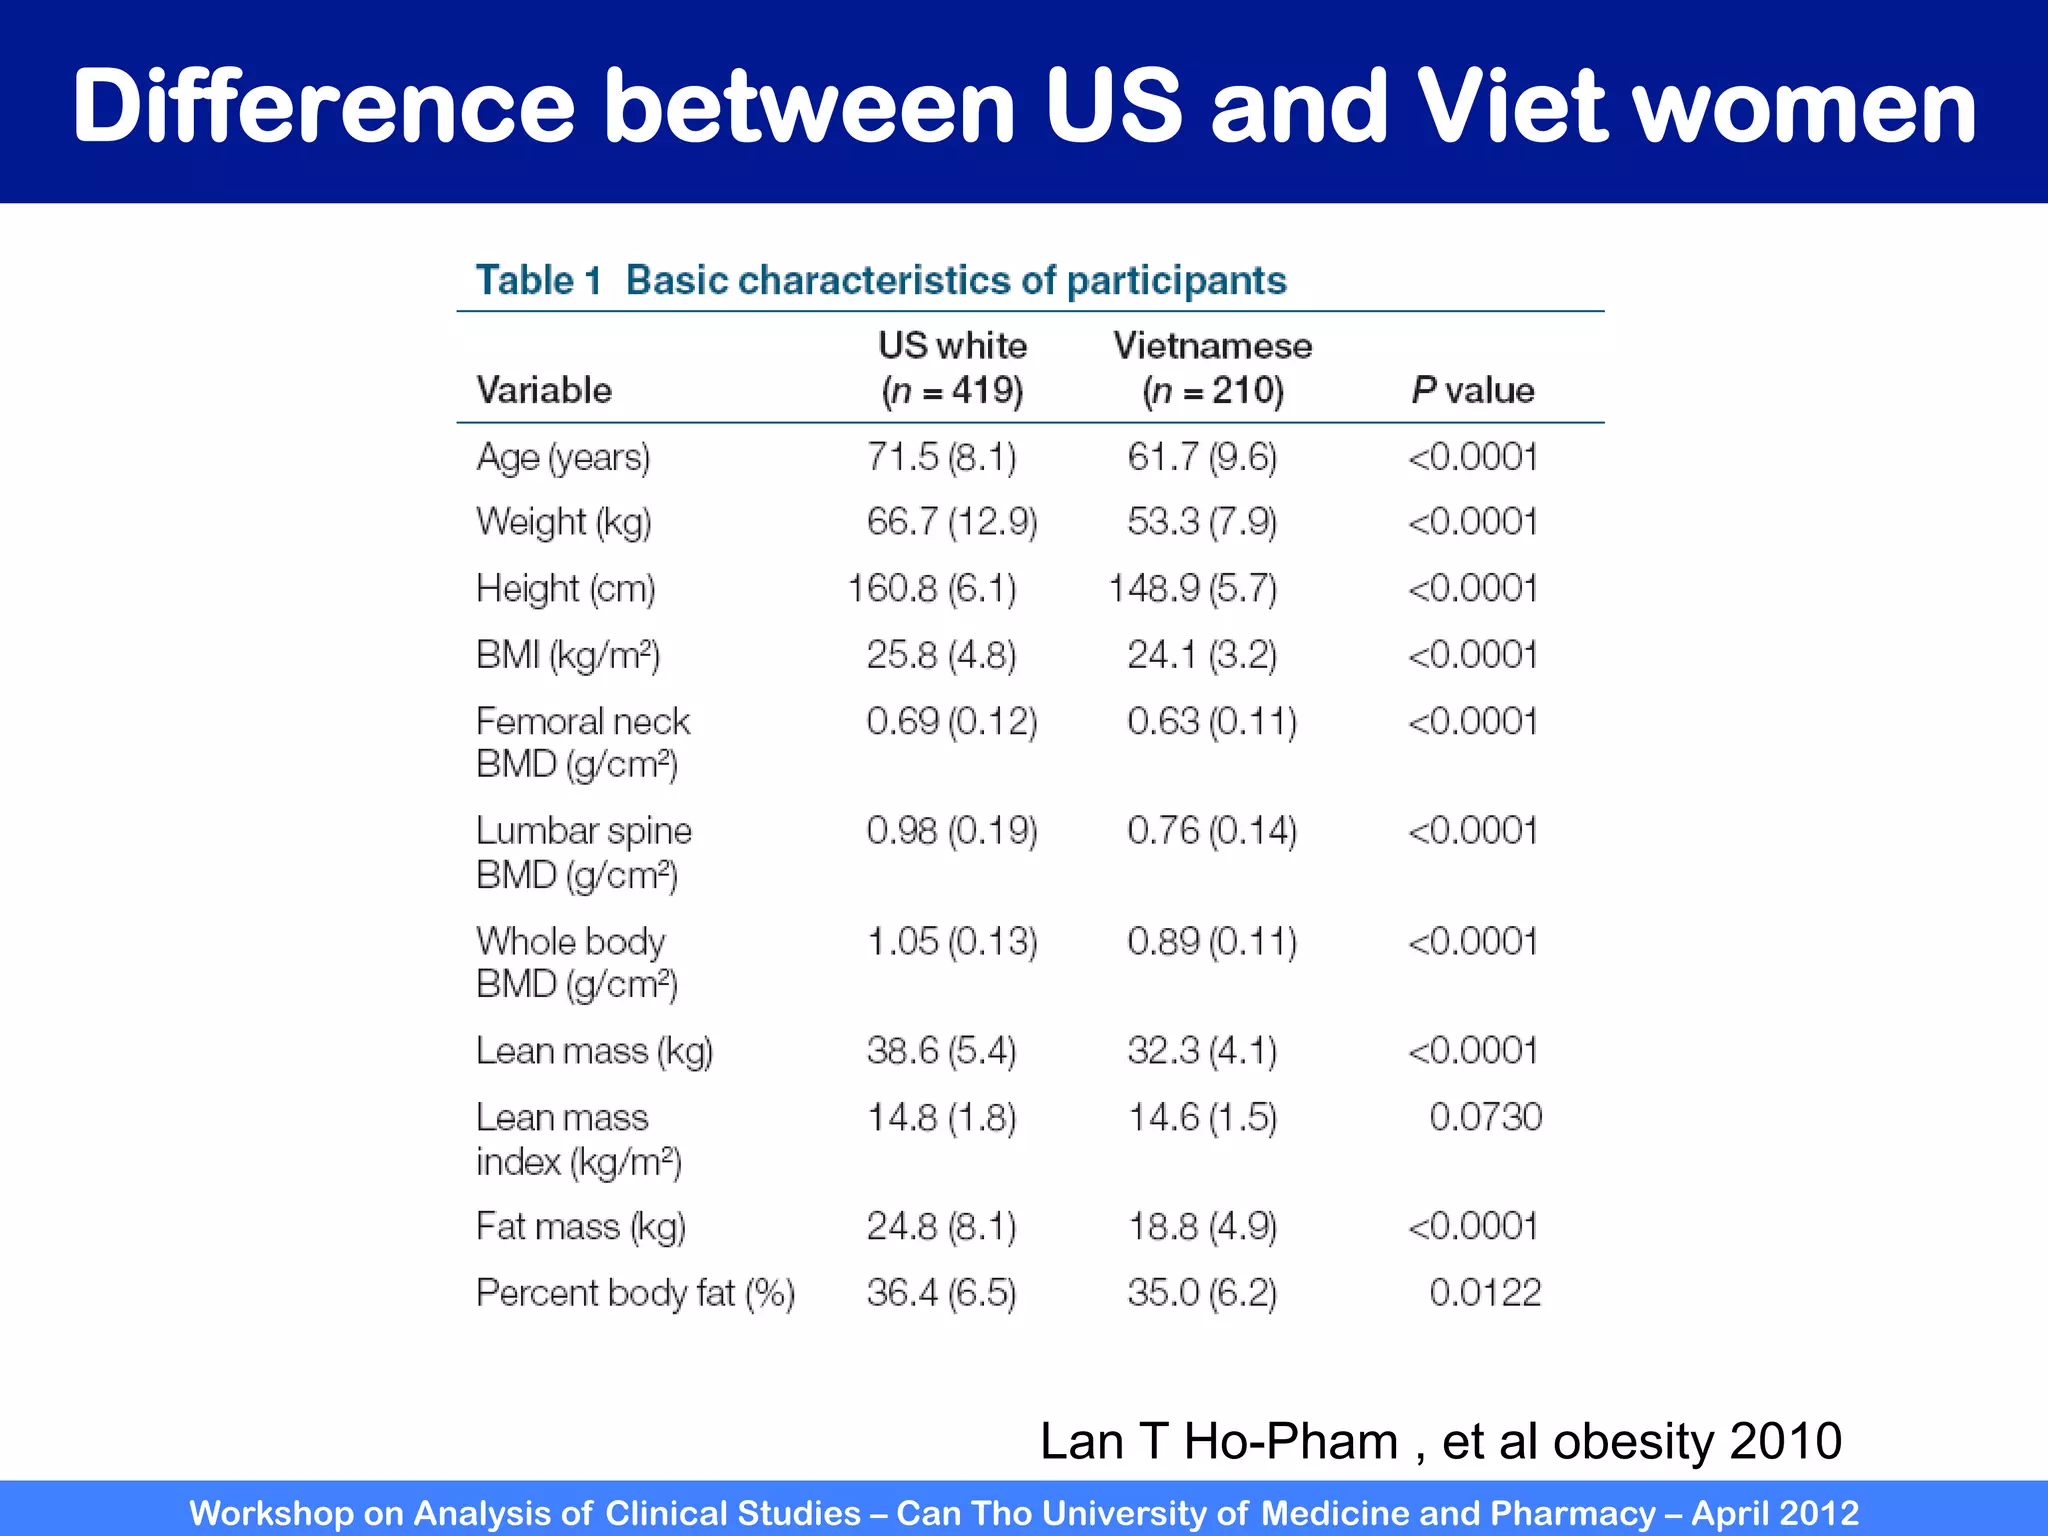

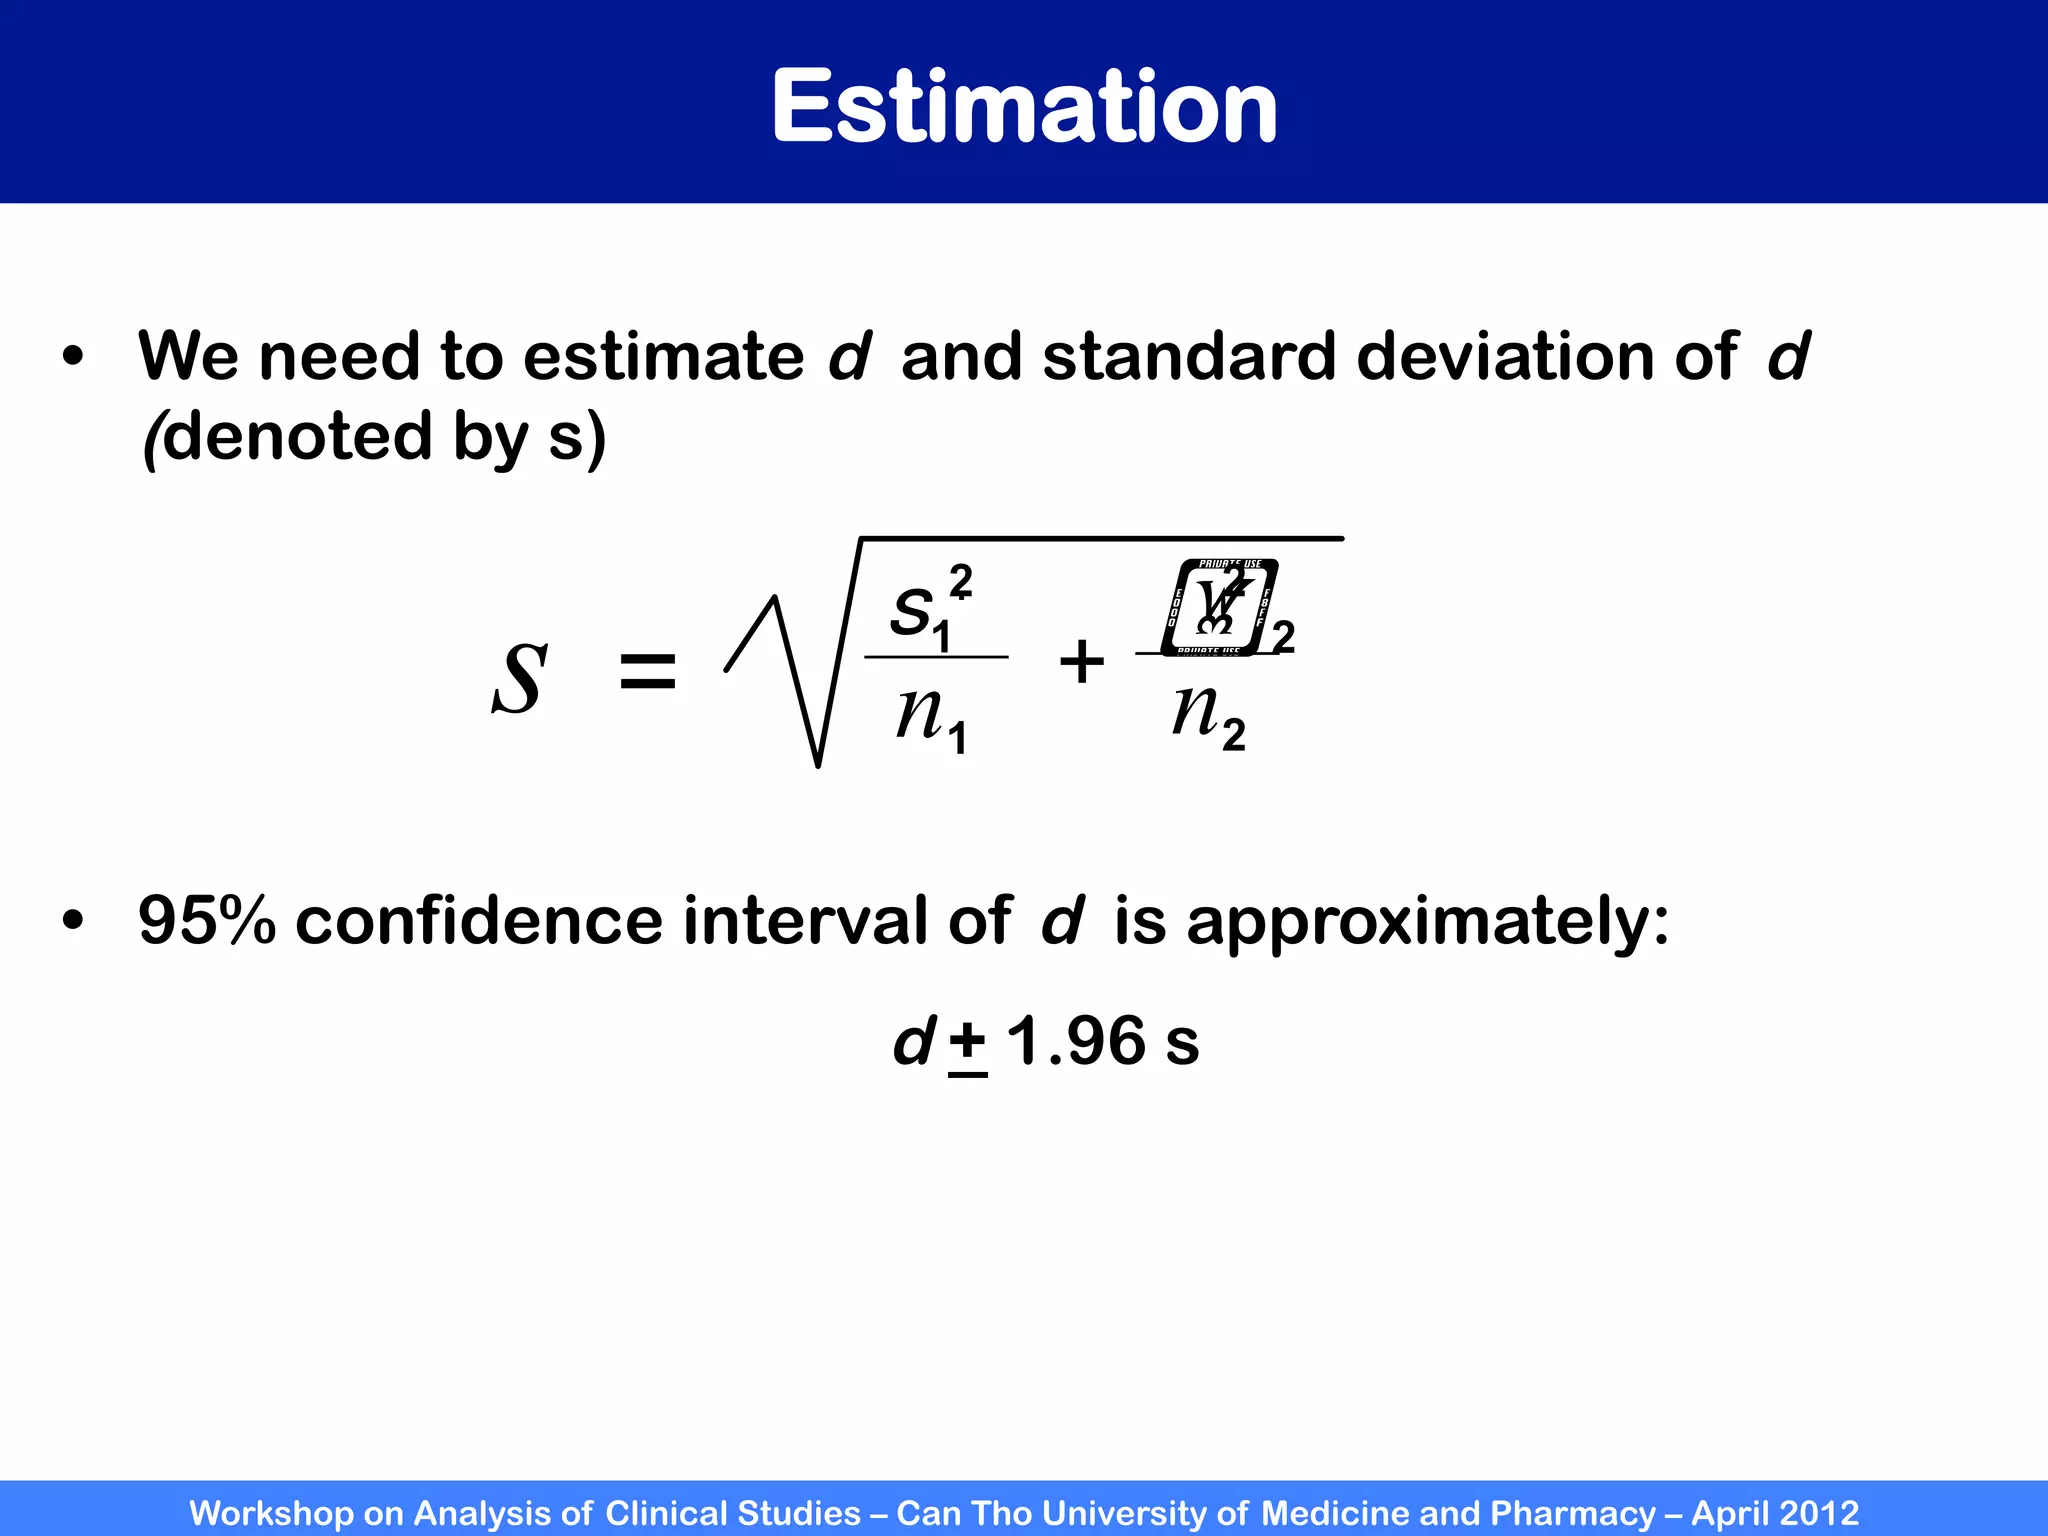
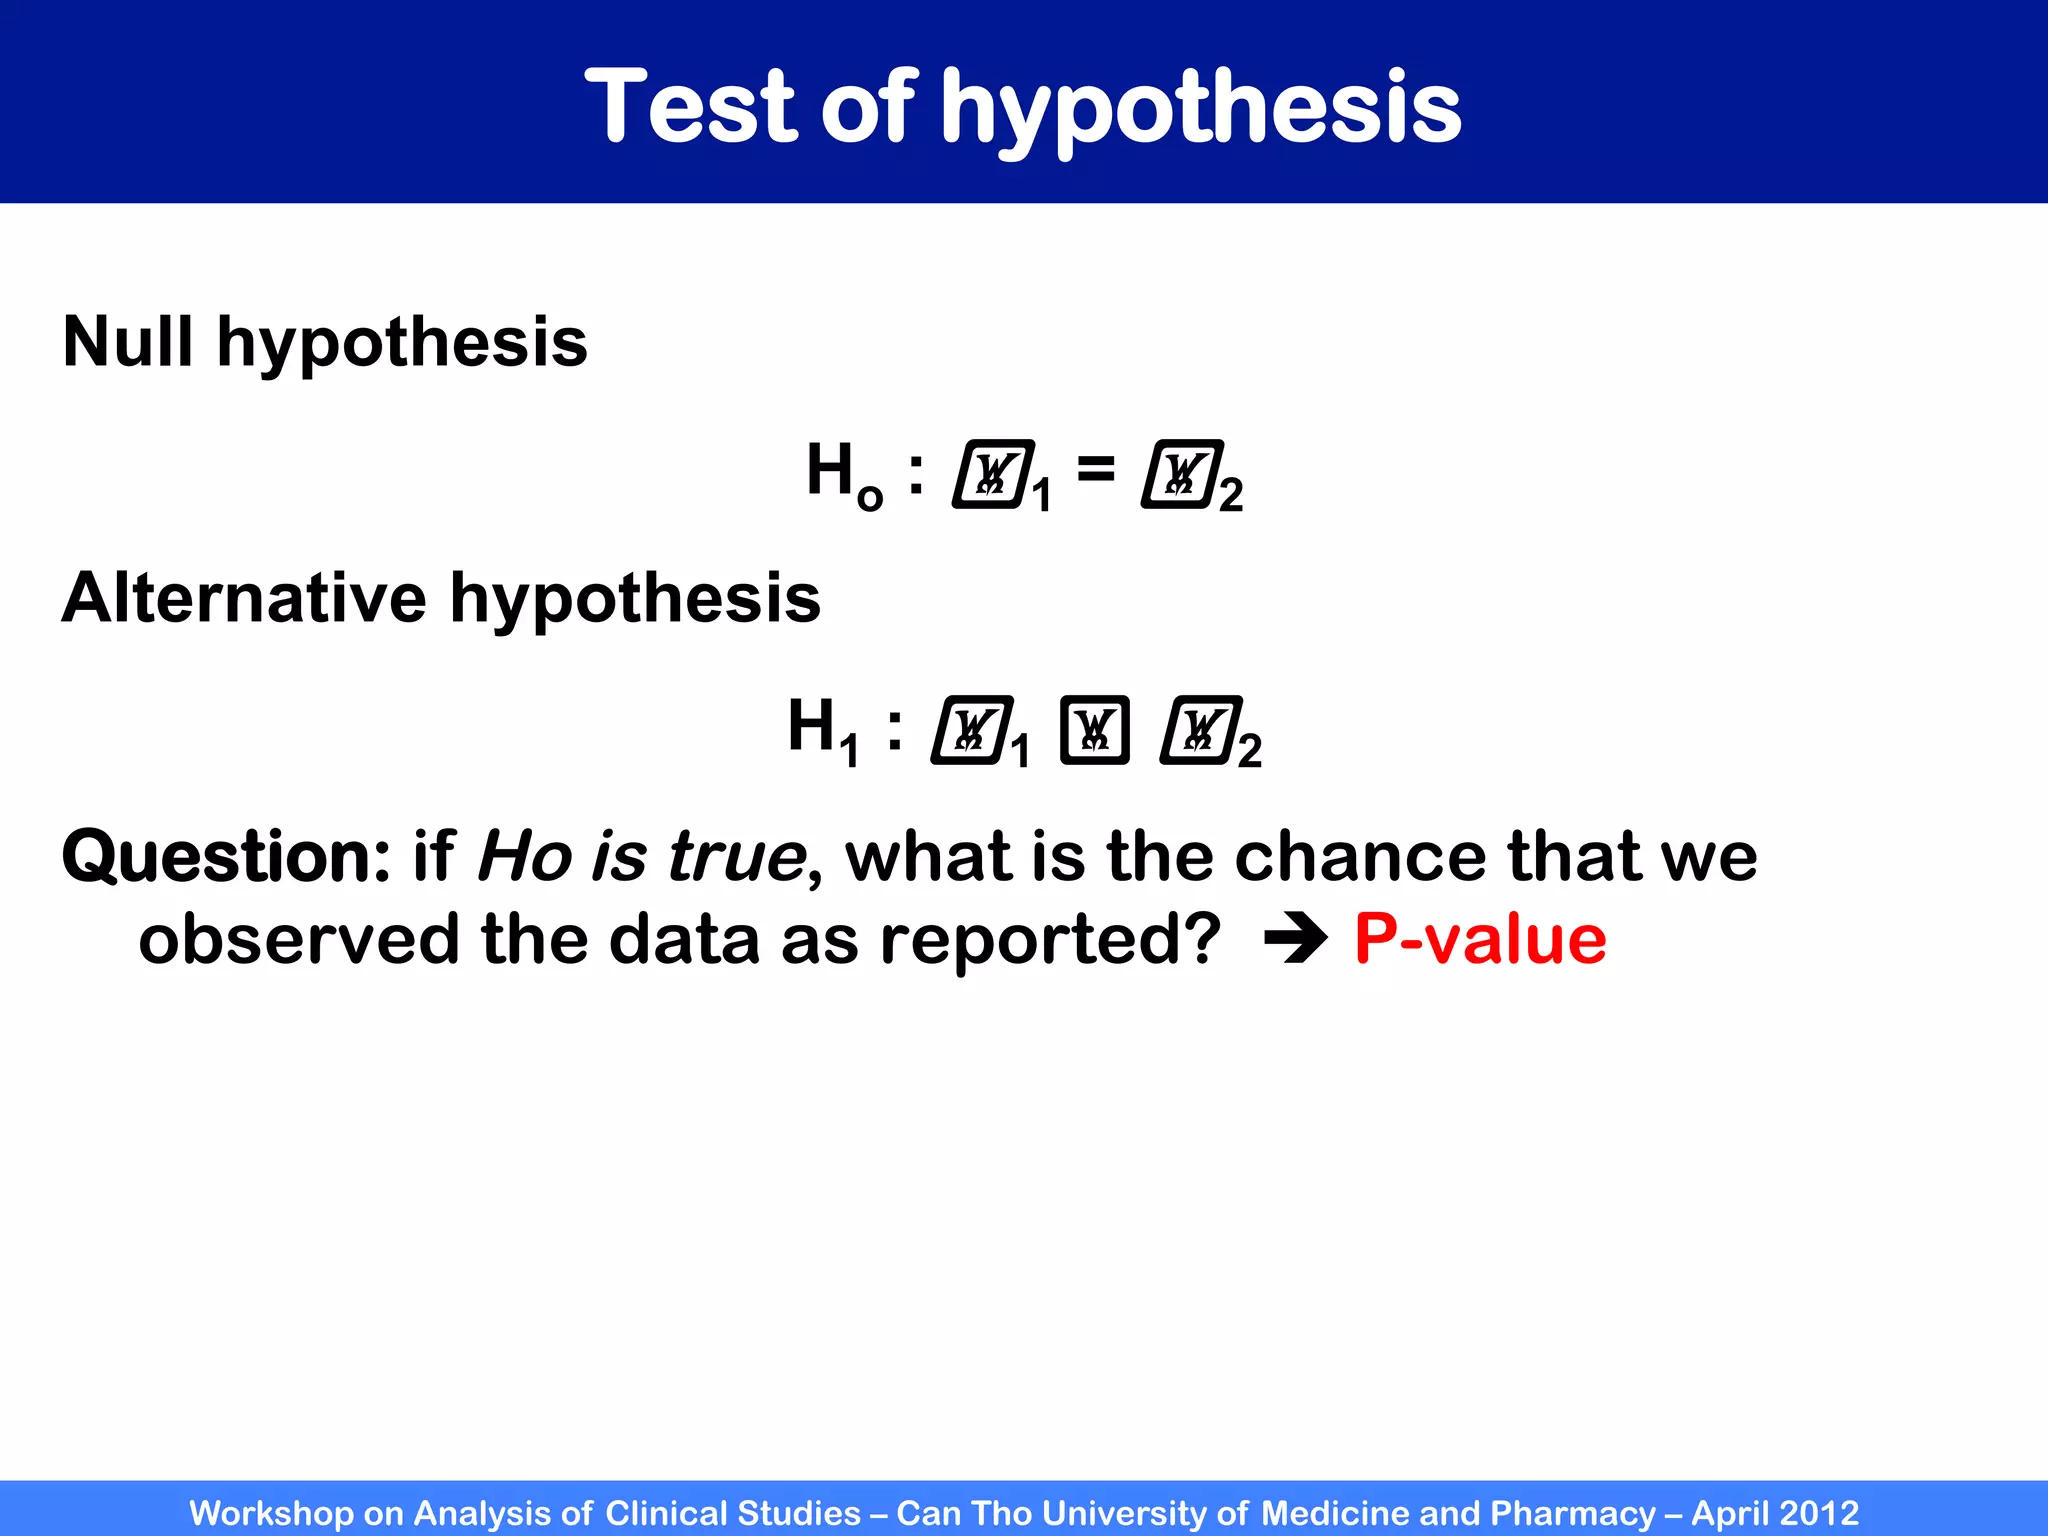
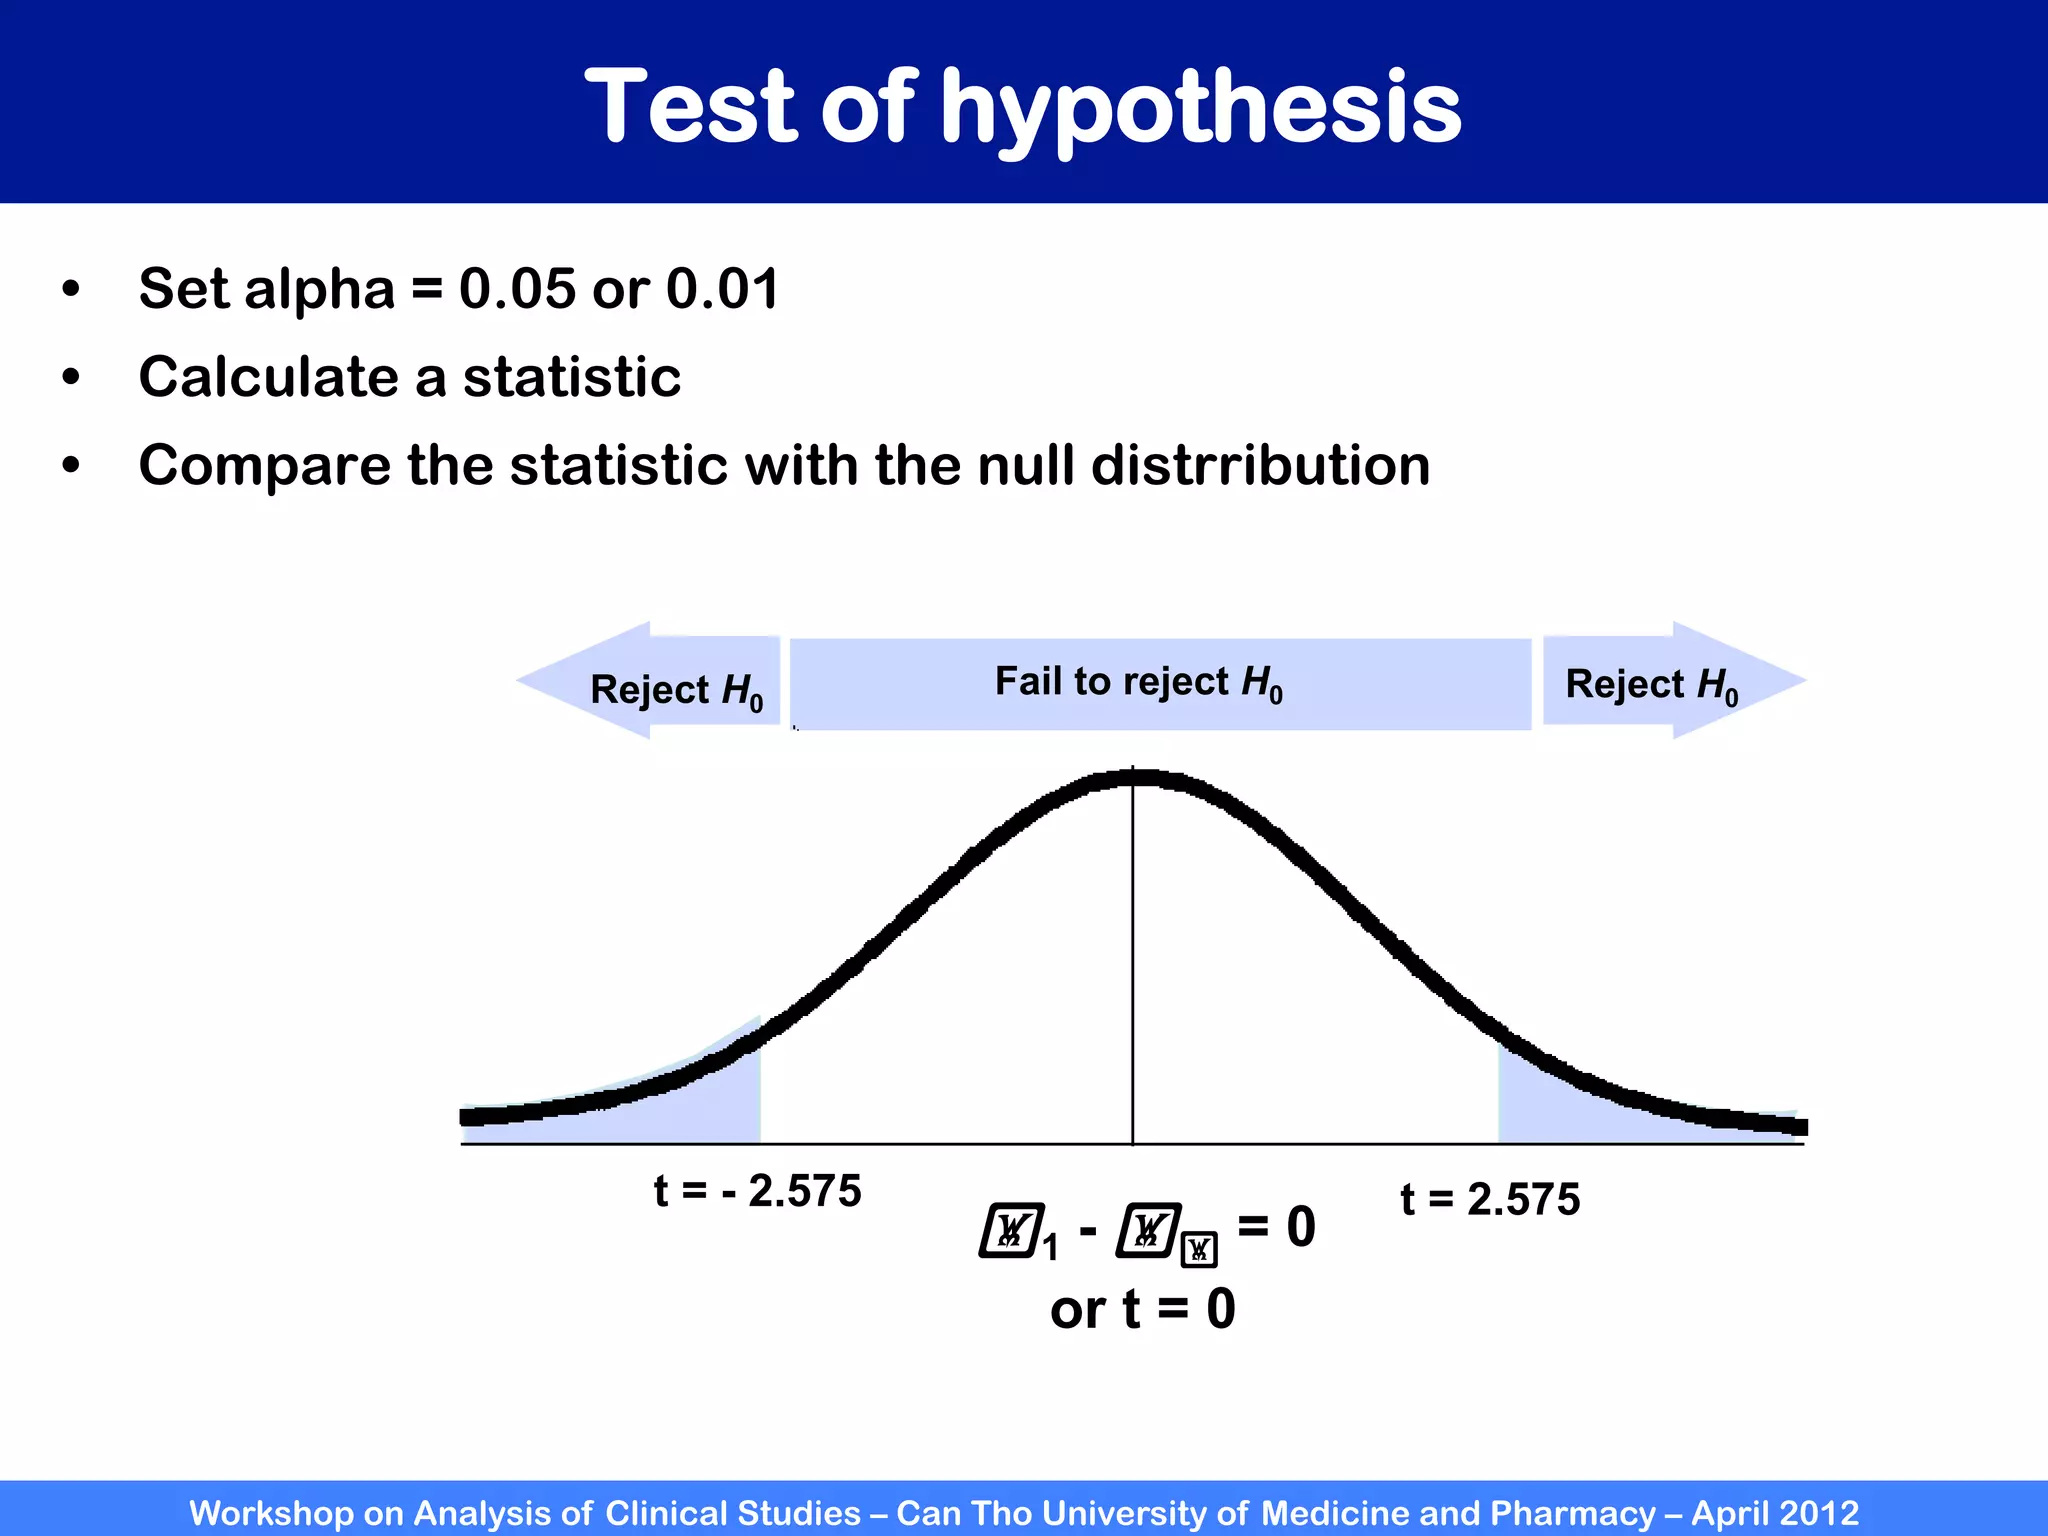
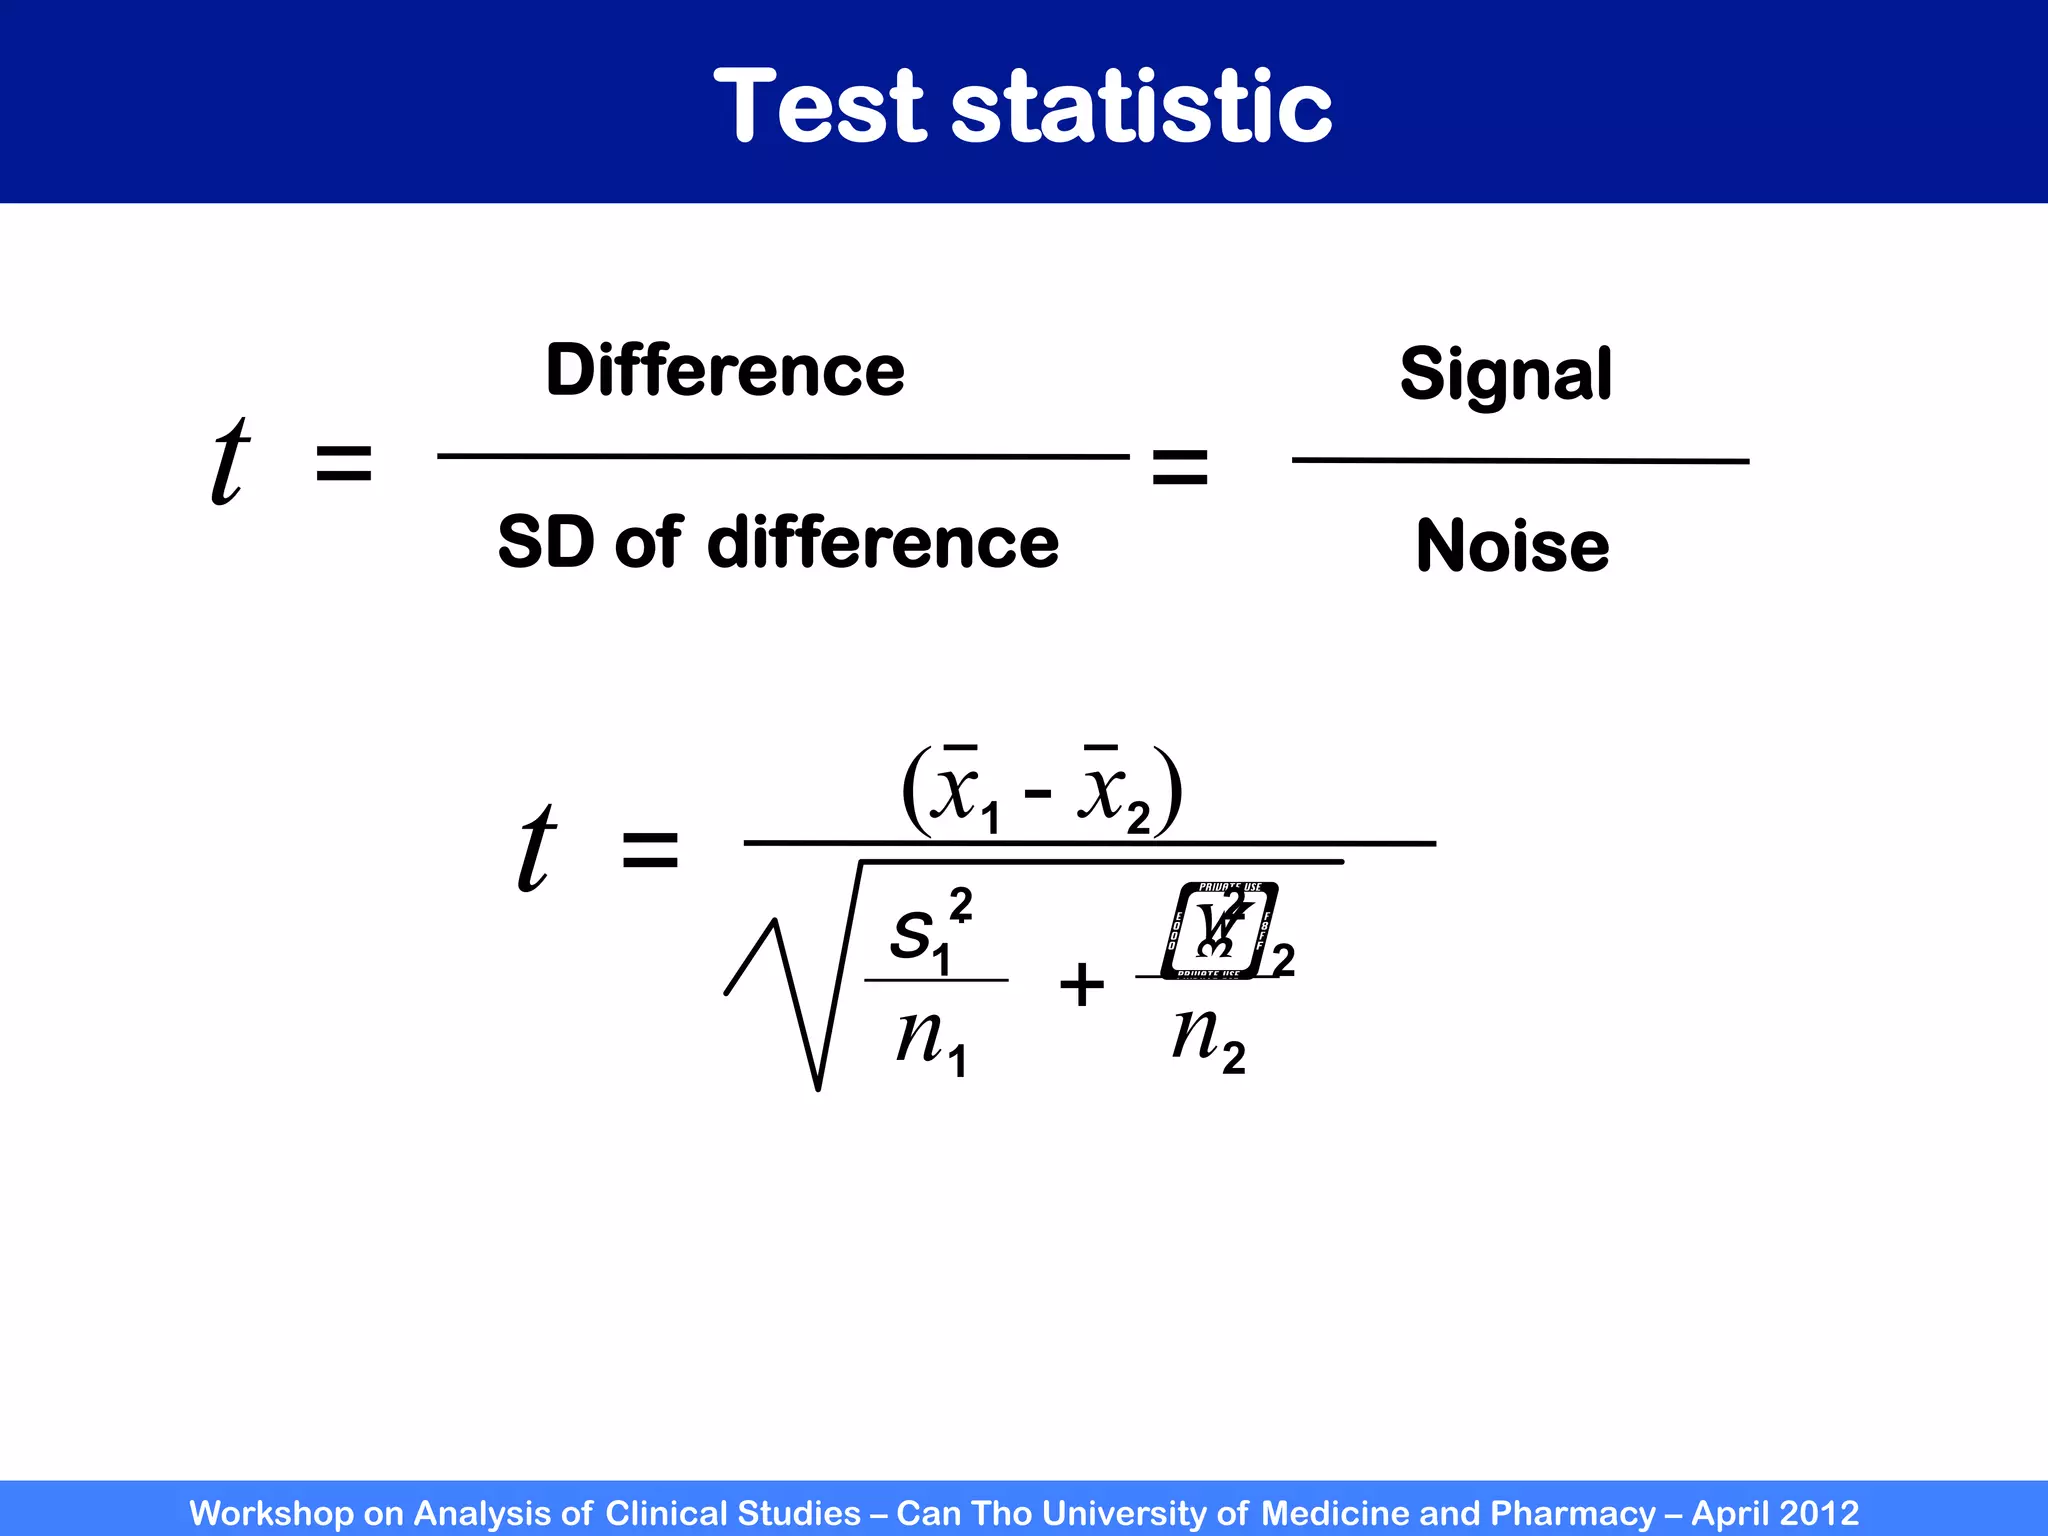
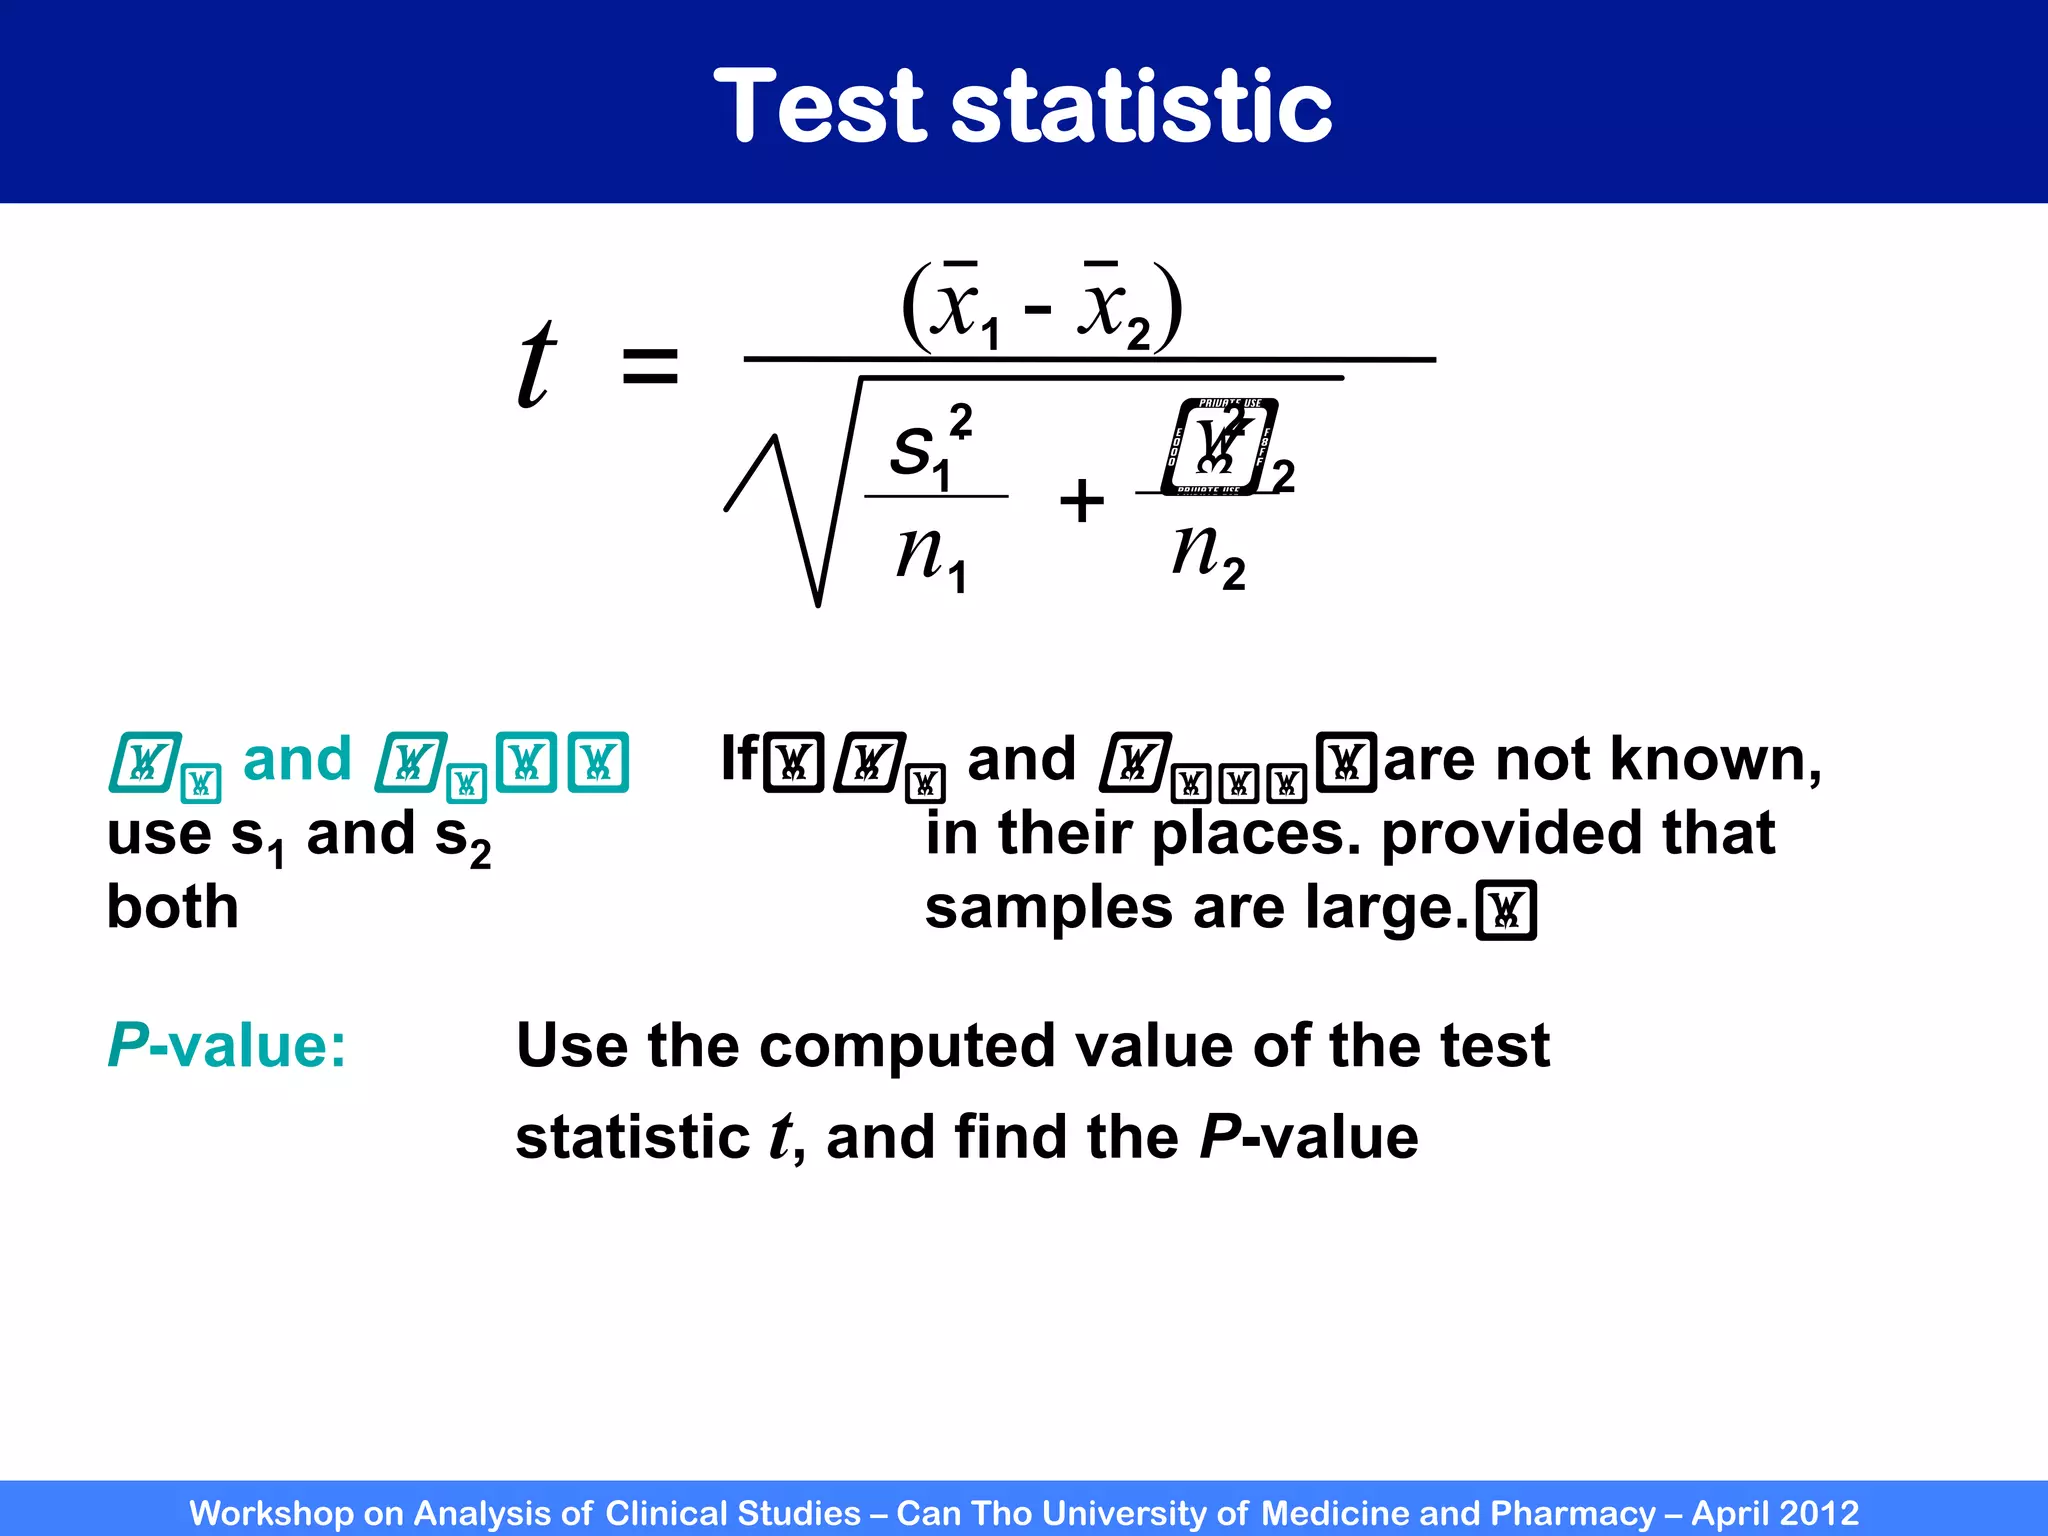
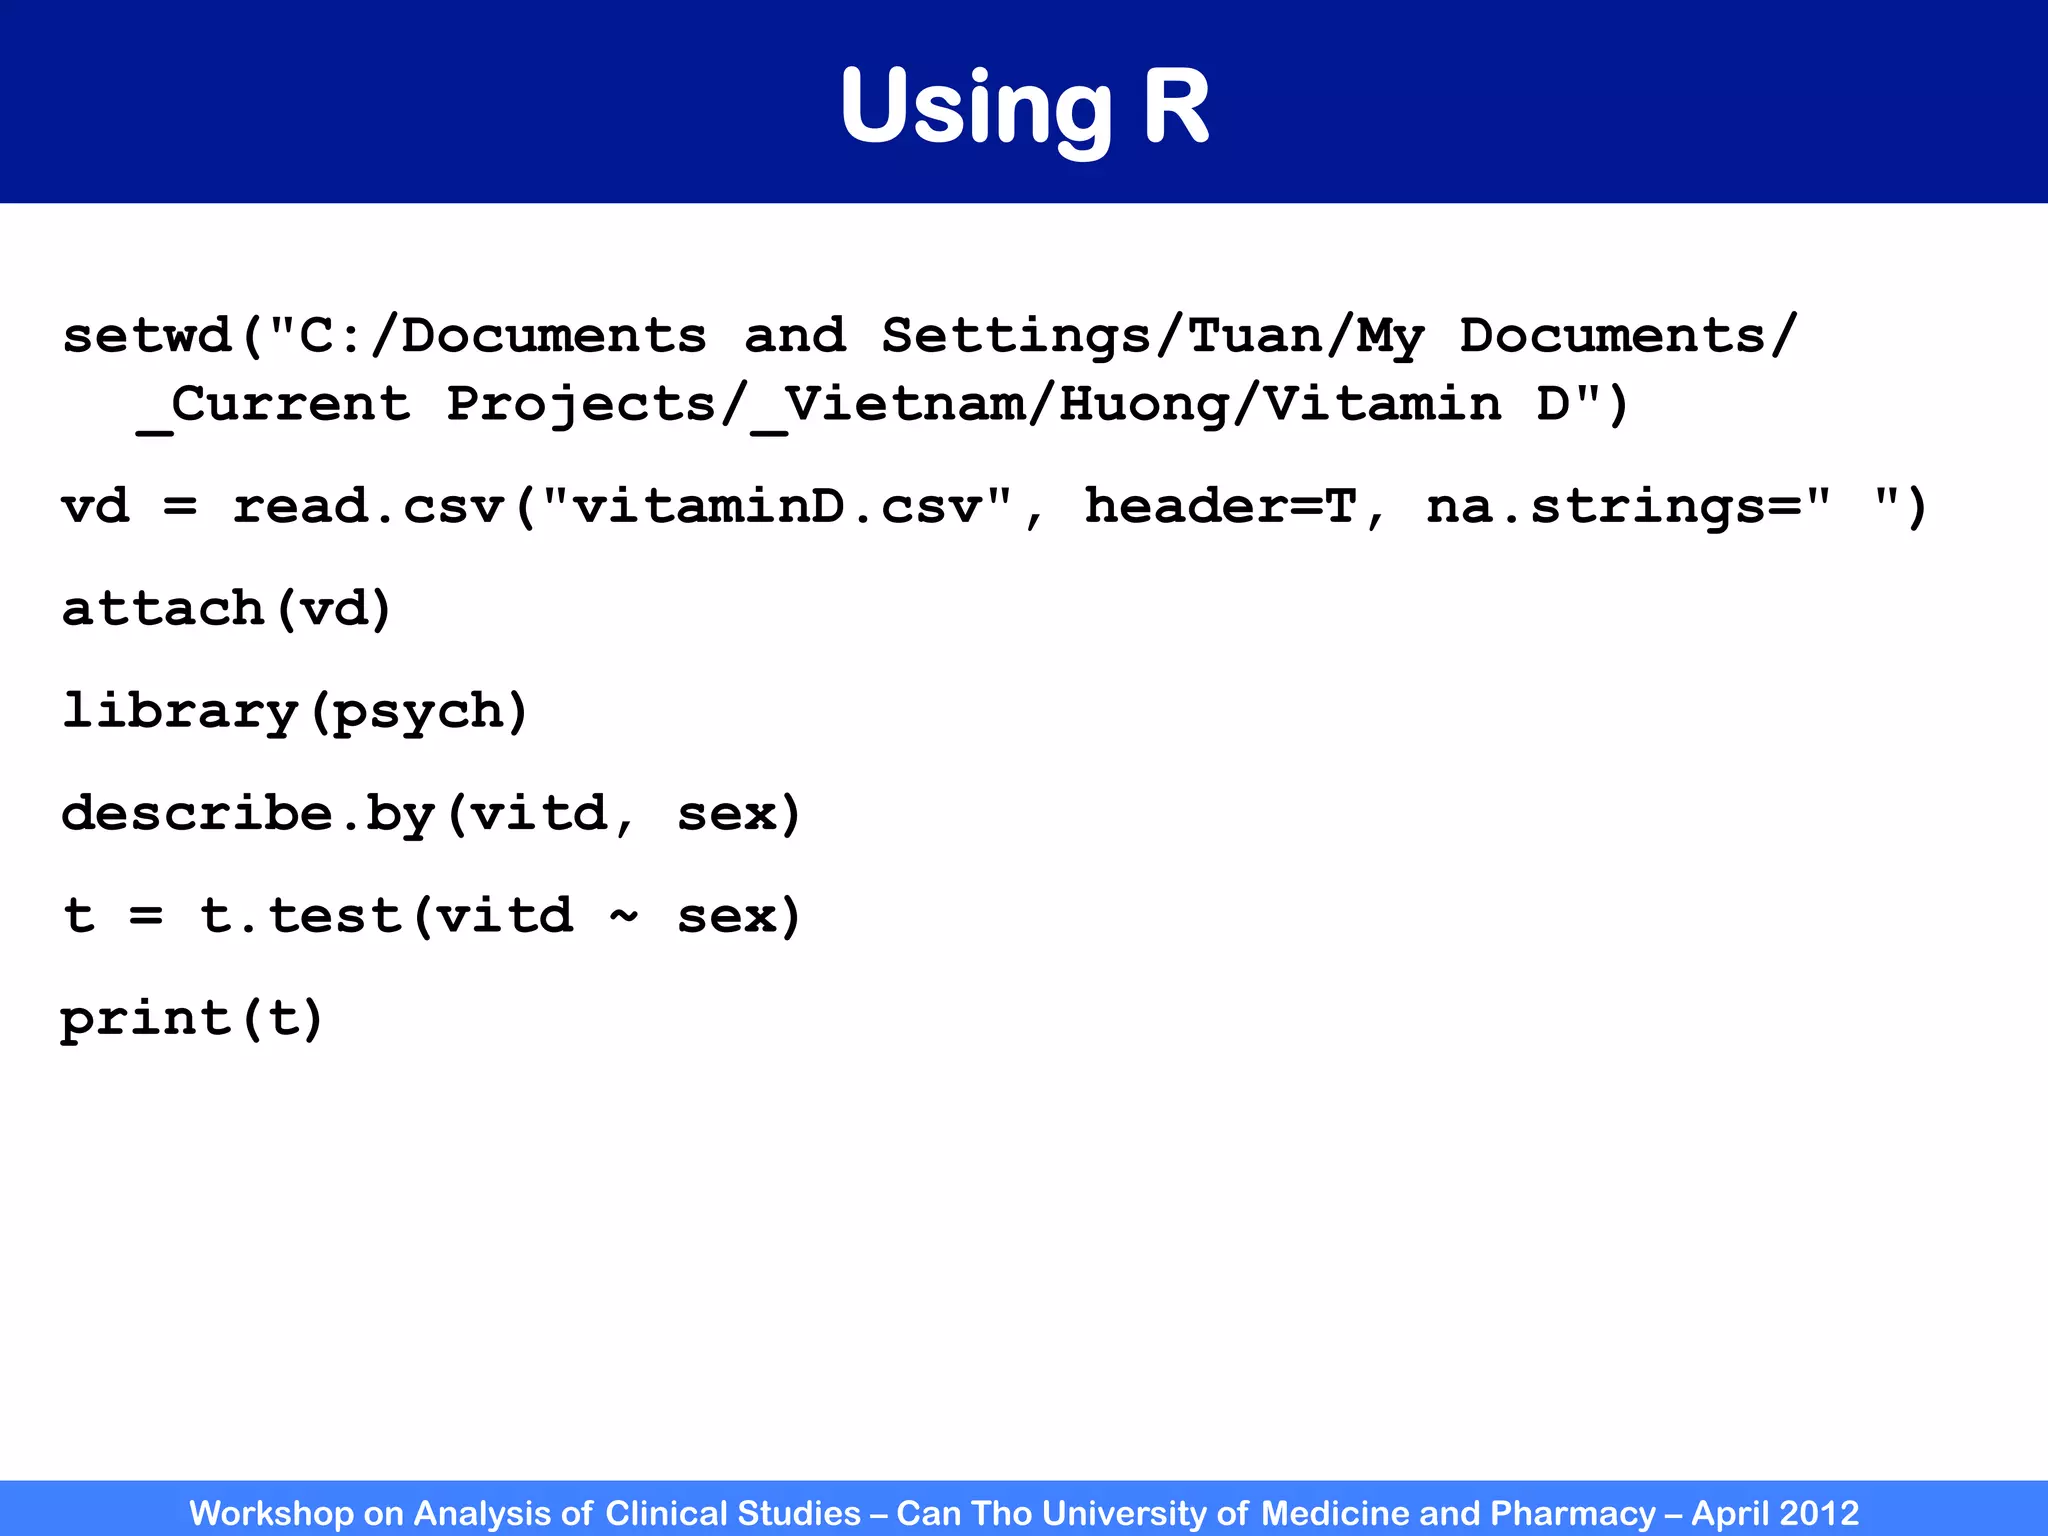
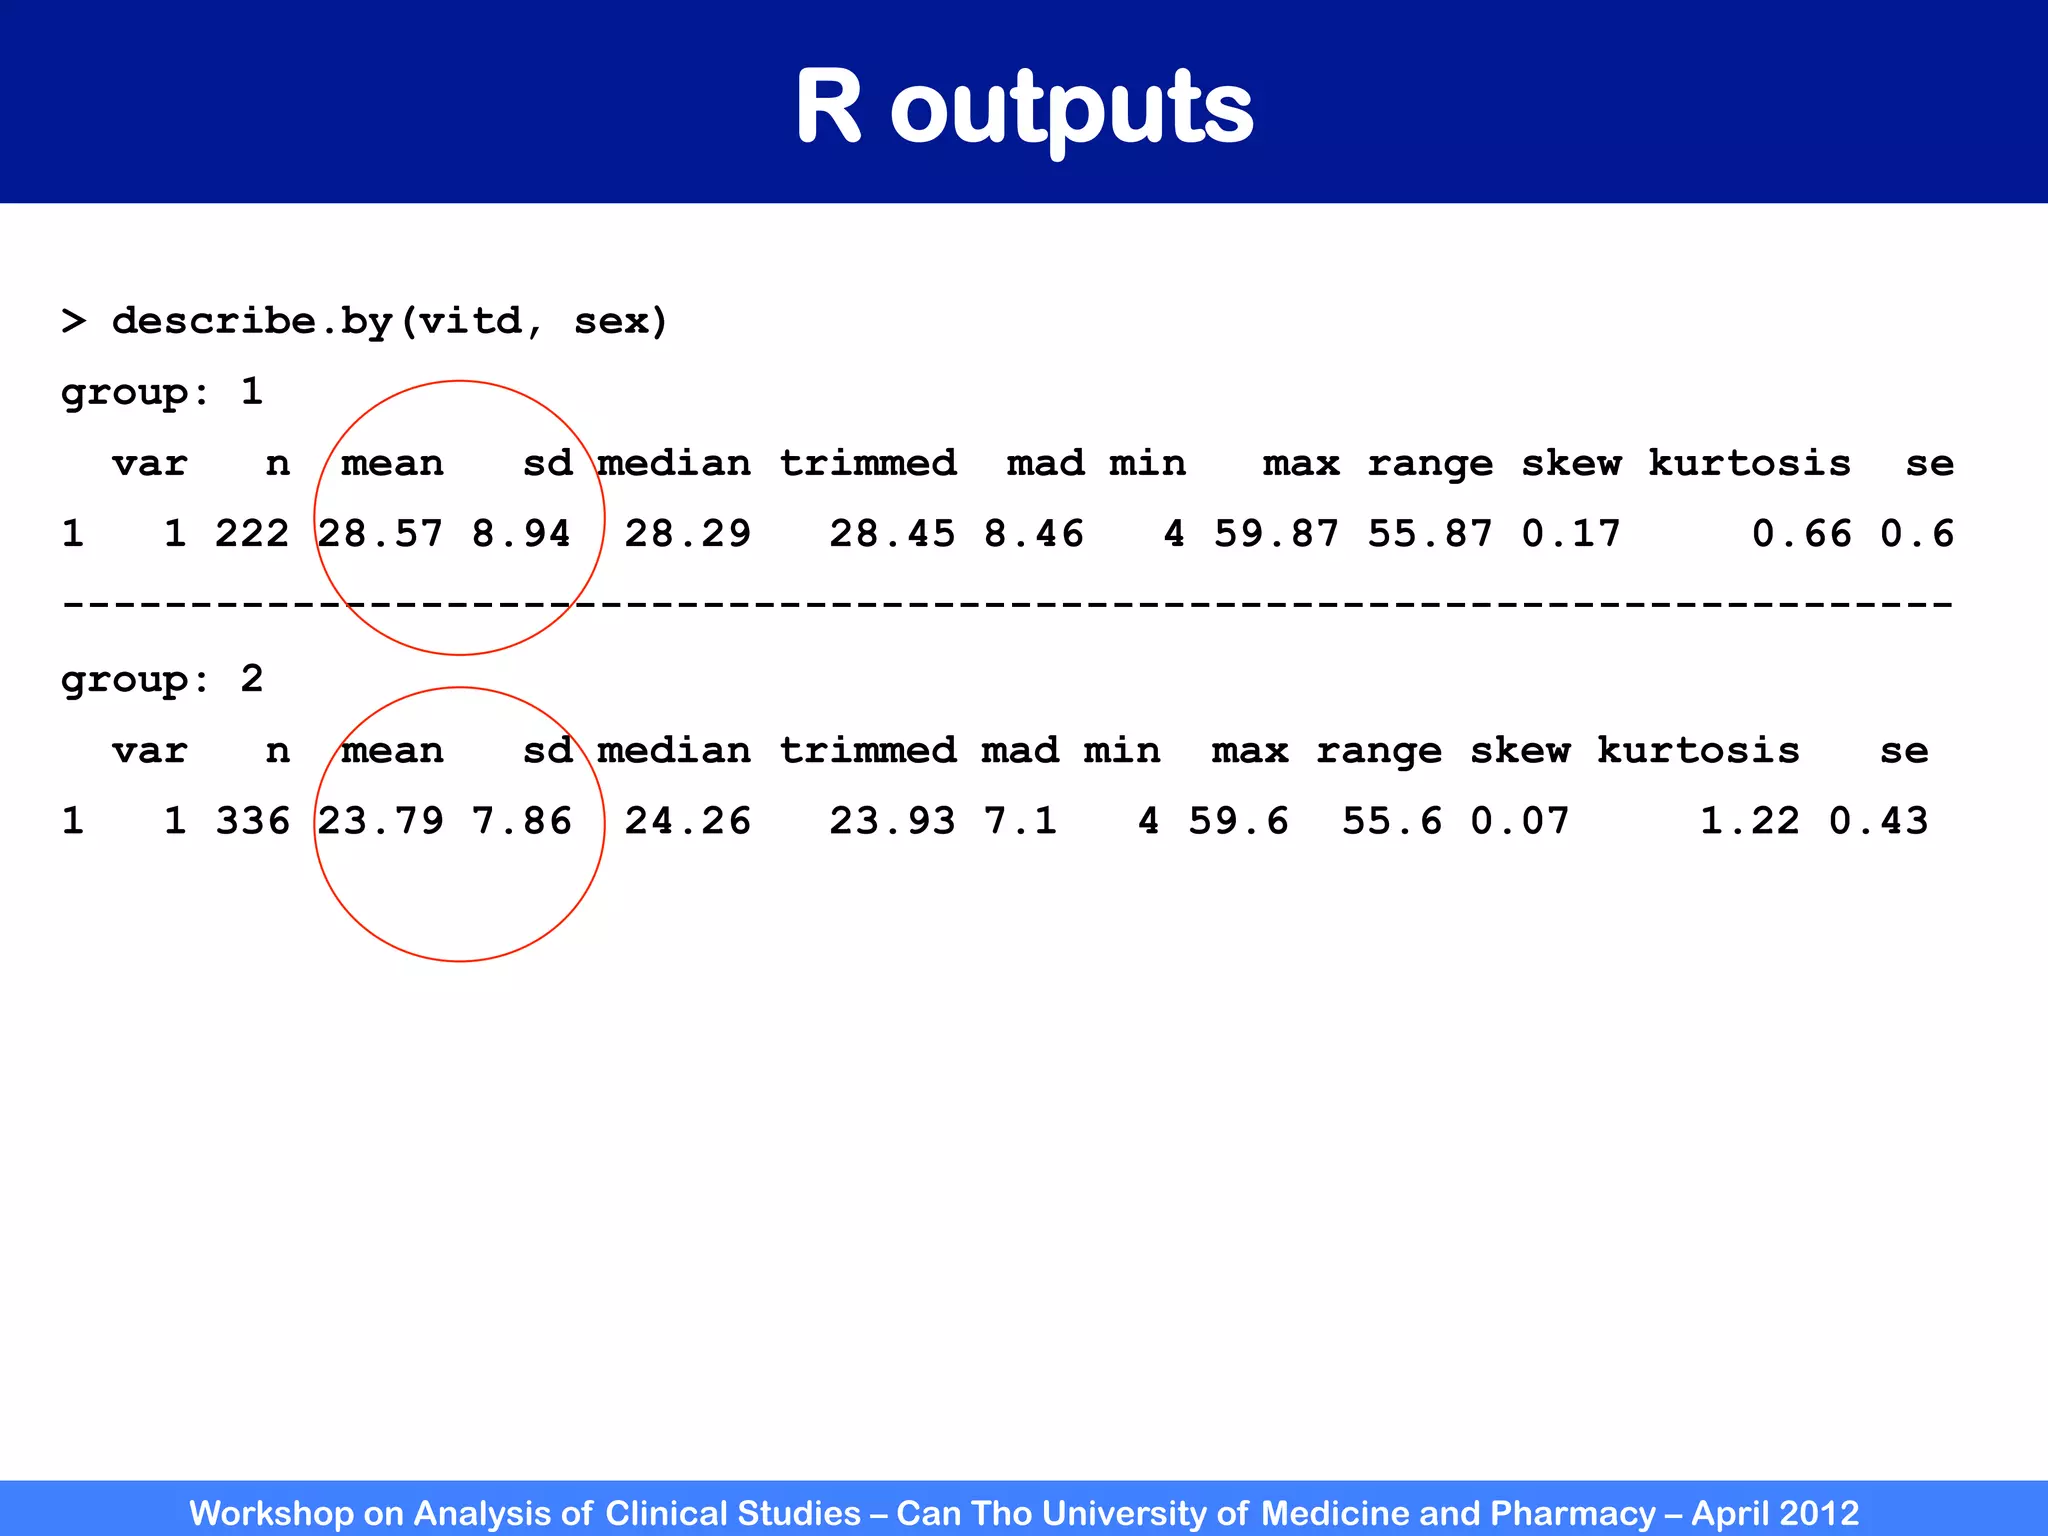
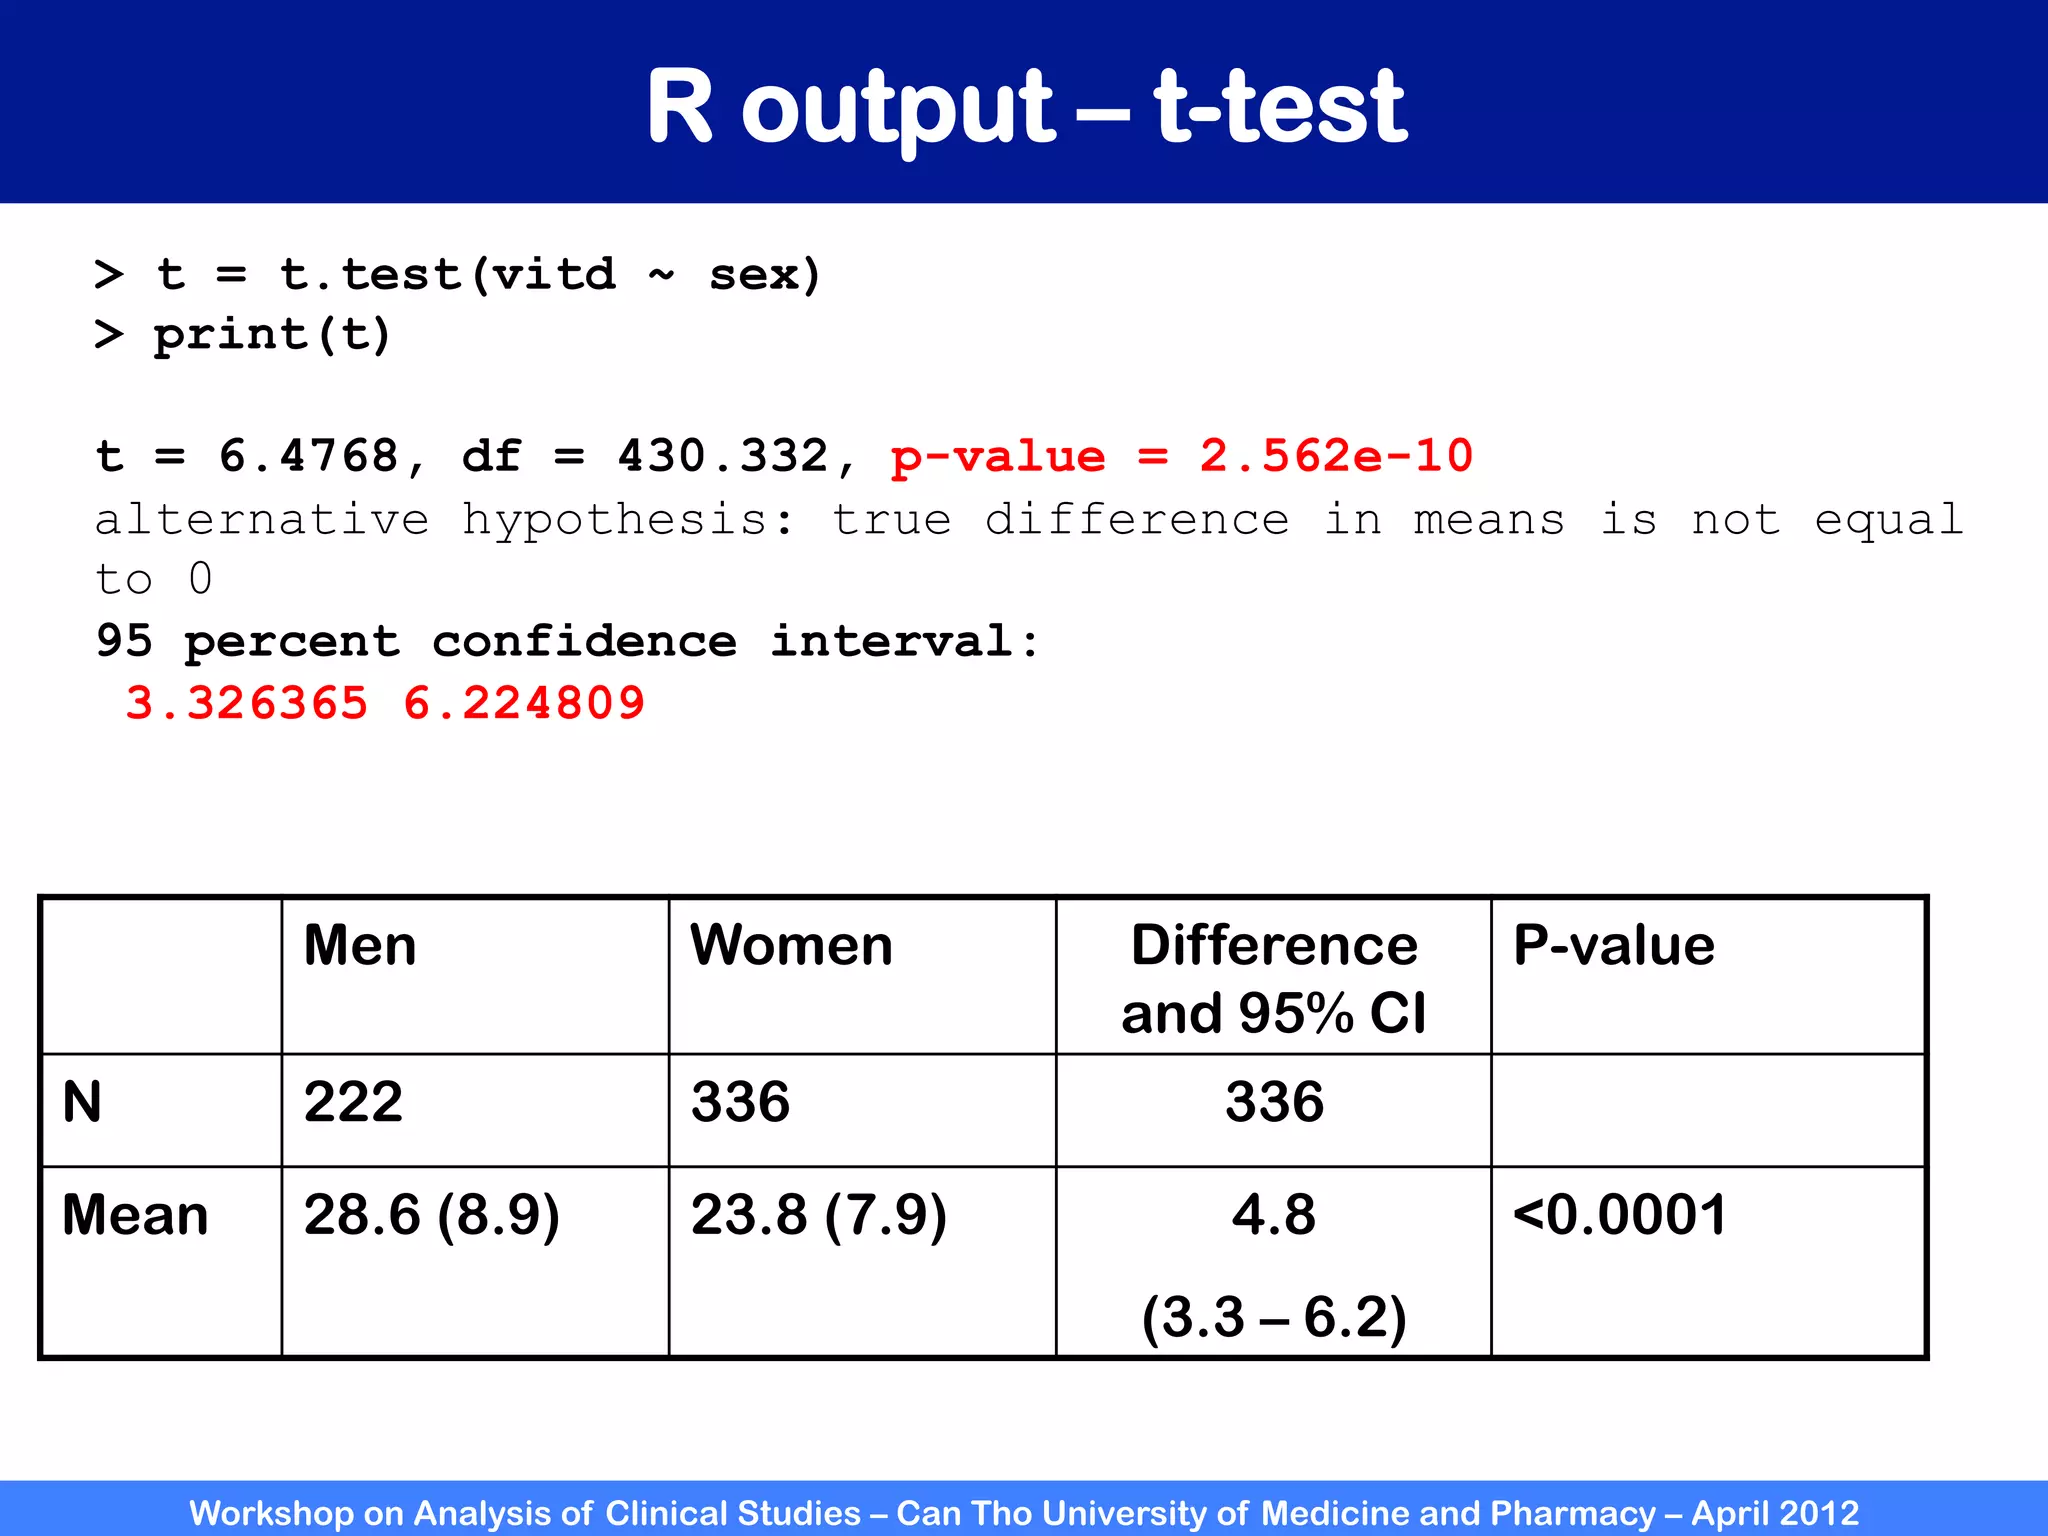

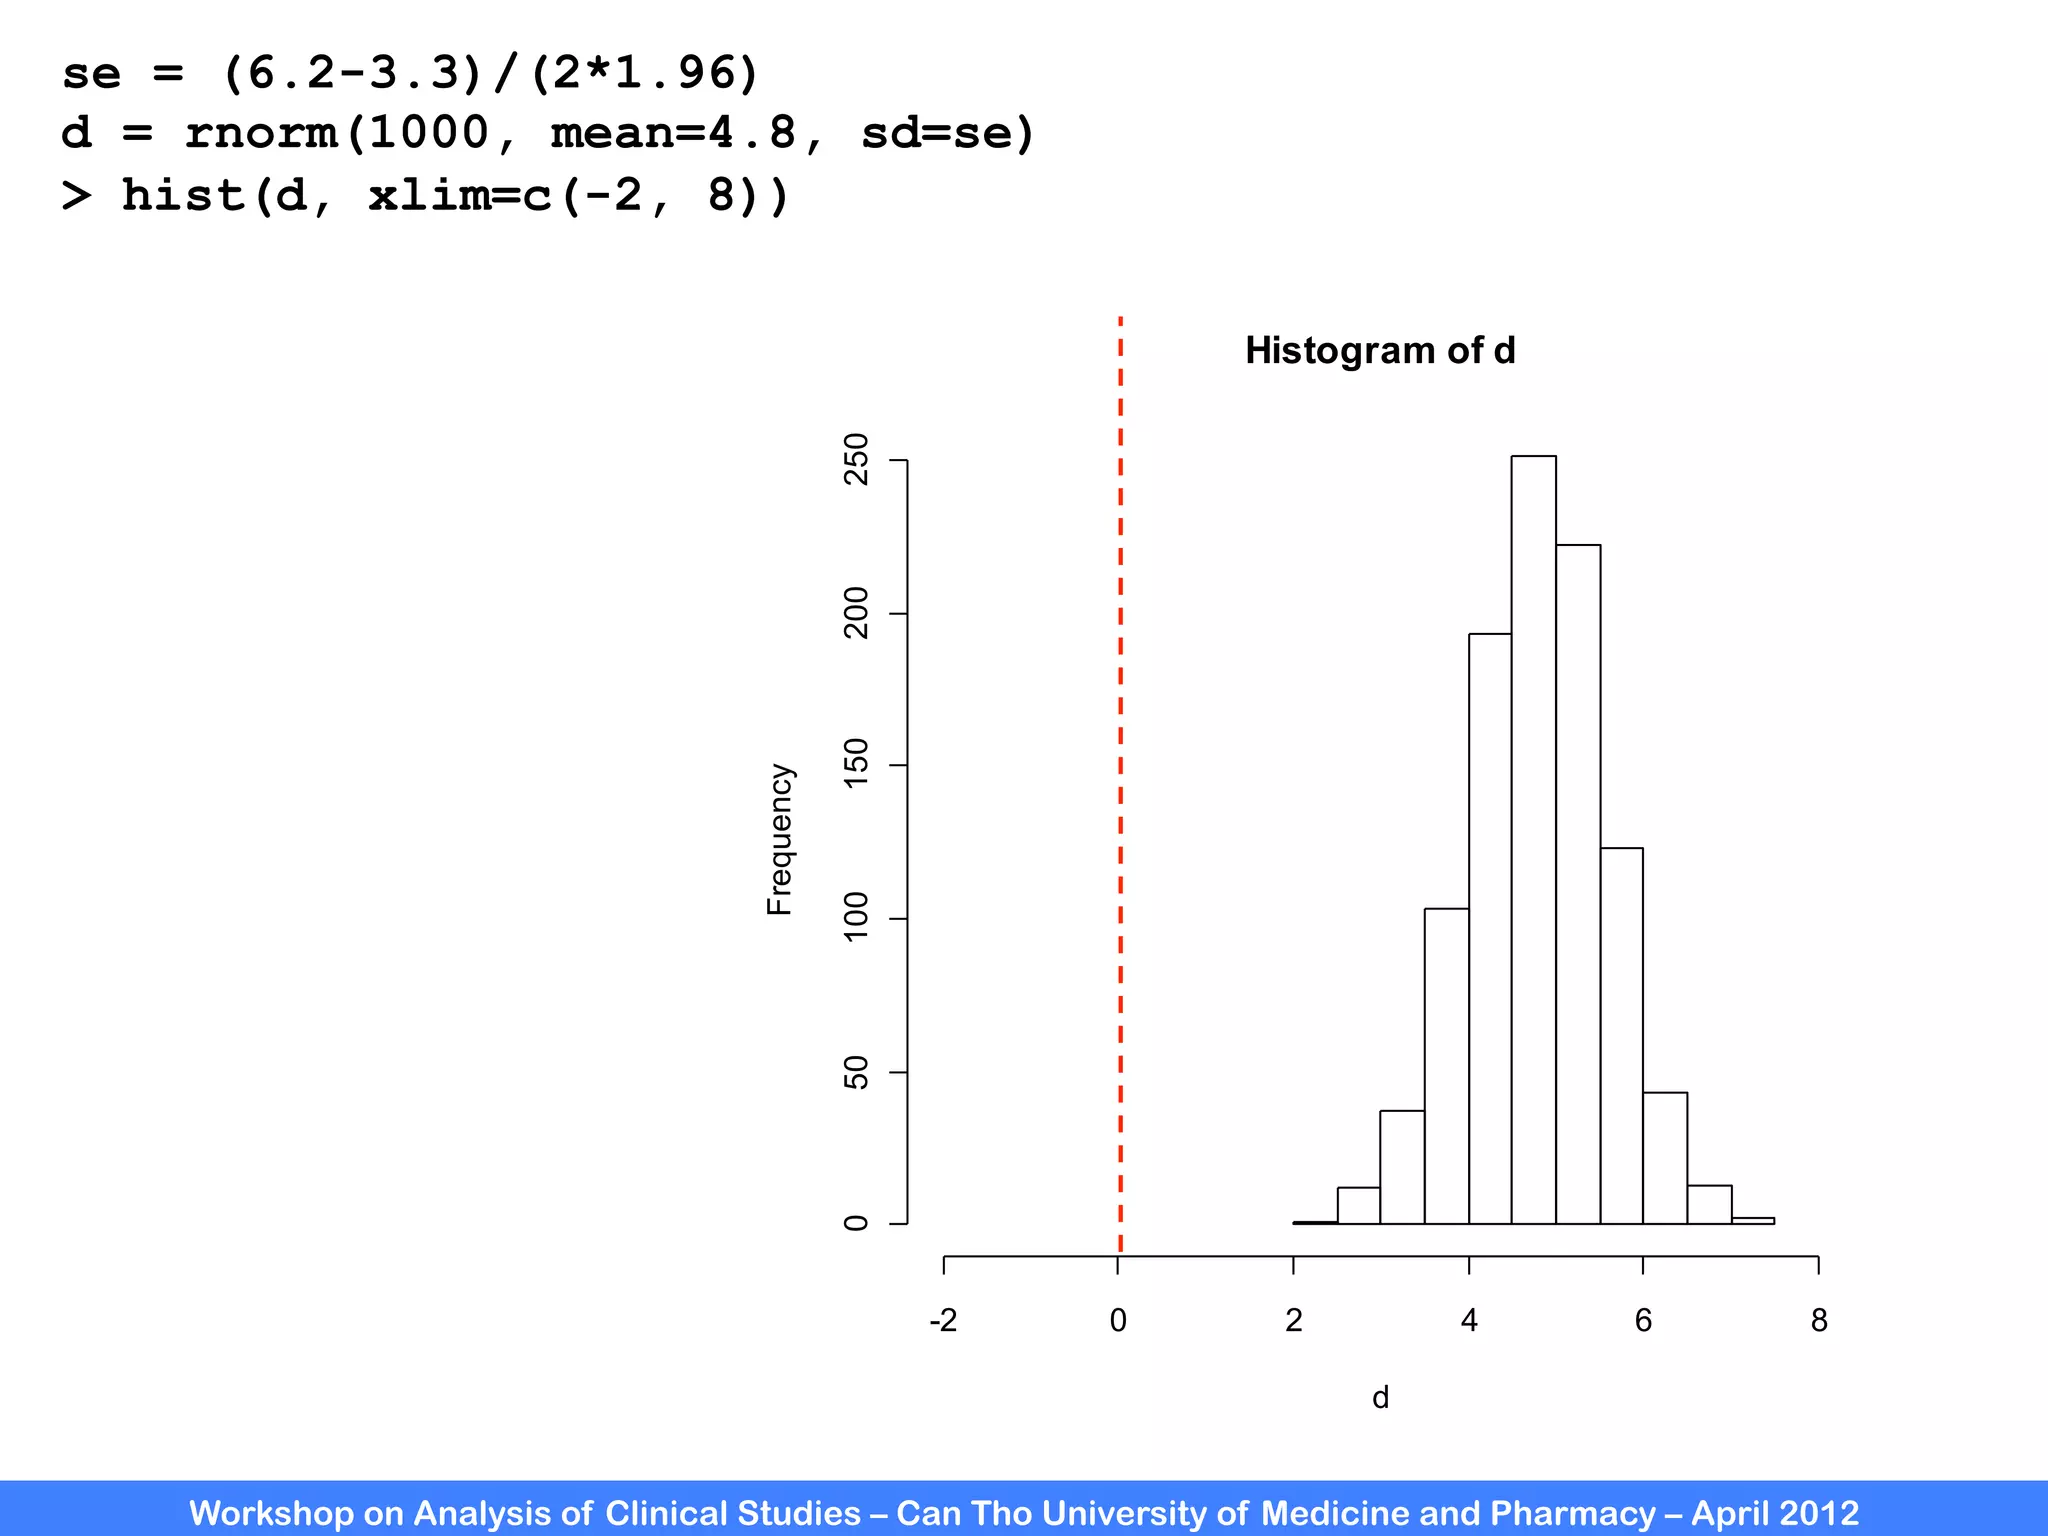
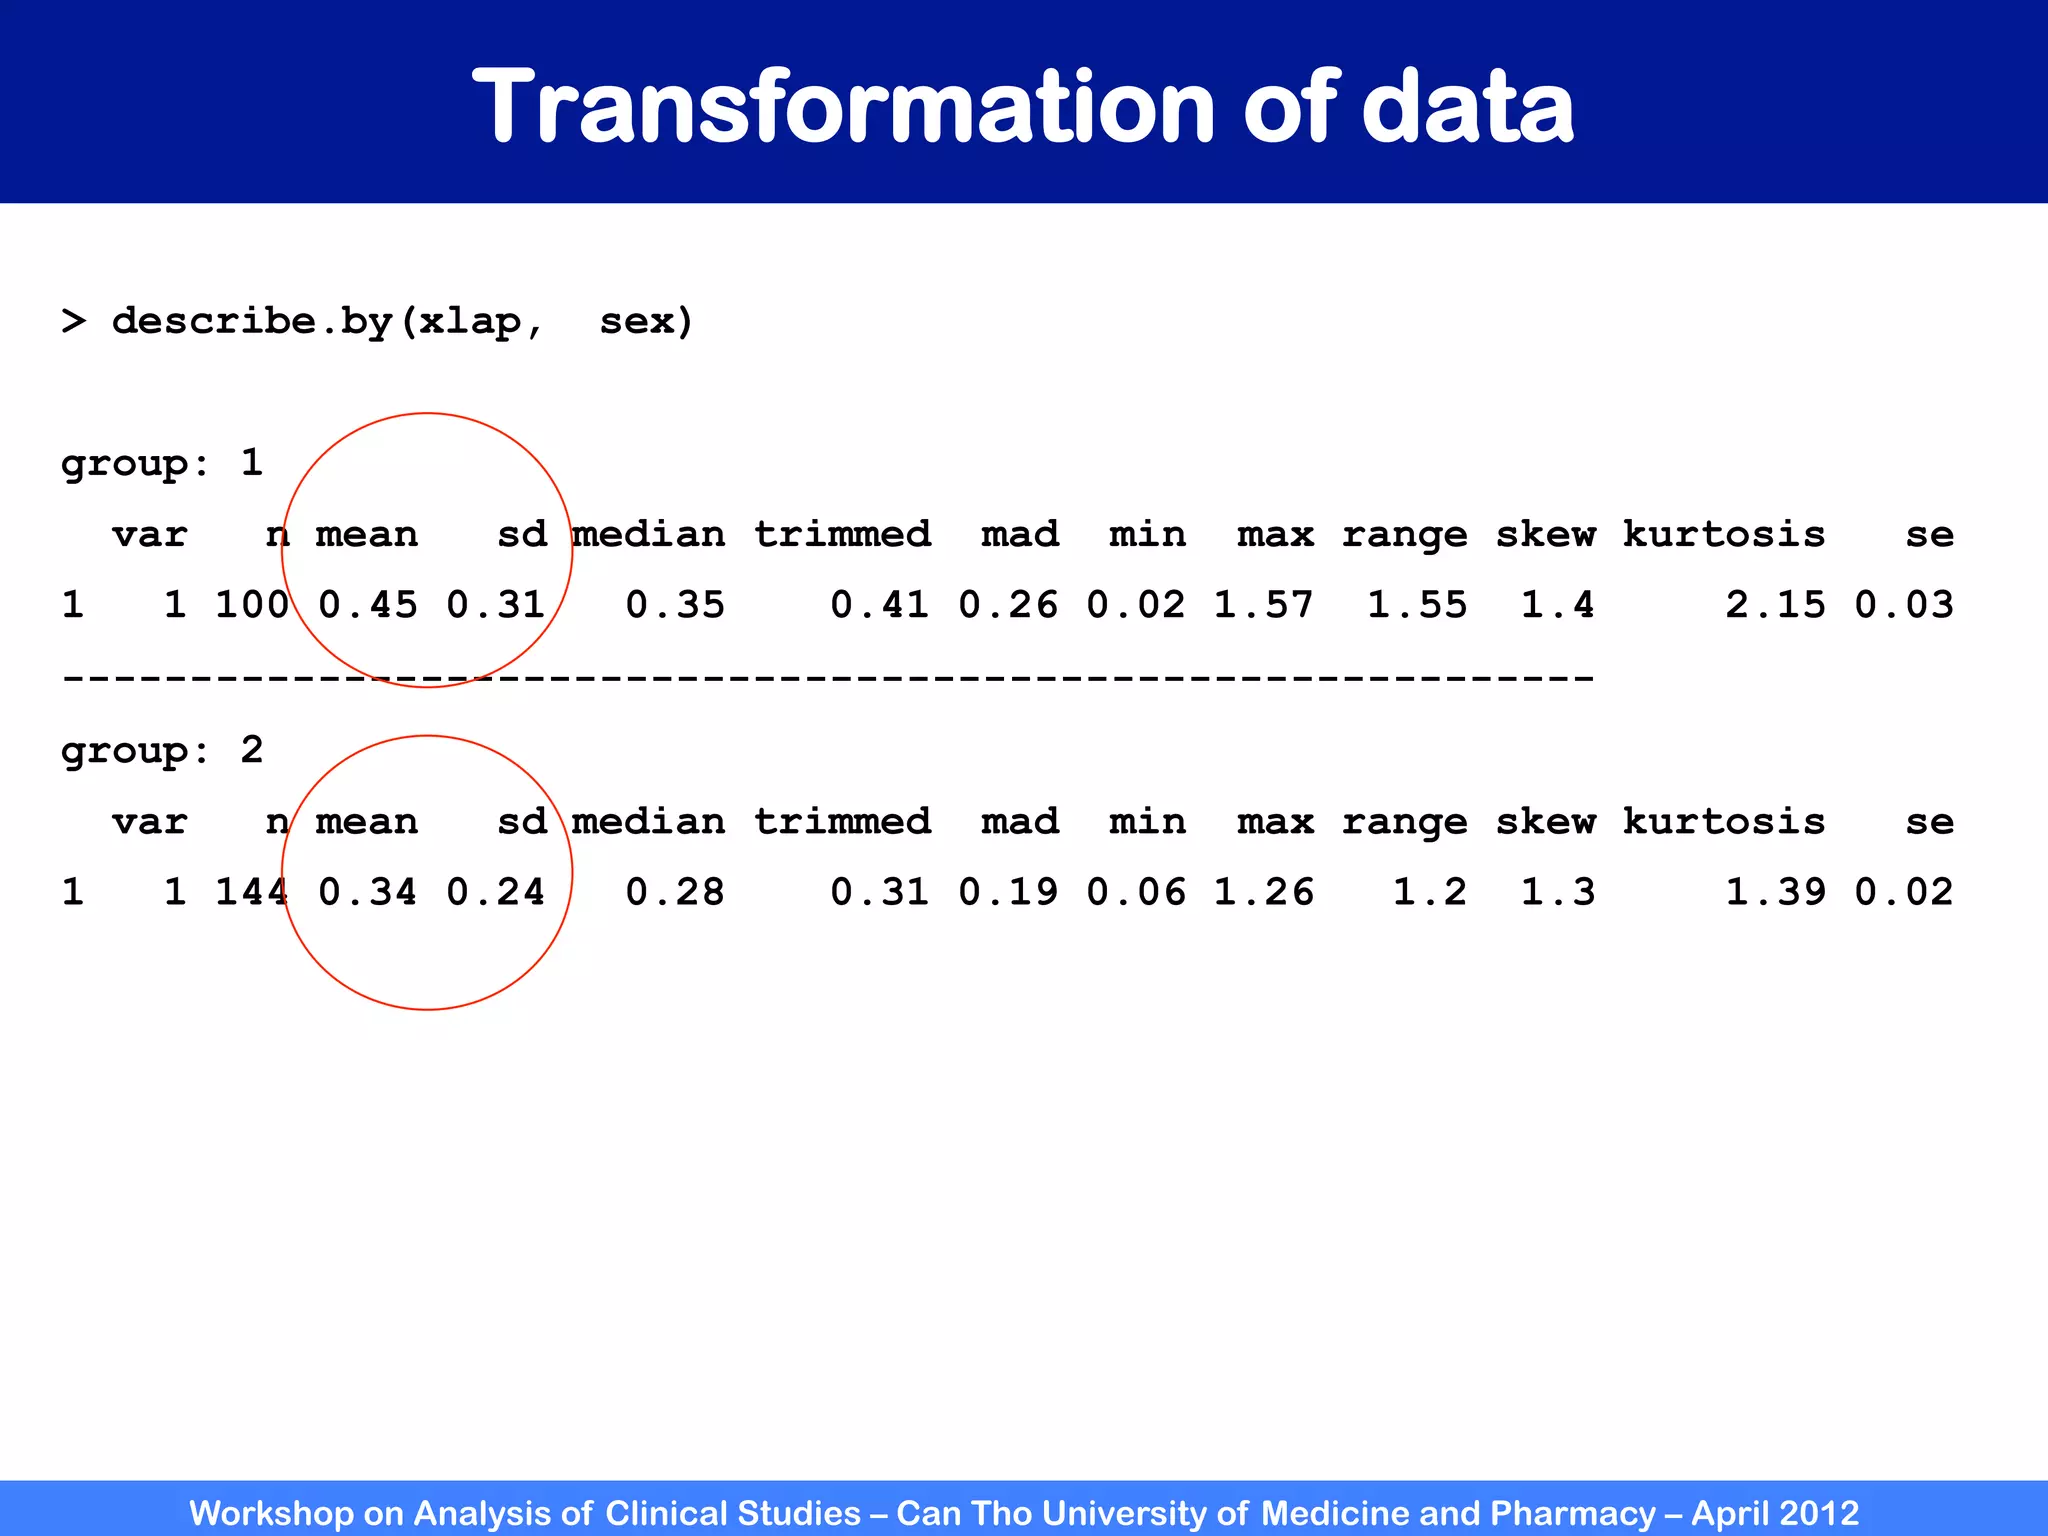
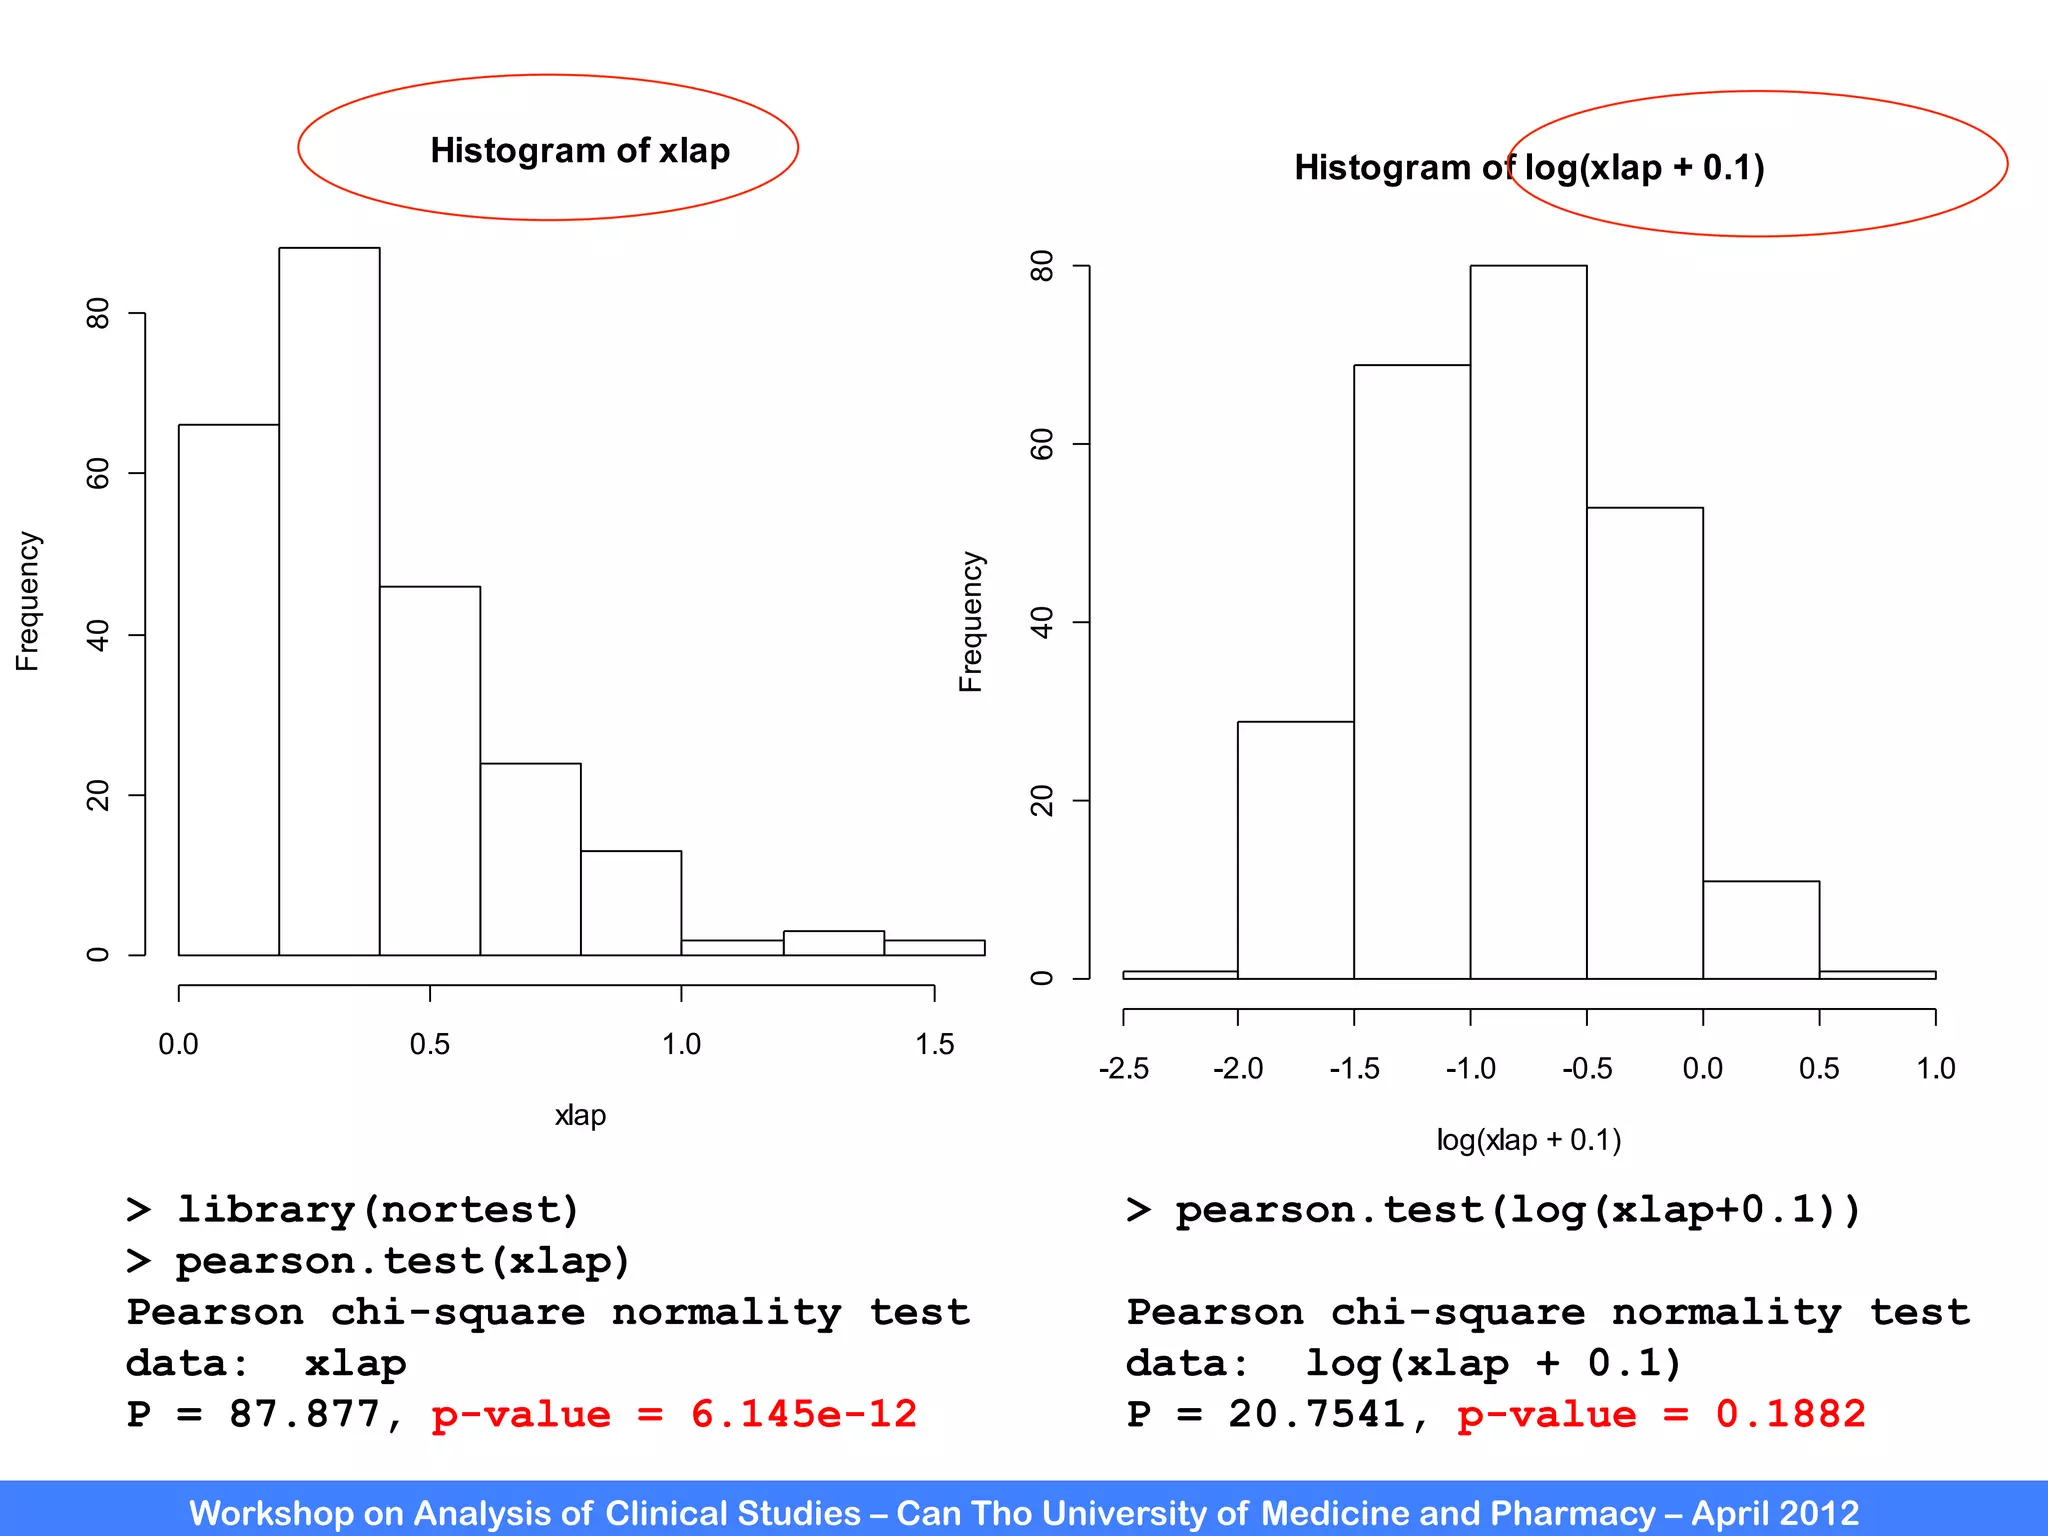
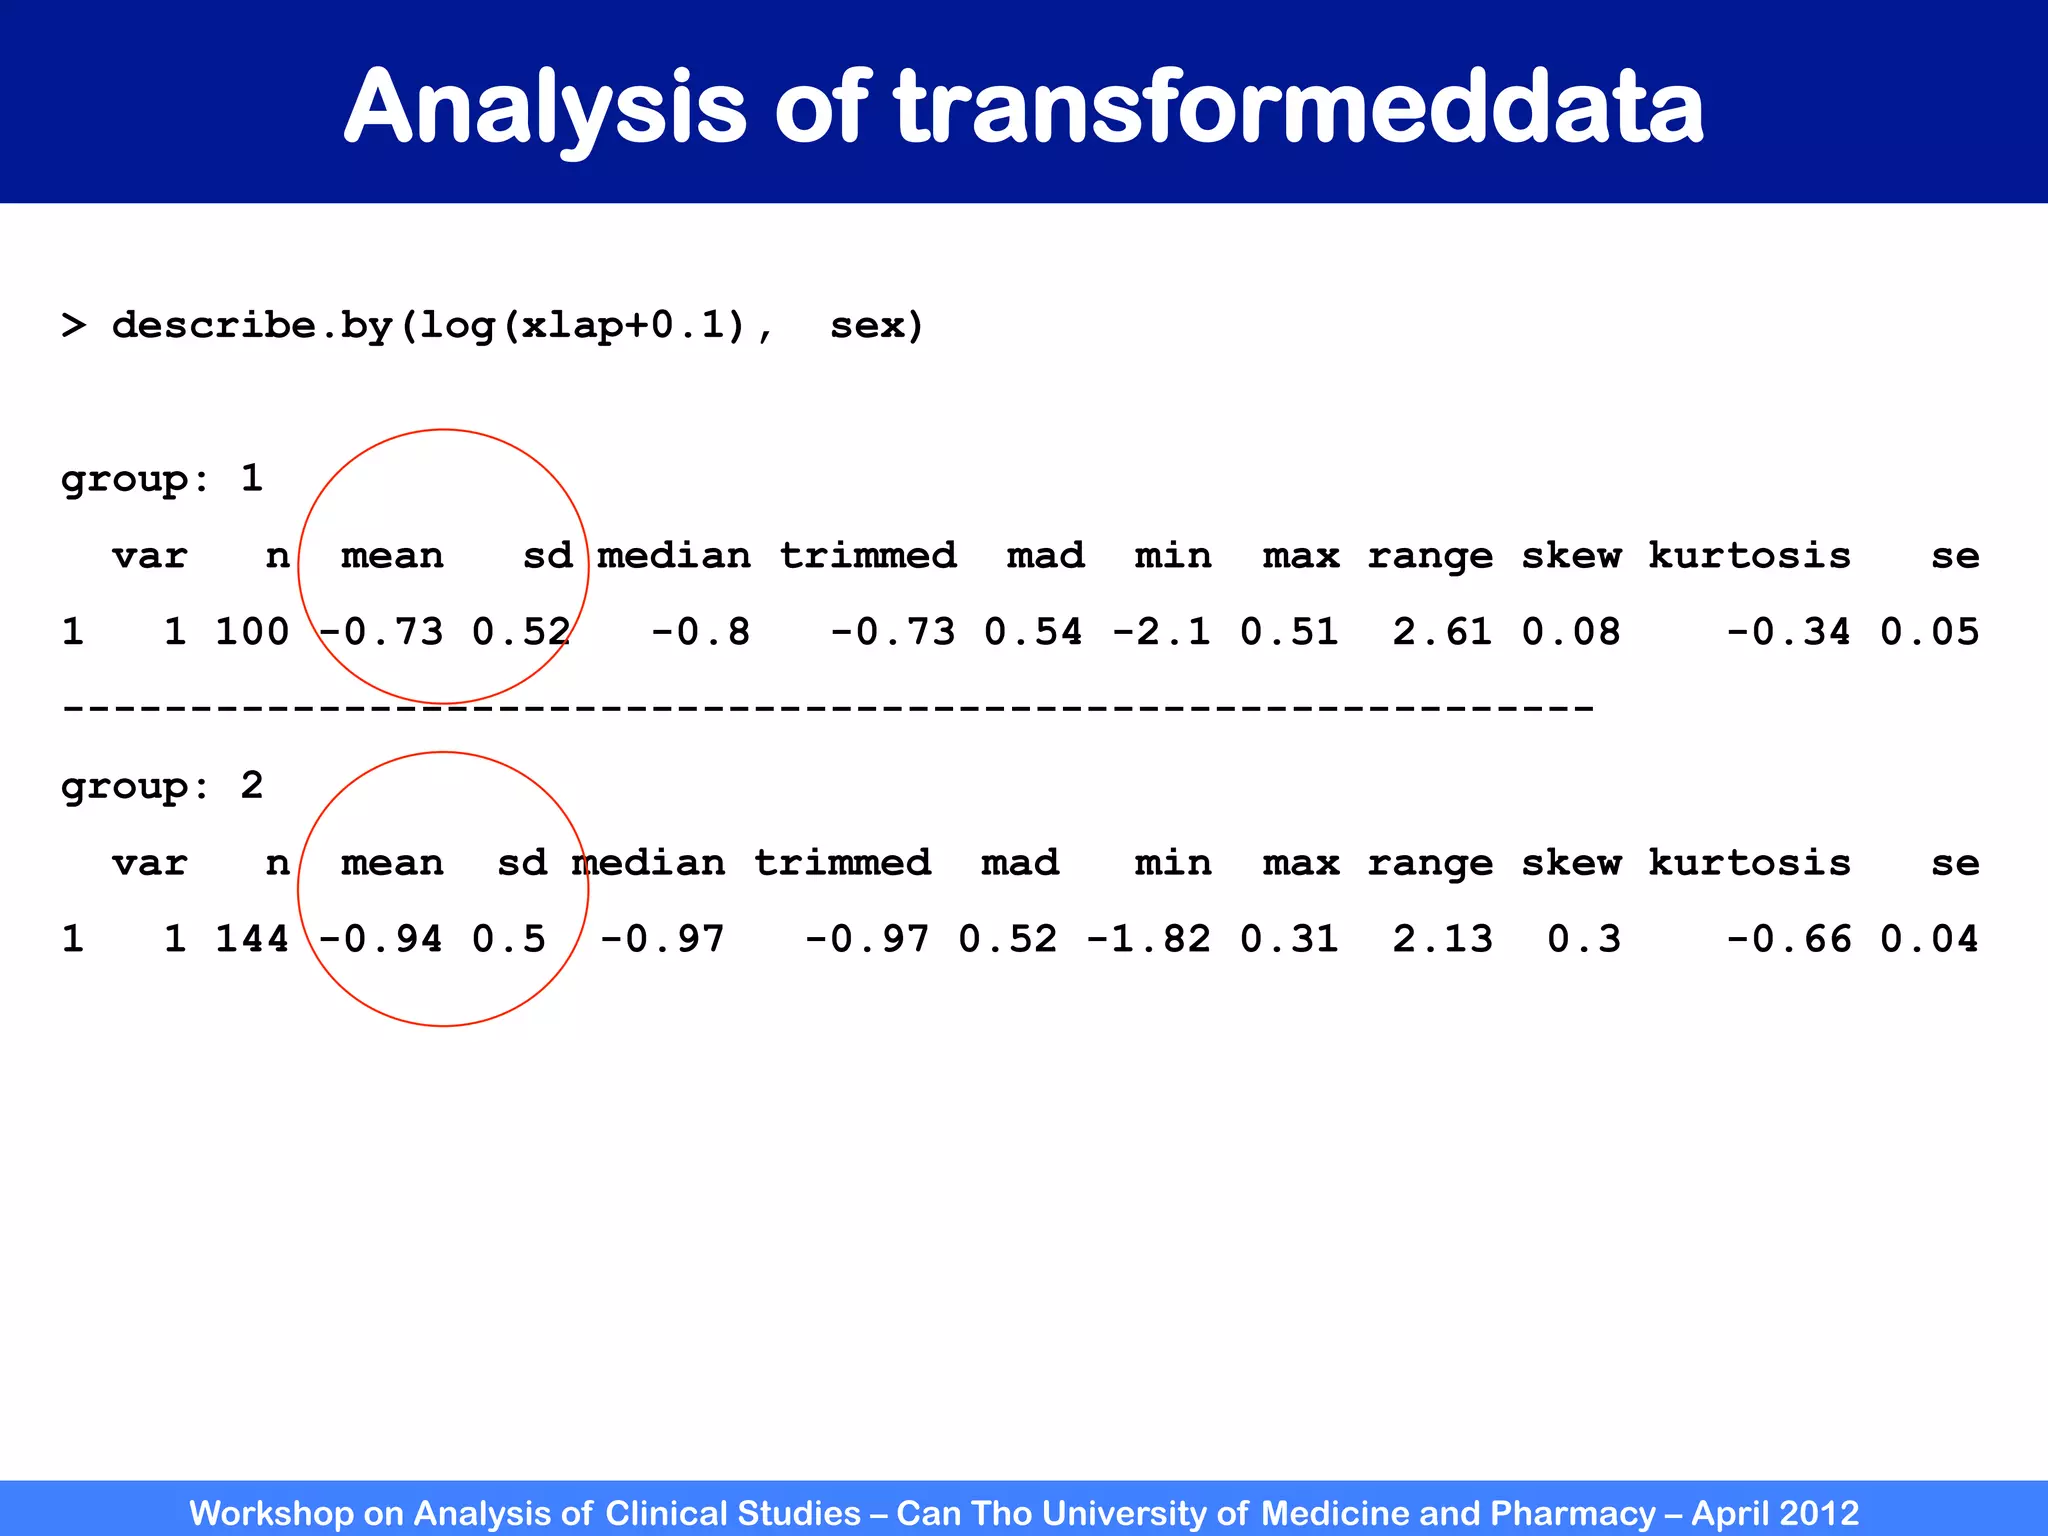
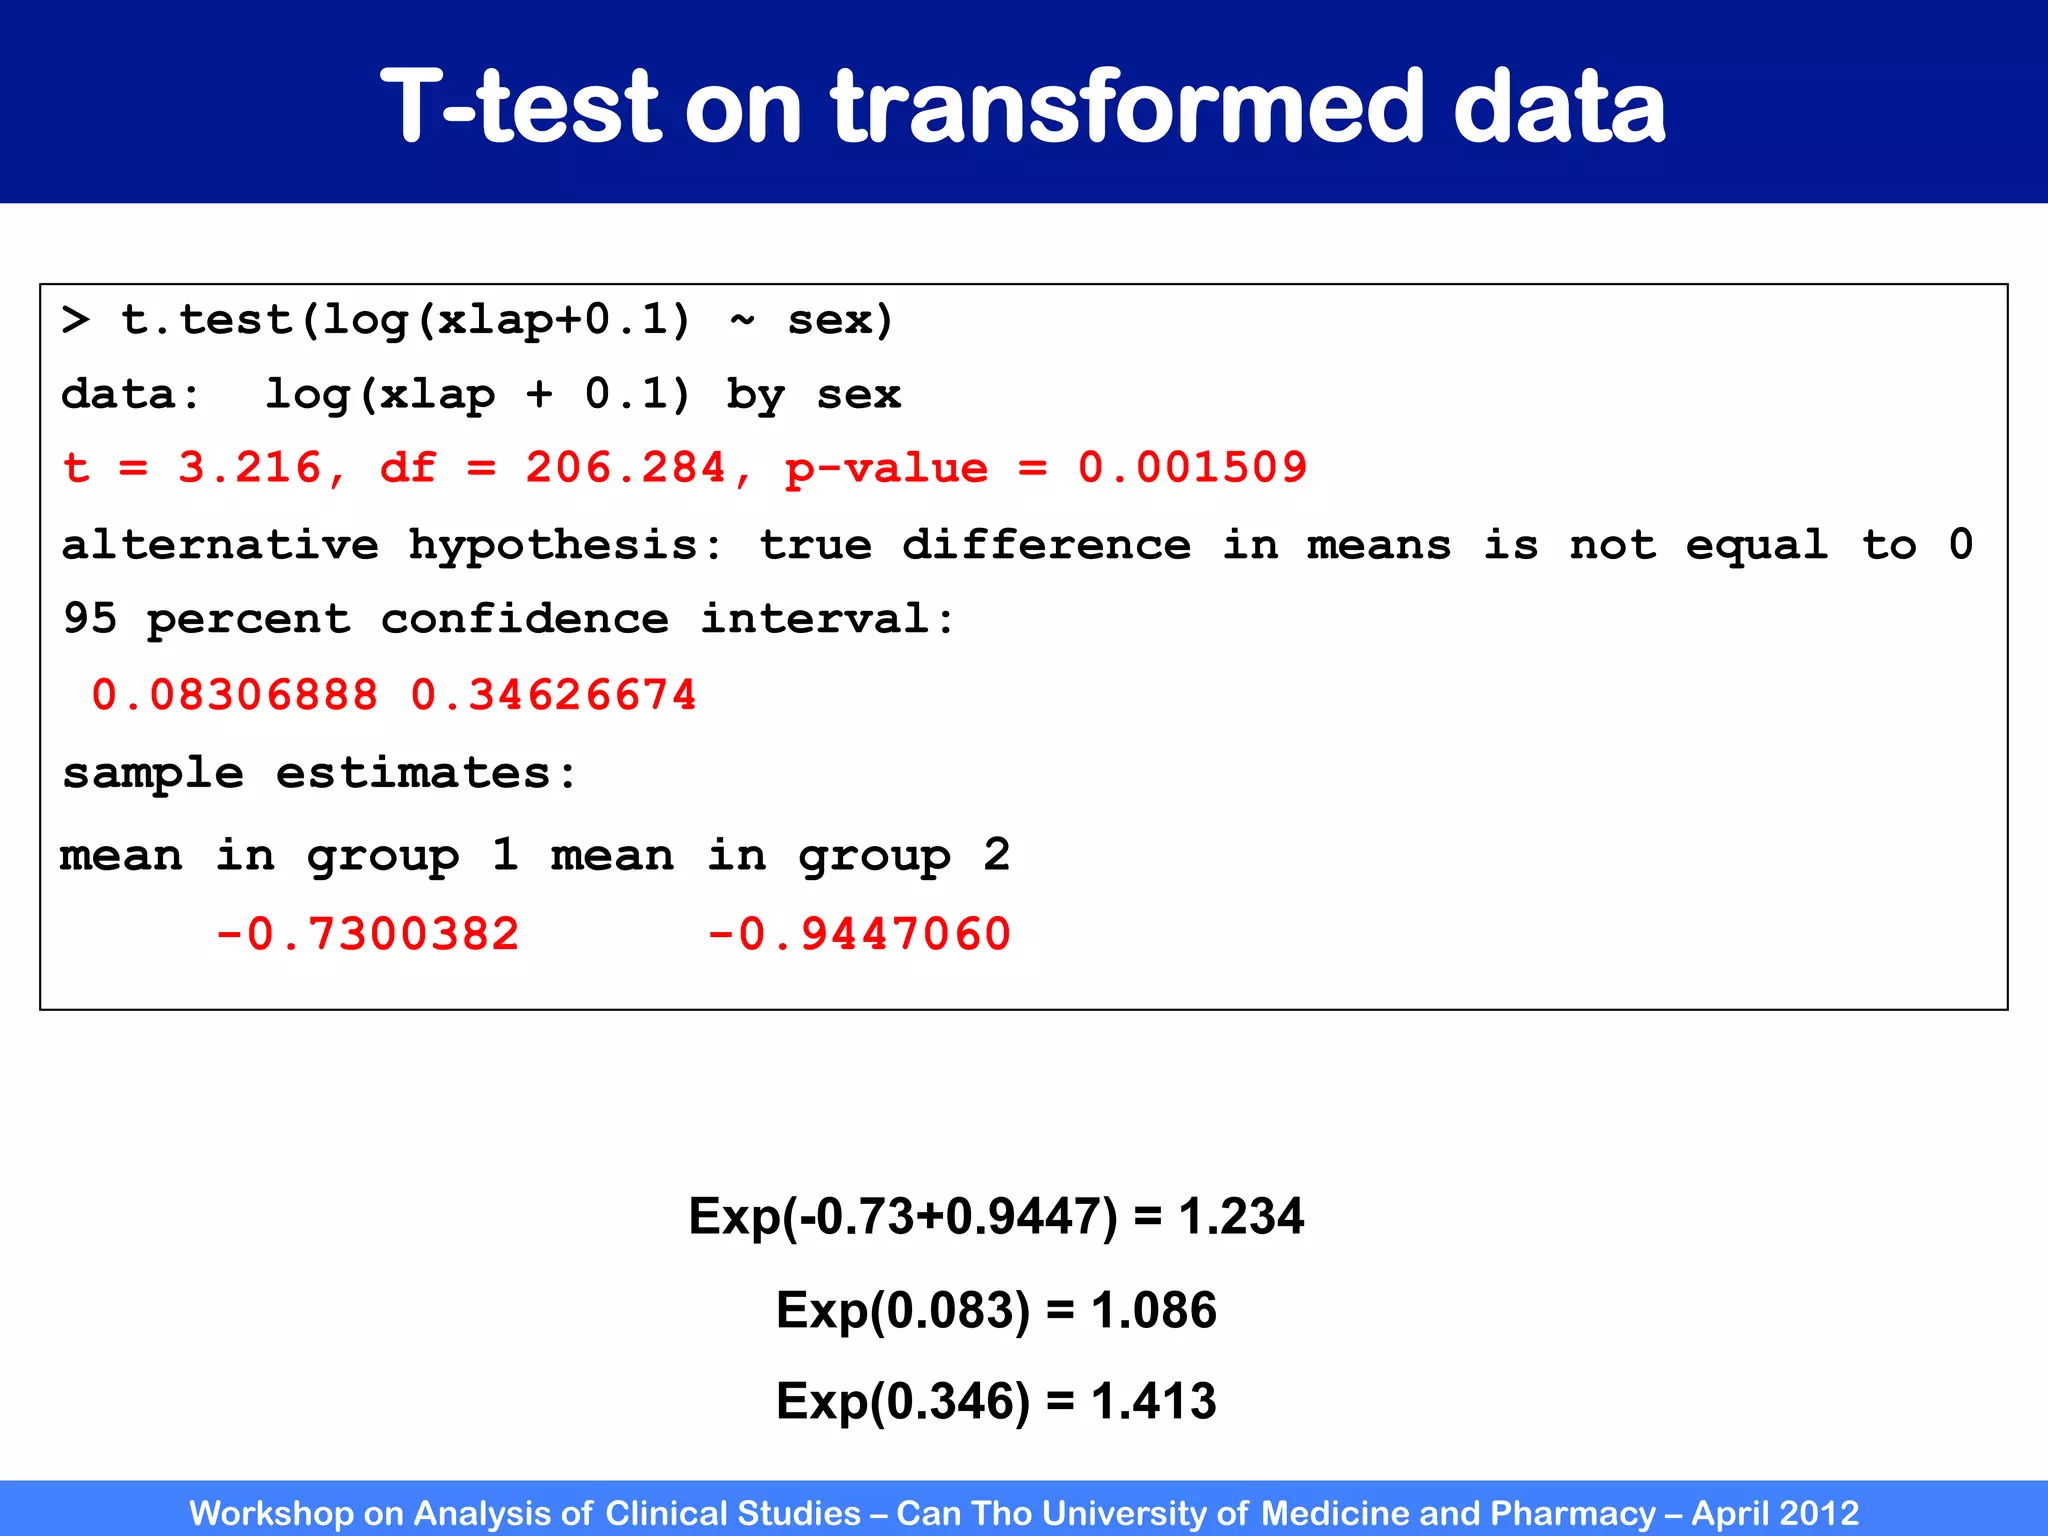
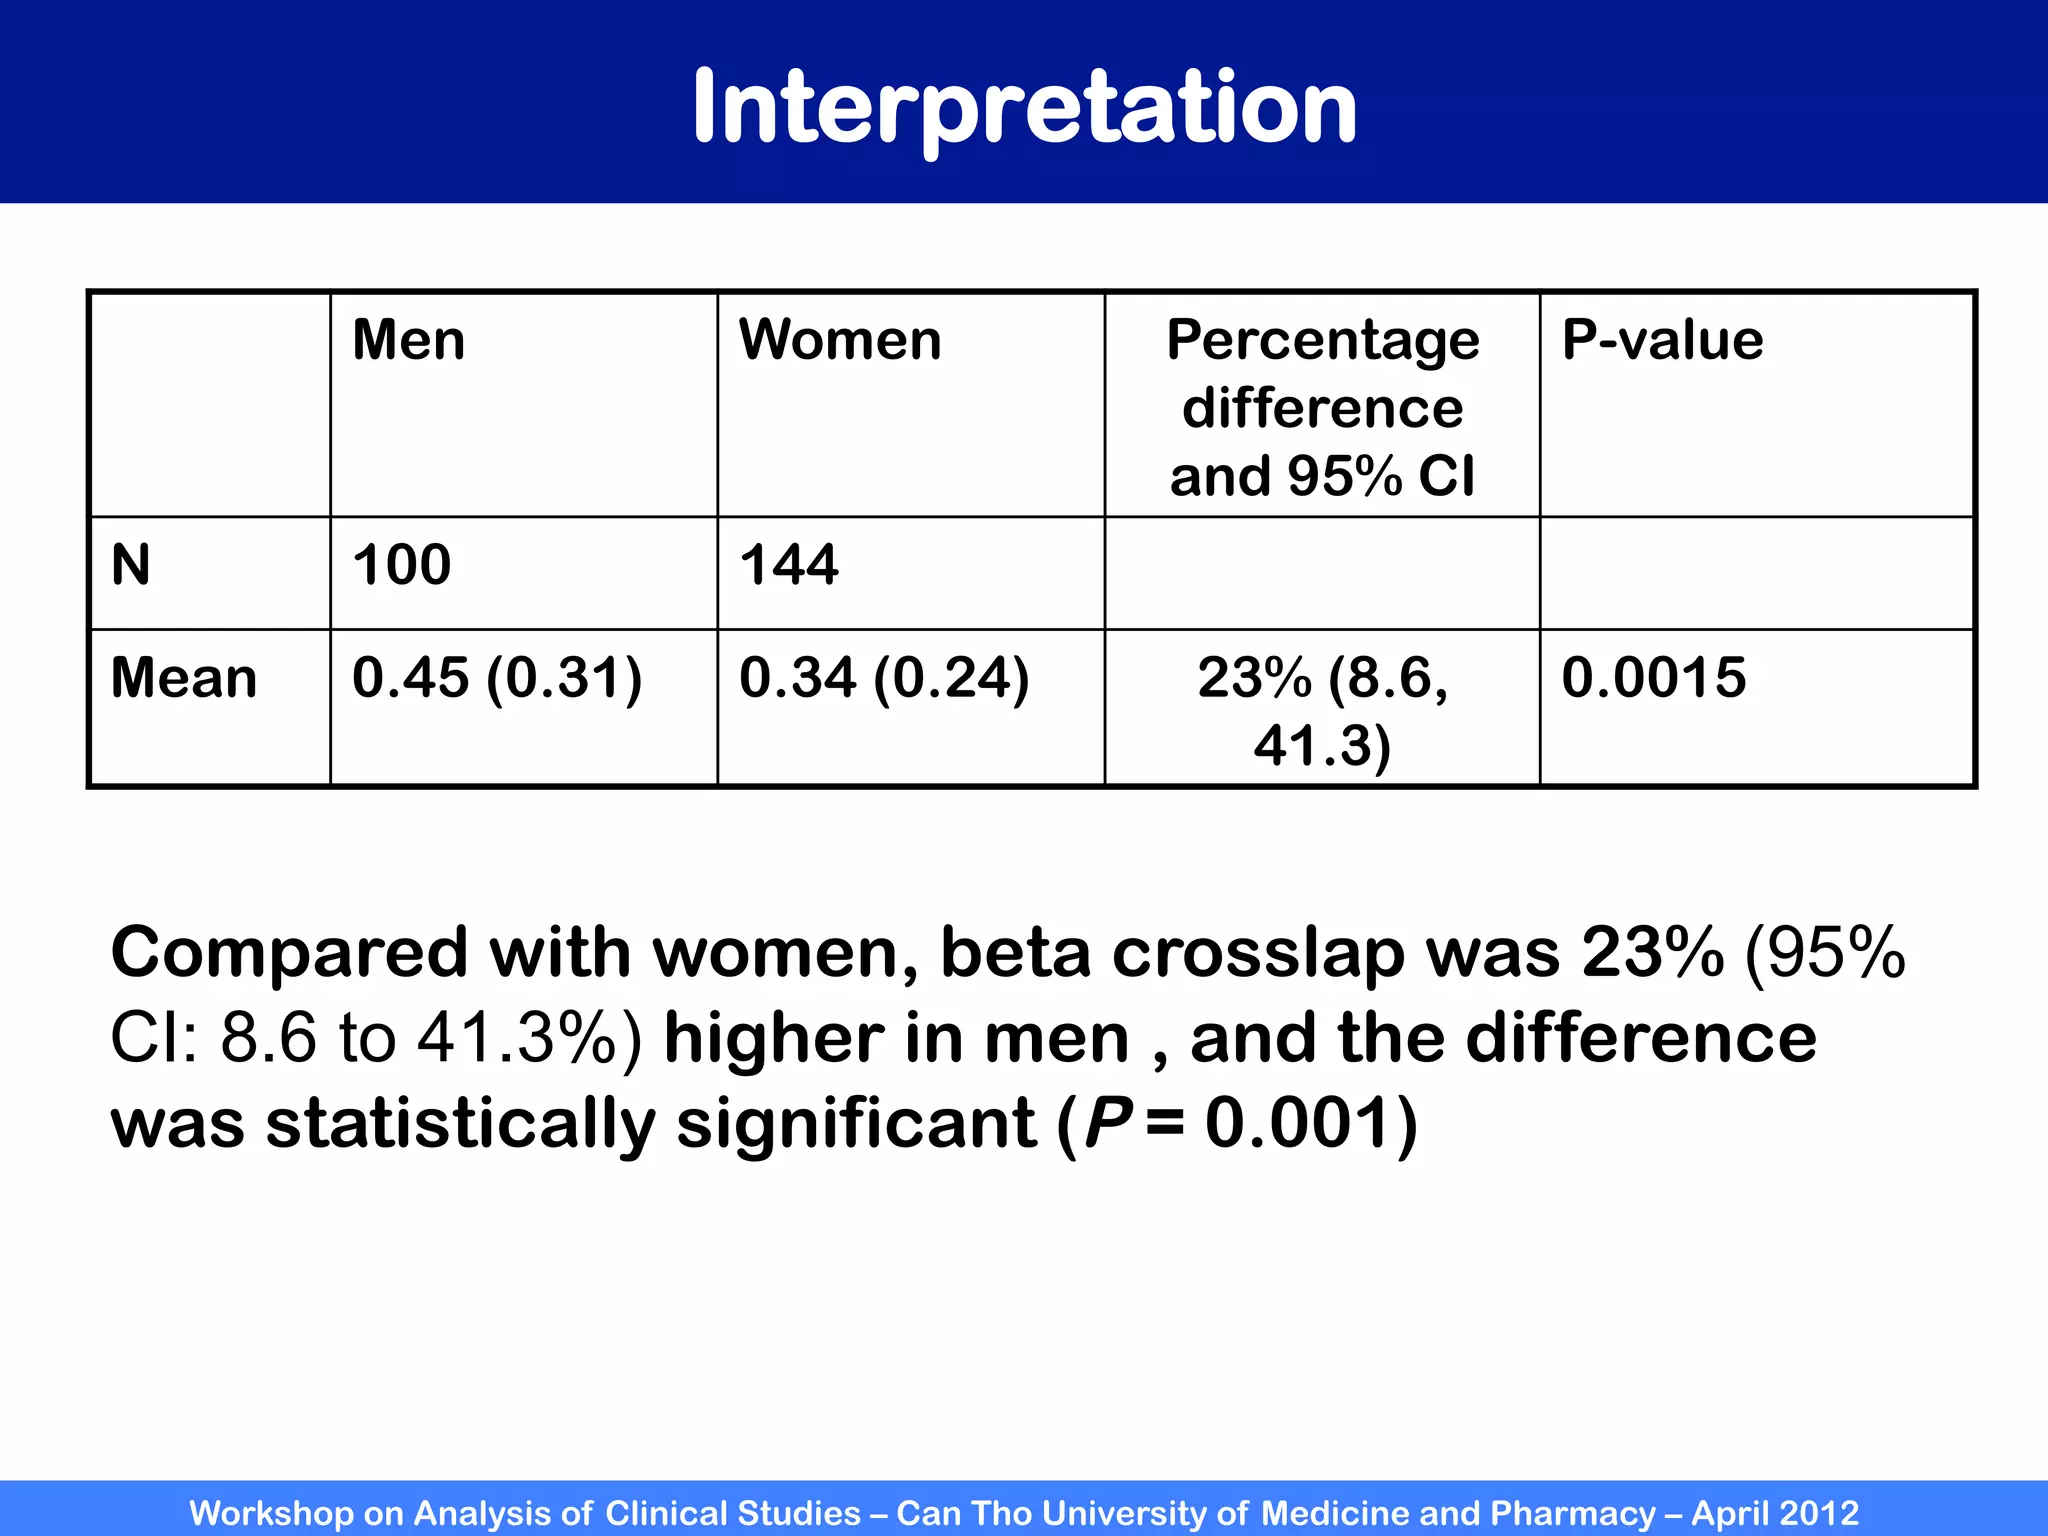
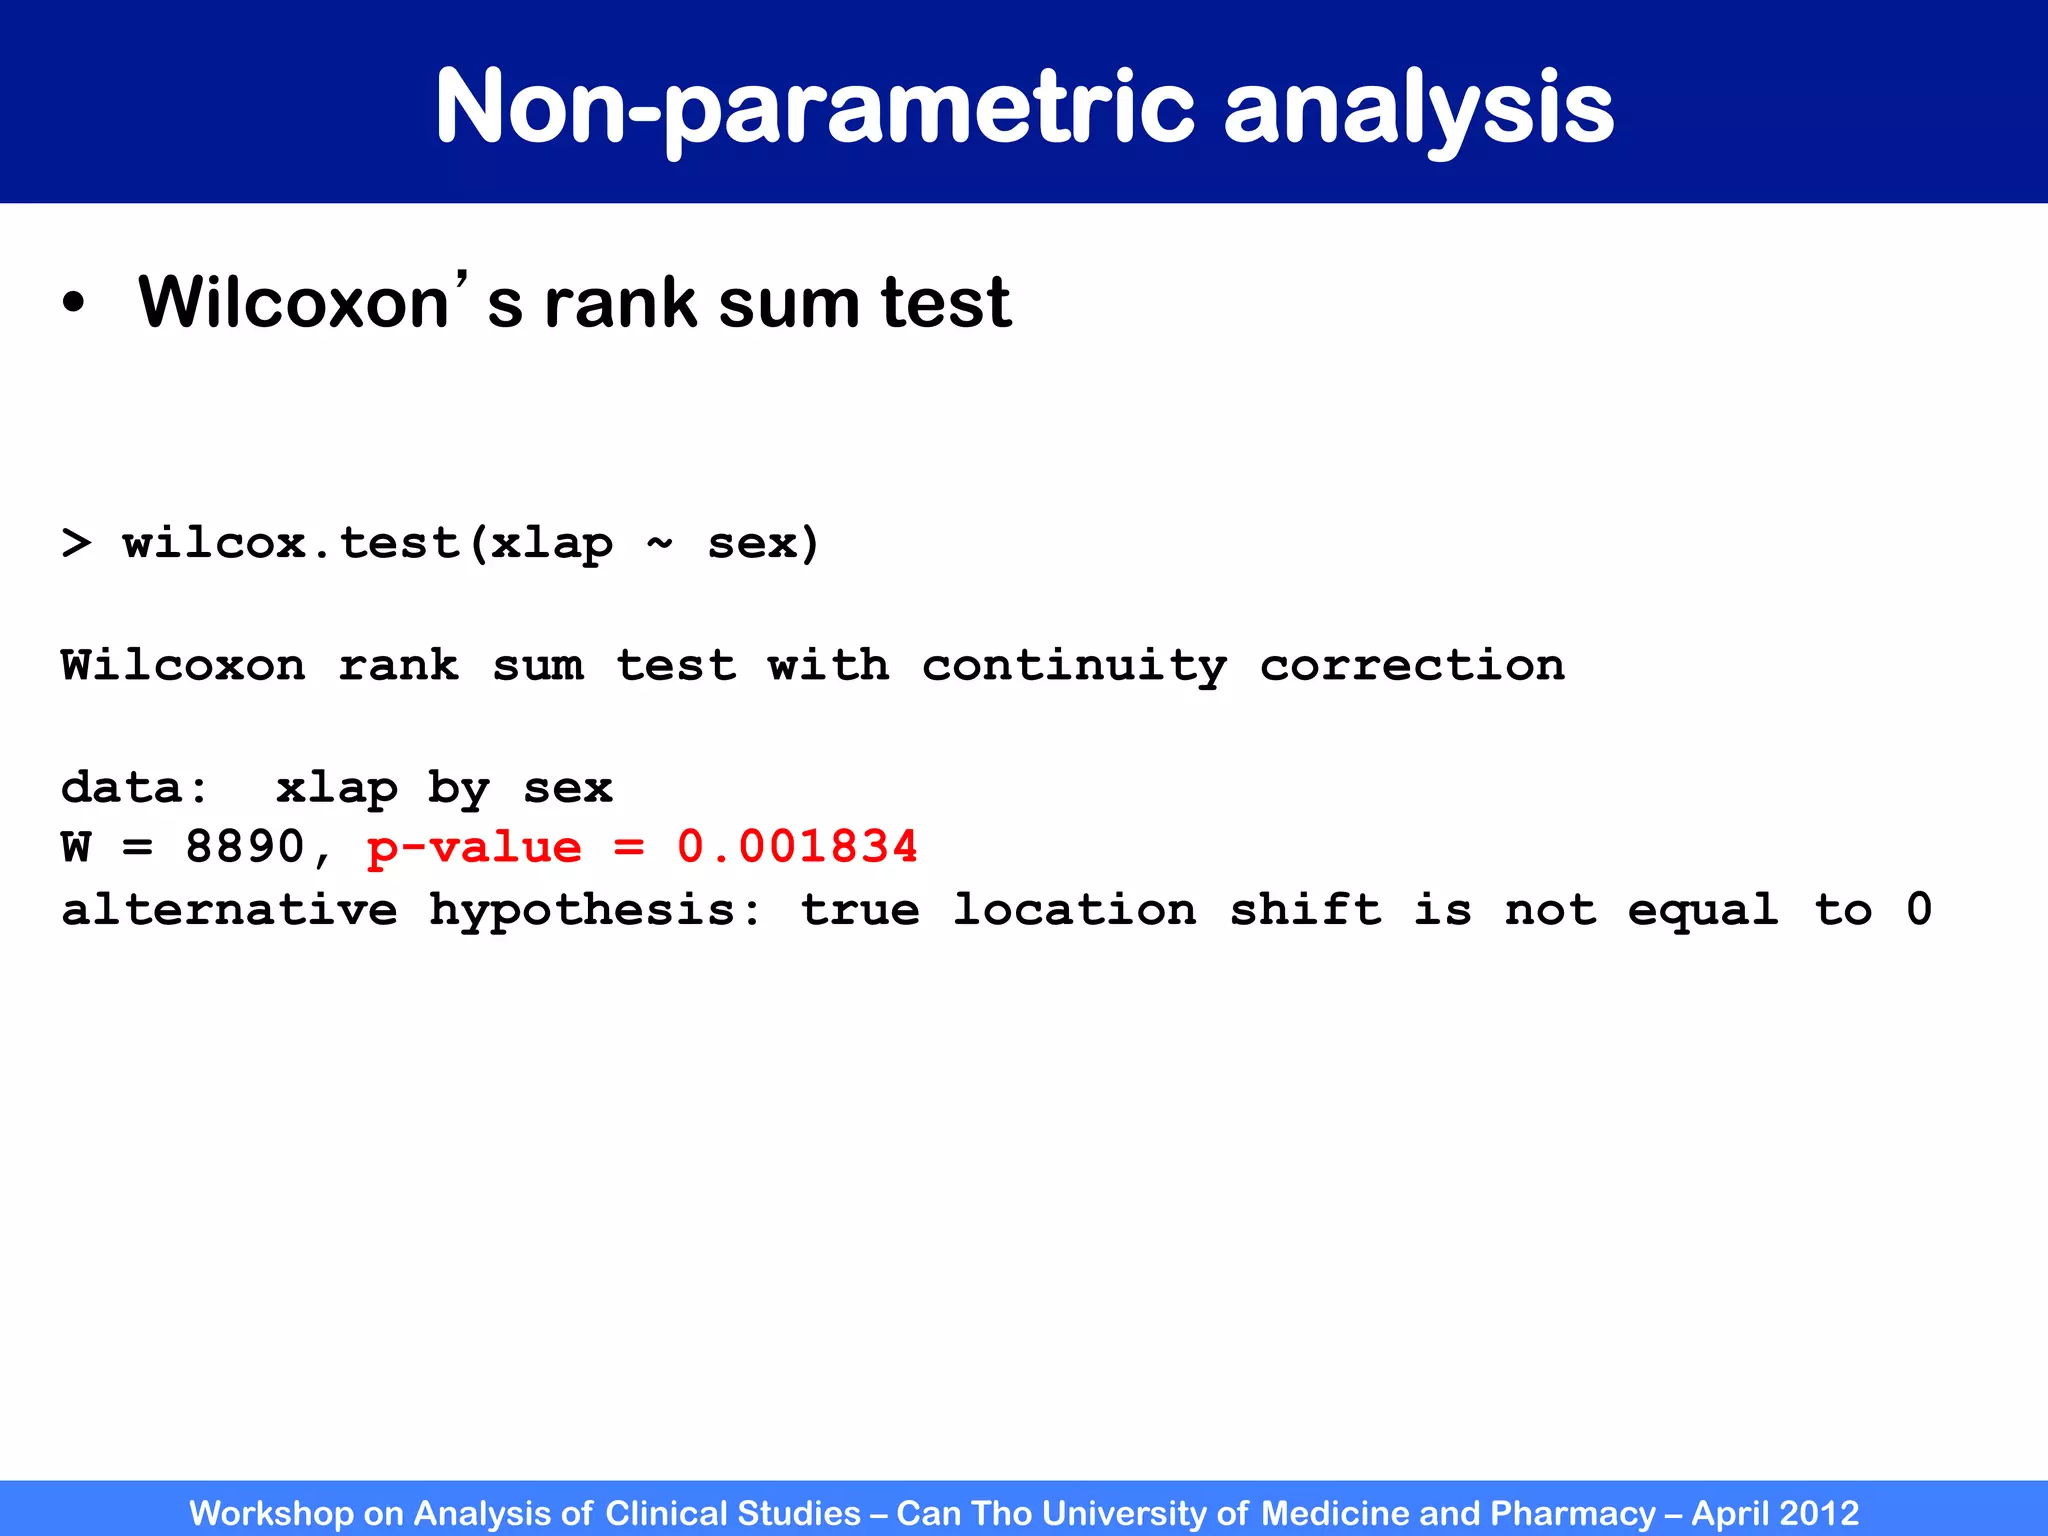
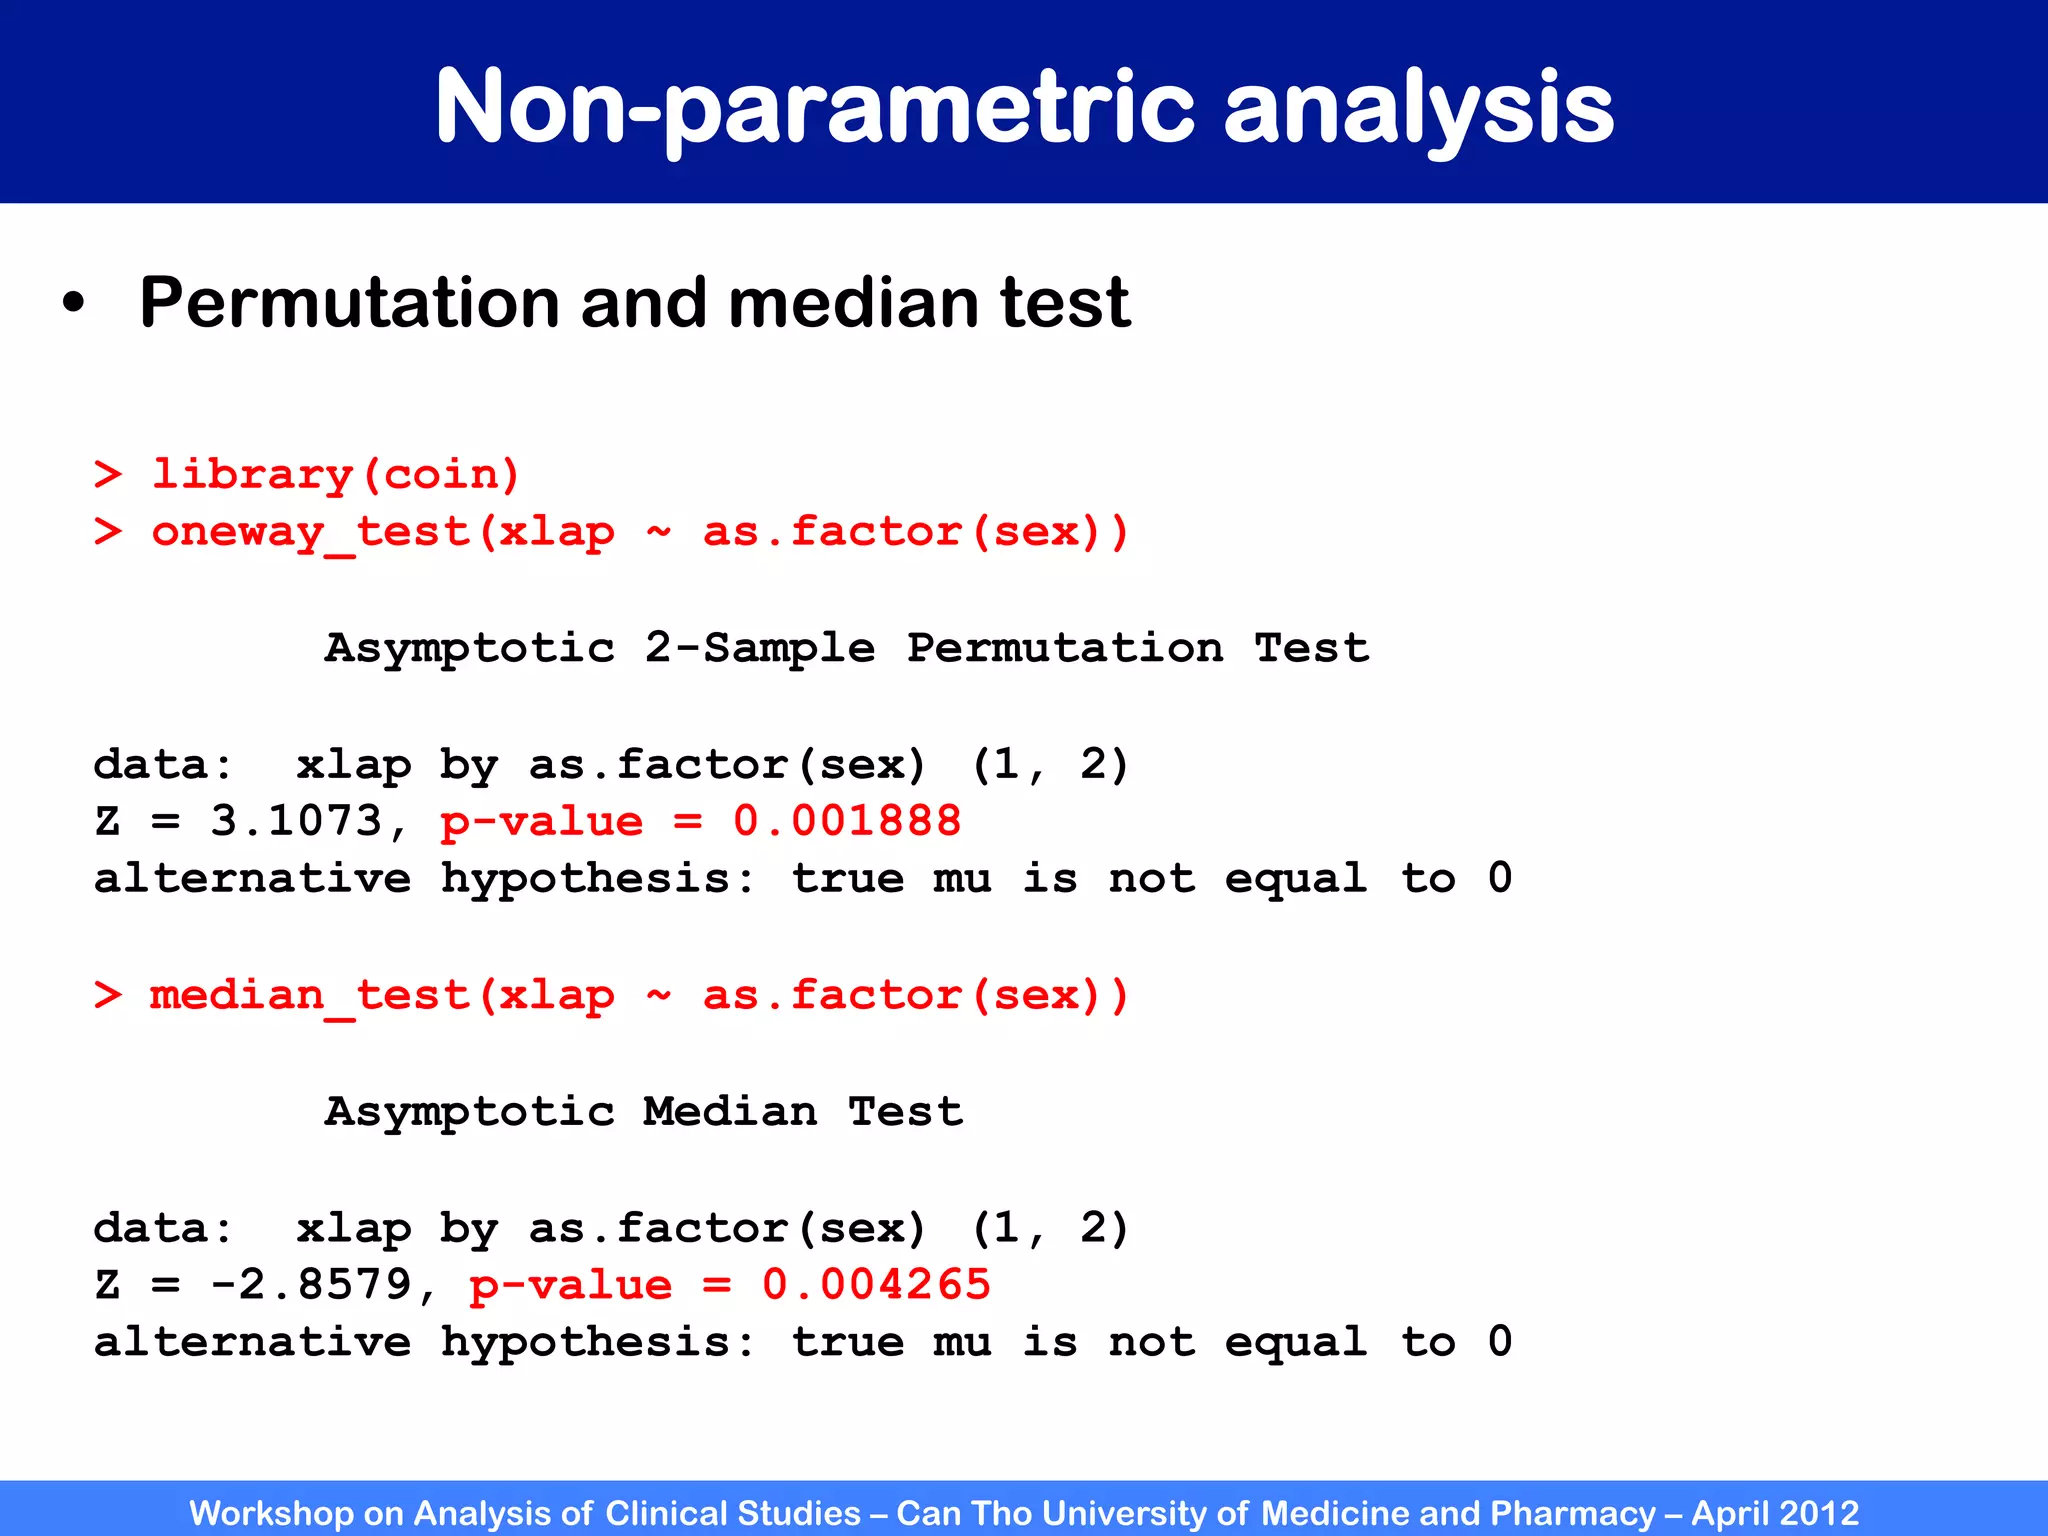

The document summarizes a workshop on analyzing clinical studies that compares two groups with continuous data. It discusses estimating differences between groups, hypothesis testing using t-tests, and interpreting the results, including presenting confidence intervals and p-values. R code is provided to demonstrate performing t-tests and other analyses. Non-parametric tests for continuous data are also briefly covered.


![Measures and feedback 2013 [compatibility mode]](https://cdn.slidesharecdn.com/ss_thumbnails/measuresandfeedback2013compatibilitymode-130123185123-phpapp01-thumbnail.jpg?width=640&height=640&fit=bounds)