Program: B.Tech VIISemester
CSL0777: Machine Learning
Unit No. 1
Data Feature Selection
Lecture No. 07
Mr. Praveen Gupta
Assistant Professor, CSA/SOET
2.
Outlines
• The curseof dimensionality
• Importance of Data Feature Selection
• Feature Selection Techniques
– Univariate Selection
– Recursive Feature Elimination
– Principal ComponentAnalysis (PCA)
– Feature Importance
• References
3.
Student Effective LearningOutcomes(SELO)
01: Ability to understand subject related concepts clearly along with contemporary
issues.
02: Ability to use updated tools, techniques and skills for effective domain specific
practices.
03: Understanding available tools and products and ability to use it effectively.
4.
The curse ofdimensionality
•The curse of dimensionality basically means that the error increases with the
increase in the number of features. It refers to the fact that algorithms are
harder to design in high dimensions and often have a running time exponential
in the dimensions.
•A higher number of dimensions theoretically allow more information to be
stored, but practically it rarely helps due to the higher possibility of noise and
redundancy in the real-world data.
•Gathering a huge number of data may lead to the dimensionality problem
where highly noisy dimensions with fewer pieces of information and without
significant benefit can be obtained due to the large data.
5.
The curse ofdimensionality
•The difficulty in analysing high-dimensional data results from the
conjunction of two effects.
•High-dimensional spaces have geometrical properties which are counter-
intuitive, and far from the properties which can be observed in two-or three-
dimensional spaces.
•Data analysis tools are most often designed having in mind intuitive
properties and examples in low-dimensional spaces and usually, data analysis
tools are best illustrated in 2-or 3-dimensional spaces.
6.
How to combatthe curse of dimensionality
•Dimensionality Reduction:
Dimensionality reduction is a method of converting the high dimensional
variables into lower dimensional variables without changing the specific
information of the variables.
To overcome the issue of the curse of dimensionality, Dimensionality
Reduction is used to reduce the feature space with consideration by a set of
principal features.
Dimensionality Reduction contains no extra variables that make the data
analyzing easier and simple for machine learning algorithms and resulting in
a faster outcome from the algorithms.
7.
Importance of DataFeature Selection
•The performance of machine learning model is directly proportional to the
data features used to train it. The performance of ML model will be affected
negatively if the data features provided to it are irrelevant.
•On the other hand, use of relevant data features can increase the accuracy of
your ML model especially linear and logistic regression.
•Now the question arise that what is automatic feature selection?
•It may be defined as the process with the help of which we select those
features in our data that are most relevant to the output or prediction variable
in which we are interested. It is also called attribute selection.
8.
Importance of DataFeature Selection
•The following are some of the benefits of automatic feature selection before
modeling the data:
•Performing feature selection before data modeling will reduce the
overfitting.
•Performing feature selection before data modeling will increases the
accuracy of ML model.
•Performing feature selection before data modeling will reduce the
training time
9.
Feature Selection Techniques
UnivariateSelection:
This feature selection technique is very useful in selecting best
features, with the help of statistical testing, having strongest
relationship with the prediction variables. We can implement
univariate feature selection technique with the help of
SelectKBest class of scikit-learn Python library.
10.
Univariate Selection
Example:
In thisexample, we will use Pima Indians Diabetes dataset to select 4 of the
attributes having best features with the help of chi-square statistical test.
from pandas import read_csv
from numpy import set_printoptions
from sklearn.feature_selection import SelectKBest
from sklearn.feature_selection import chi2
path = r'C:pima-indians-diabetes.csv'
names = ['preg', 'plas', 'pres', 'skin', 'test', 'mass', 'pedi', 'age', 'class']
dataframe = read_csv(path, names=names)
array = dataframe.values
11.
Univariate Selection
Example:
Next, wewill separate array into input and output components:
X = array[:,0:8]
Y = array[:,8]
The following lines of code will select the best features from dataset:
test = SelectKBest(score_func=chi2, k=4)
fit = test.fit(X,Y)
12.
Univariate Selection
Example:
We canalso summarize the data for output as per our choice. Here, we are
setting the precision to 2 and showing the 4 data attributes with best features
along with best score of each attribute:
set_printoptions(precision=2)
print(fit.scores_)
featured_data = fit.transform(X)
print ("nFeatured data:n", featured_data[0:4])
Feature Selection Techniques
RecursiveFeature Elimination :
As the name suggests, RFE (Recursive feature elimination) feature
selection technique removes the attributes recursively and builds
the model with remaining attributes. We can implement RFE
feature selection technique with the help of RFE class of scikit-
learn Python library.
15.
Recursive Feature Elimination
Example:
Inthis example, we will use RFE with logistic regression algorithm to select the
best 3 attributes having the best features from Pima Indians Diabetes dataset.
from pandas import read_csv
from sklearn.feature_selection import RFE
from sklearn.linear_model import LogisticRegression
path = r'C:pima-indians-diabetes.csv'
names = ['preg', 'plas', 'pres', 'skin', 'test', 'mass', 'pedi', 'age', 'class']
dataframe = read_csv(path, names=names)
array = dataframe.values
16.
Recursive Feature Elimination
Example:
Next,we will separate array into input and output components:
X = array[:,0:8]
Y = array[:,8]
The following lines of code will select the best features from dataset:
model = LogisticRegression()
rfe = RFE(model, 3)
fit = rfe.fit(X, Y)
print("Number of Features: %d")
print("Selected Features: %s")
print("Feature Ranking: %s“)
17.
Recursive Feature Elimination
Example:
Output
Numberof Features: 3
Selected Features: [ True False False False False True True False]
Feature Ranking: [1 2 3 5 6 1 1 4]
Note: We can see in above output, RFE choose preg, mass and pedi as the first
3 best features. They are marked as 1 in the output.
18.
Feature Selection Techniques
PrincipalComponent Analysis (PCA):
PCA, generally called data reduction technique, is very useful
feature selection technique as it uses linear algebra to transform
the dataset into a compressed form. We can implement PCA
feature selection technique with the help of PCA class of scikit-
learn Python library. We can select number of principal
components in the output.
19.
Principal Component Analysis(PCA)
Example:
In this example, we will use PCA to select best 3 Principal components from
Pima Indians Diabetes dataset.
from pandas import read_csv
from sklearn.decomposition import PCA
path = r'C:pima-indians-diabetes.csv'
names = ['preg', 'plas', 'pres', 'skin', 'test', 'mass', 'pedi', 'age', 'class']
dataframe = read_csv(path, names=names)
array = dataframe.values
20.
Principal Component Analysis(PCA)
Example:
Next, we will separate array into input and output components:
X = array[:,0:8]
Y = array[:,8]
The following lines of code will select the best features from dataset:
pca = PCA(n_components=3)
fit = pca.fit(X)
print("Explained Variance: %s“ % fit.explained_variance_ratio_)
print(fit.components_)
21.
Principal Component Analysis(PCA)
Example:
Output
Explained Variance: [ 0.88854663 0.06159078 0.02579012]
[[ -2.02176587e-03 9.78115765e-02 1.60930503e-02 6.07566861e-02
9.93110844e-01 1.40108085e-02 5.37167919e-04 -3.56474430e-03]
[ 2.26488861e-02 9.72210040e-01 1.41909330e-01 -5.78614699e-02
-9.46266913e-02 4.69729766e-02 8.16804621e-04 1.40168181e-01]
[ -2.24649003e-02 1.43428710e-01 -9.22467192e-01 -3.07013055e-01
2.09773019e-02 -1.32444542e-01 -6.39983017e-04 -1.25454310e-01]]
Note: We can observe from the above output that 3 Principal Components
bear little resemblance to the source data.
22.
Feature Selection Techniques
FeatureImportance :
As the name suggests, feature importance technique is used to
choose the importance features. It basically uses a trained
supervised classifier to select features. We can implement this
feature selection technique with the help of ExtraTreeClassifier
class of scikit-learn Python library.
23.
Feature Importance
Example:
In thisexample, we will use ExtraTreeClassifier to select features from Pima
Indians Diabetes dataset.
from pandas import read_csv
from sklearn.ensemble import ExtraTreesClassifier
path = r'C:pima-indians-diabetes.csv'
names = ['preg', 'plas', 'pres', 'skin', 'test', 'mass', 'pedi', 'age', 'class']
dataframe = read_csv(path, names=names)
array = dataframe.values
24.
Feature Importance
Example:
Next, wewill separate array into input and output components:
X = array[:,0:8]
Y = array[:,8]
The following lines of code will select the best features from dataset:
model = ExtraTreesClassifier()
model.fit(X, Y)
print(model.feature_importances_)
25.
Feature Importance
Example:
Output
[ 0.110700690.2213717 0.08824115 0.08068703 0.07281761
0.14548537 0.12654214 0.15415431]
Note: From the output, we can observe that there are scores for each
attribute. The higher the score, higher is the importance of that attribute.
26.
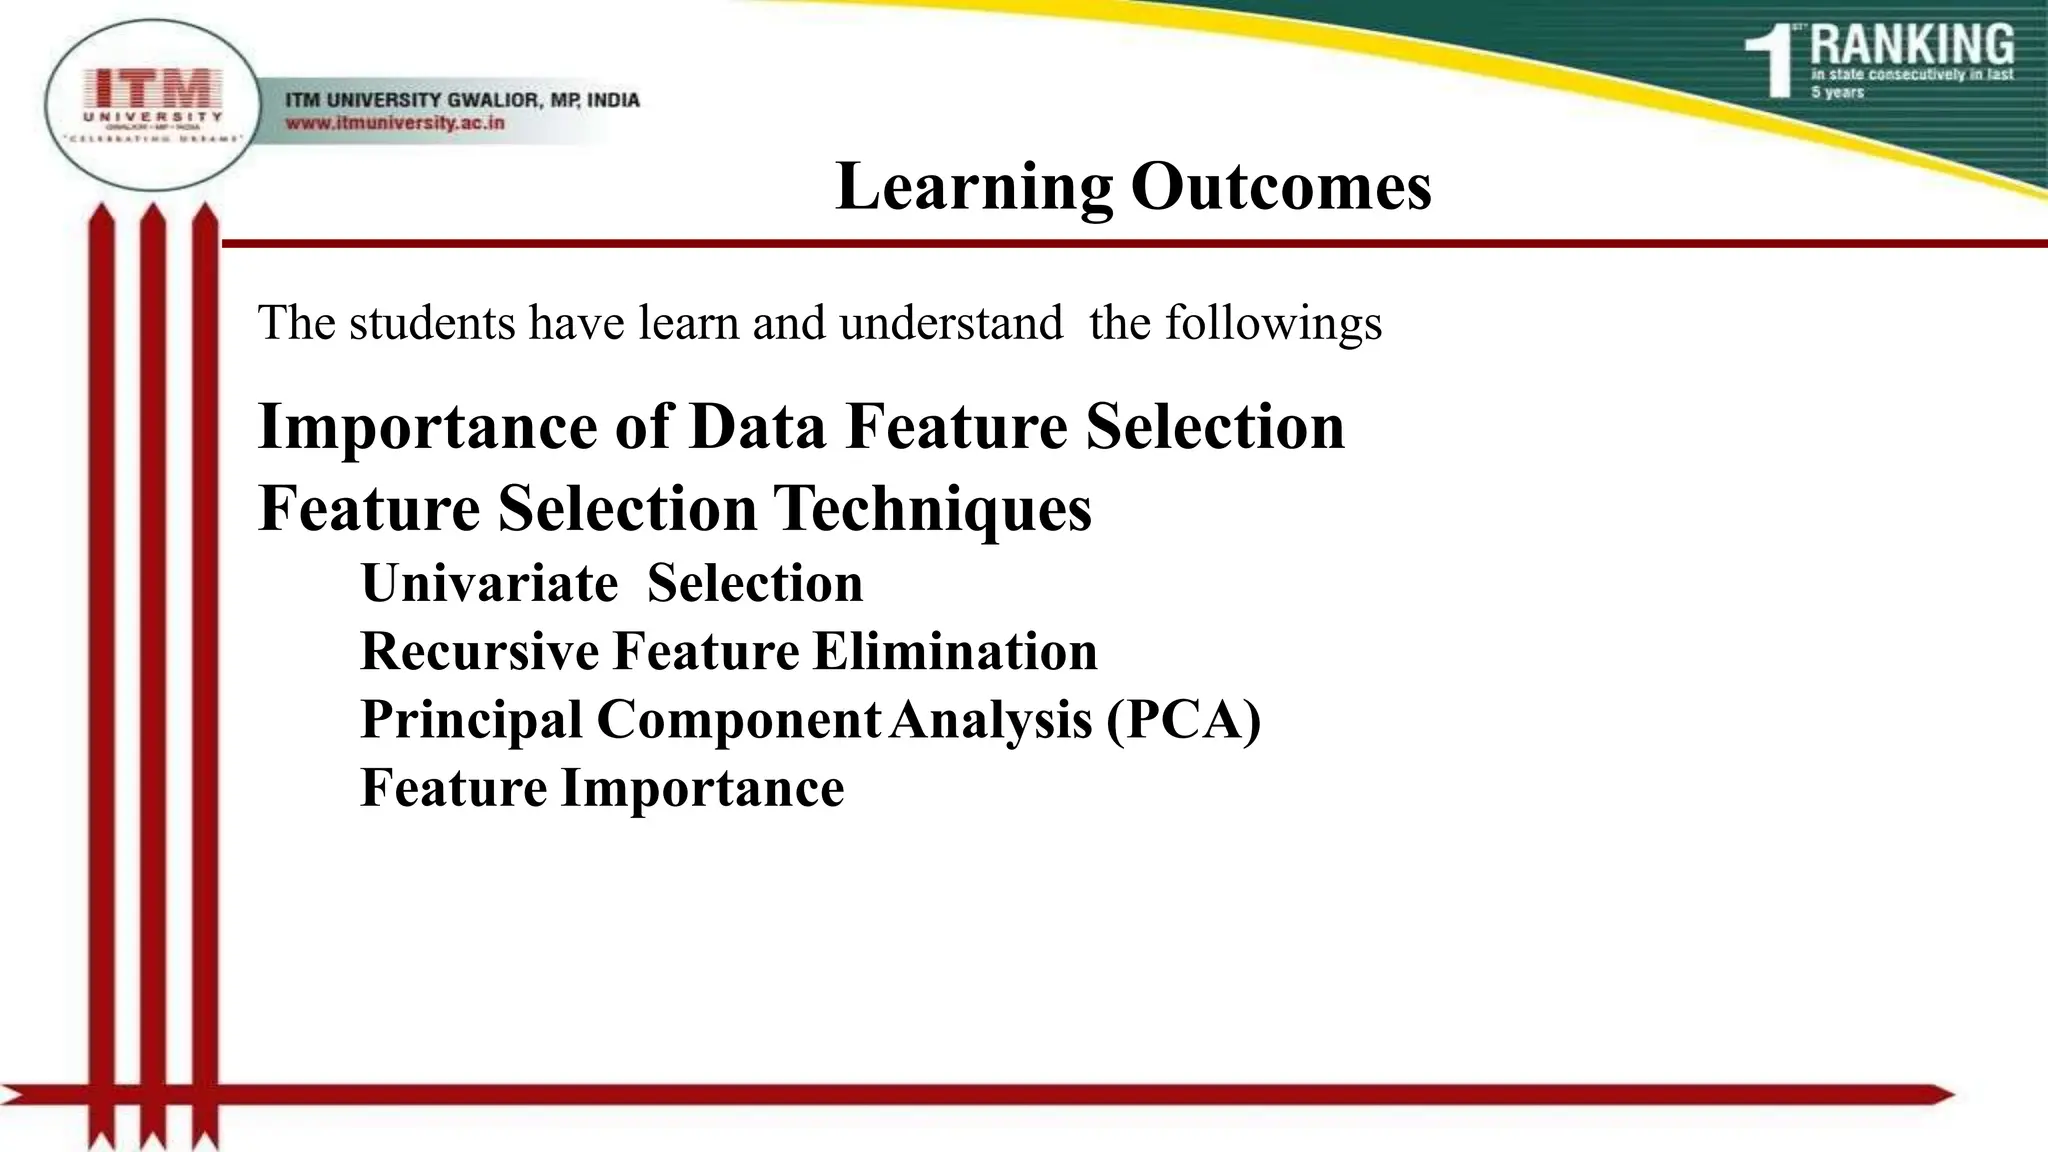
Learning Outcomes
The studentshave learn and understand the followings
Importance of Data Feature Selection
Feature Selection Techniques
Univariate Selection
Recursive Feature Elimination
Principal ComponentAnalysis (PCA)
Feature Importance
27.
References
1. Machine LearningforAbsolute Beginners by Oliver Theobald. 2019
2. http://noracook.io/Books/Python/introductiontomachinelearningwithpython.pdf
3. https://www.tutorialspoint.com/machine_learning_with_python/machine_learnin
g_with_python_tutorial.pdf


![Univariate Selection
Example:
In this example, we will use Pima Indians Diabetes dataset to select 4 of the
attributes having best features with the help of chi-square statistical test.
from pandas import read_csv
from numpy import set_printoptions
from sklearn.feature_selection import SelectKBest
from sklearn.feature_selection import chi2
path = r'C:pima-indians-diabetes.csv'
names = ['preg', 'plas', 'pres', 'skin', 'test', 'mass', 'pedi', 'age', 'class']
dataframe = read_csv(path, names=names)
array = dataframe.values](https://image.slidesharecdn.com/csl0777-l07-231224121318-95e49dbf/75/CSL0777-L07-pptx-10-2048.jpg)
![Univariate Selection
Example:
Next, we will separate array into input and output components:
X = array[:,0:8]
Y = array[:,8]
The following lines of code will select the best features from dataset:
test = SelectKBest(score_func=chi2, k=4)
fit = test.fit(X,Y)](https://image.slidesharecdn.com/csl0777-l07-231224121318-95e49dbf/75/CSL0777-L07-pptx-11-2048.jpg)
![Univariate Selection
Example:
We can also summarize the data for output as per our choice. Here, we are
setting the precision to 2 and showing the 4 data attributes with best features
along with best score of each attribute:
set_printoptions(precision=2)
print(fit.scores_)
featured_data = fit.transform(X)
print ("nFeatured data:n", featured_data[0:4])](https://image.slidesharecdn.com/csl0777-l07-231224121318-95e49dbf/75/CSL0777-L07-pptx-12-2048.jpg)
![Univariate Selection
Example:
Output
[ 111.52 1411.89 17.61 53.11 2175.57 127.67 5.39 181.3 ]
Featured data:
[[148. 0. 33.6 50. ]
[ 85. 0. 26.6 31. ]
[183. 0. 23.3 32. ]
[ 89. 94. 28.1 21. ]]](https://image.slidesharecdn.com/csl0777-l07-231224121318-95e49dbf/75/CSL0777-L07-pptx-13-2048.jpg)

![Recursive Feature Elimination
Example:
In this example, we will use RFE with logistic regression algorithm to select the
best 3 attributes having the best features from Pima Indians Diabetes dataset.
from pandas import read_csv
from sklearn.feature_selection import RFE
from sklearn.linear_model import LogisticRegression
path = r'C:pima-indians-diabetes.csv'
names = ['preg', 'plas', 'pres', 'skin', 'test', 'mass', 'pedi', 'age', 'class']
dataframe = read_csv(path, names=names)
array = dataframe.values](https://image.slidesharecdn.com/csl0777-l07-231224121318-95e49dbf/75/CSL0777-L07-pptx-15-2048.jpg)
![Recursive Feature Elimination
Example:
Next, we will separate array into input and output components:
X = array[:,0:8]
Y = array[:,8]
The following lines of code will select the best features from dataset:
model = LogisticRegression()
rfe = RFE(model, 3)
fit = rfe.fit(X, Y)
print("Number of Features: %d")
print("Selected Features: %s")
print("Feature Ranking: %s“)](https://image.slidesharecdn.com/csl0777-l07-231224121318-95e49dbf/75/CSL0777-L07-pptx-16-2048.jpg)
![Recursive Feature Elimination
Example:
Output
Number of Features: 3
Selected Features: [ True False False False False True True False]
Feature Ranking: [1 2 3 5 6 1 1 4]
Note: We can see in above output, RFE choose preg, mass and pedi as the first
3 best features. They are marked as 1 in the output.](https://image.slidesharecdn.com/csl0777-l07-231224121318-95e49dbf/75/CSL0777-L07-pptx-17-2048.jpg)

![Principal Component Analysis (PCA)
Example:
In this example, we will use PCA to select best 3 Principal components from
Pima Indians Diabetes dataset.
from pandas import read_csv
from sklearn.decomposition import PCA
path = r'C:pima-indians-diabetes.csv'
names = ['preg', 'plas', 'pres', 'skin', 'test', 'mass', 'pedi', 'age', 'class']
dataframe = read_csv(path, names=names)
array = dataframe.values](https://image.slidesharecdn.com/csl0777-l07-231224121318-95e49dbf/75/CSL0777-L07-pptx-19-2048.jpg)
![Principal Component Analysis (PCA)
Example:
Next, we will separate array into input and output components:
X = array[:,0:8]
Y = array[:,8]
The following lines of code will select the best features from dataset:
pca = PCA(n_components=3)
fit = pca.fit(X)
print("Explained Variance: %s“ % fit.explained_variance_ratio_)
print(fit.components_)](https://image.slidesharecdn.com/csl0777-l07-231224121318-95e49dbf/75/CSL0777-L07-pptx-20-2048.jpg)
![Principal Component Analysis (PCA)
Example:
Output
Explained Variance: [ 0.88854663 0.06159078 0.02579012]
[[ -2.02176587e-03 9.78115765e-02 1.60930503e-02 6.07566861e-02
9.93110844e-01 1.40108085e-02 5.37167919e-04 -3.56474430e-03]
[ 2.26488861e-02 9.72210040e-01 1.41909330e-01 -5.78614699e-02
-9.46266913e-02 4.69729766e-02 8.16804621e-04 1.40168181e-01]
[ -2.24649003e-02 1.43428710e-01 -9.22467192e-01 -3.07013055e-01
2.09773019e-02 -1.32444542e-01 -6.39983017e-04 -1.25454310e-01]]
Note: We can observe from the above output that 3 Principal Components
bear little resemblance to the source data.](https://image.slidesharecdn.com/csl0777-l07-231224121318-95e49dbf/75/CSL0777-L07-pptx-21-2048.jpg)

![Feature Importance
Example:
In this example, we will use ExtraTreeClassifier to select features from Pima
Indians Diabetes dataset.
from pandas import read_csv
from sklearn.ensemble import ExtraTreesClassifier
path = r'C:pima-indians-diabetes.csv'
names = ['preg', 'plas', 'pres', 'skin', 'test', 'mass', 'pedi', 'age', 'class']
dataframe = read_csv(path, names=names)
array = dataframe.values](https://image.slidesharecdn.com/csl0777-l07-231224121318-95e49dbf/75/CSL0777-L07-pptx-23-2048.jpg)
![Feature Importance
Example:
Next, we will separate array into input and output components:
X = array[:,0:8]
Y = array[:,8]
The following lines of code will select the best features from dataset:
model = ExtraTreesClassifier()
model.fit(X, Y)
print(model.feature_importances_)](https://image.slidesharecdn.com/csl0777-l07-231224121318-95e49dbf/75/CSL0777-L07-pptx-24-2048.jpg)
![Feature Importance
Example:
Output
[ 0.11070069 0.2213717 0.08824115 0.08068703 0.07281761
0.14548537 0.12654214 0.15415431]
Note: From the output, we can observe that there are scores for each
attribute. The higher the score, higher is the importance of that attribute.](https://image.slidesharecdn.com/csl0777-l07-231224121318-95e49dbf/75/CSL0777-L07-pptx-25-2048.jpg)